You are not logged in.
This means you
CAN ONLY VIEW reports that were published prior to Monday, February 19, 2024.
You
MUST UPGRADE YOUR MEMBERSHIP if you want to see any current reports.
AFTER MARKET UPDATE - FRIDAY, MARCH 4TH, 2022
Previous After Market Report Next After Market Report >>>
|
|
|
|
DOW |
-179.86 |
33,614.80 |
-0.53% |
|
Volume |
1,177,672,478 |
+8% |
|
Volume |
5,260,701,700 |
+5% |
|
NASDAQ |
-224.50 |
13,313.44 |
-1.66% |
|
Advancers |
998 |
31% |
|
Advancers |
1,211 |
28% |
|
S&P 500 |
-34.62 |
4,328.87 |
-0.79% |
|
Decliners |
2,191 |
69% |
|
Decliners |
3,102 |
72% |
|
Russell 2000 |
-31.51 |
2,000.90 |
-1.55% |
|
52 Wk Highs |
137 |
|
|
52 Wk Highs |
64 |
|
|
S&P 600 |
-17.91 |
1,299.07 |
-1.36% |
|
52 Wk Lows |
275 |
|
|
52 Wk Lows |
542 |
|
|
The major averages signaled a market correction (M criteria) with a noted plunge to new lows for the year. A new rally attempt began with a "positive reversal" for all of the major indices on February 24th. Monday, March 7th marks Day 8 of the rally attempt. Followers of the fact-based investment system know to patiently watch for a solid follow-through day to confirm a new uptrend before any new buying efforts may be justified.
|
 |
Major Market Averages Endured More Distributional Pressure
Kenneth J. Gruneisen - Passed the CAN SLIM® Master's Exam
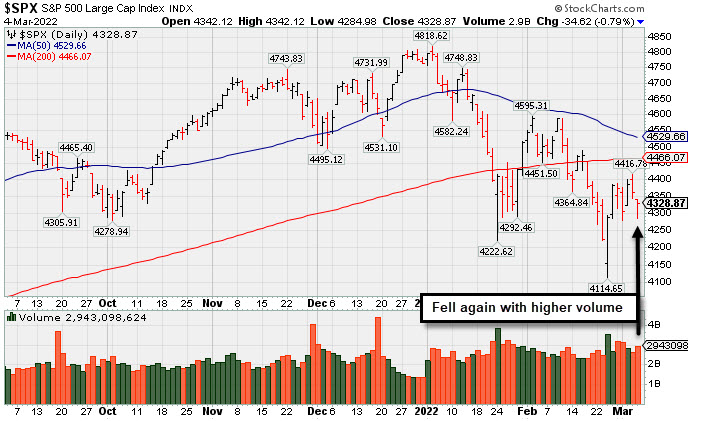
The Dow shed 179 points, registering its fourth consecutive weekly decline (-1.3%), its longest losing streak since November. The S&P 500 fell 0.8%, while the Nasdaq Composite slid 1.7%, with the benchmarks weathering weekly pullbacks of 1.3% and 2.8%, respectively. Volume totals reported were higher than the prior session on the NYSE and on the Nasdaq exchange, indicative of an increase in institutional selling termed "distribution". Breadth was clearly negative as decliners led advancers by more than a 2-1 margin on the NYSE and nearly 3-1 on the Nasdaq exchange. There were 35 high-ranked companies from the Leaders List that hit new 52-week highs and were listed on the BreakOuts Page, versus 29 on the prior session. New 52-week lows totals expanded and outnumbered new 52-week highs on the NYSE and on the Nasdaq exchange. The market averages (M criteria) are in a "correction" and disciplined investors are reminded to reduce exposure and raise cash.
 PICTURED: The S&P 500 Index fell again with higher volume on Day 7 of the rally attempt after slumping well below its 200-day moving average (DMA) line to a new 2022 low.
U.S. stocks finished firmly lower Friday as geopolitical risks stoked inflationary worries. Overseas, the Euro STOXX 600 retreated 7% for the week, its worst performance since March 2020.
Pressuring investor sentiment was news that Russian troops had seized Europe’s largest nuclear power plant, located in Ukraine. A fire broke out due to the attack, though officials reported that “essential” equipment had not been damaged. Amid the perceived risk-off tone, the yield on the 10-year note declined 23 basis points (0.23%) this week to 1.74%, while a gauge of the U.S. dollar jumped nearly 2%. Meanwhile, commodities extended their torrid run-up. West Texas Intermediate crude capped its best week since April 2020, surging roughly 26% to $115.49/barrel. Wheat futures soared a record 40% this week to the highest level since 2008 amid supply concerns.
Six of 11 S&P 500 sectors closed in negative territory, with Energy and traditionally defensive groups bucking the downtrend. Financials lagged, with the KBW Bank Index retreating 3.4%. In earnings, Broadcom Inc. (AVGO +3.01%) rose following positive results. Still, the Philadelphia Semiconductor Index briefly dipped into bear market territory, defined as a 20% drop from a recent peak.
On the data front, non-farm payrolls increased by 678,000 in February, well above estimates and the prior month’s 481,000 increase. The unemployment rate dropped to 3.8%, while wage inflation climbed 5.1% year-over-year, easing from January’s 5.5% annual advance. |
 Kenneth J. Gruneisen started out as a licensed stockbroker in August 1987, a couple of months prior to the historic stock market crash that took the Dow Jones Industrial Average down -22.6% in a single day. He has published daily fact-based fundamental and technical analysis on high-ranked stocks online for two decades. Through FACTBASEDINVESTING.COM, Kenneth provides educational articles, news, market commentary, and other information regarding proven investment systems that work in good times and bad.
Comments contained in the body of this report are technical opinions only and are not necessarily those of Gruneisen Growth Corp. The material herein has been obtained from sources believed to be reliable and accurate, however, its accuracy and completeness cannot be guaranteed. Our firm, employees, and customers may effect transactions, including transactions contrary to any recommendation herein, or have positions in the securities mentioned herein or options with respect thereto. Any recommendation contained in this report may not be suitable for all investors and it is not to be deemed an offer or solicitation on our part with respect to the purchase or sale of any securities. |
|
 |
Commodity-Linked Groups Rose on Negative Session
Kenneth J. Gruneisen - Passed the CAN SLIM® Master's Exam
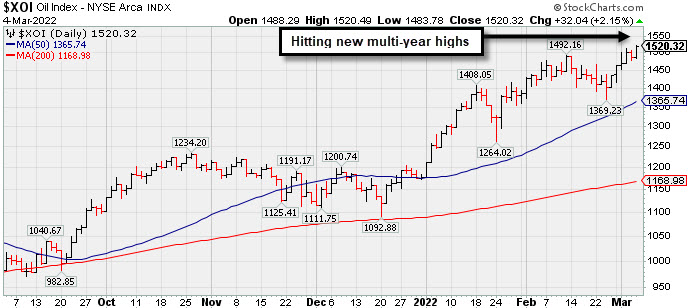
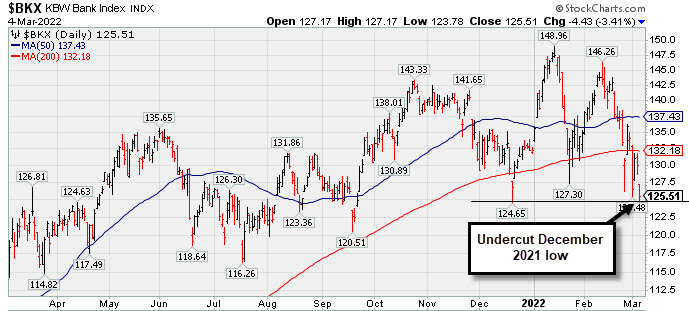
The Broker/Dealer Index ($XBD -2.76%), Bank Index ($BKX -3.41%), and Retail Index ($RLX -1.22%) created a drag on the major averages Friday. The Semiconductor Index ($SOX -2.42%), Networking Index ($NWX -1.91%), and Biotech Index ($BTK -1.16%) also suffered unanimous losses. Meanwhile, commodity-linked groups had a positive bias as the Gold & Silver Index ($XAU +3.24%), Oil Services Index ($OSX +3.47%), and Integrated Oil Index ($XOI +2.15%) posted unanimous gains. PICTURED: The Integrated Oil Index ($XOI +2.15%) is hitting new multi-year highs. PICTURED: The Bank Index ($BKX -3.41%) undercut its December 2021 low. Longtime readers may recognize that weakness in the financial indexes bodes poorly for the broader market outlook because the financials have been reliable "leading indicators".
| Oil Services |
$OSX |
73.25 |
+2.46 |
+3.47% |
+38.94% |
| Integrated Oil |
$XOI |
1,520.32 |
+32.04 |
+2.15% |
+29.04% |
| Semiconductor |
$SOX |
3,258.92 |
-80.84 |
-2.42% |
-17.42% |
| Networking |
$NWX |
861.71 |
-16.77 |
-1.91% |
-11.26% |
| Broker/Dealer |
$XBD |
453.66 |
-12.87 |
-2.76% |
-6.82% |
| Retail |
$RLX |
3,635.72 |
-44.78 |
-1.22% |
-13.98% |
| Gold & Silver |
$XAU |
155.05 |
+4.87 |
+3.24% |
+17.06% |
| Bank |
$BKX |
125.51 |
-4.43 |
-3.41% |
-5.08% |
| Biotech |
$BTK |
4,896.24 |
-57.23 |
-1.16% |
-11.28% |
|
|
|
 |
Featured Stocks
Kenneth J. Gruneisen - Passed the CAN SLIM® Master's Exam
|
|
|
Color Codes Explained :
Y - Better candidates highlighted by our
staff of experts.
G - Previously featured
in past reports as yellow but may no longer be buyable under the
guidelines.
***Last / Change / Volume data in this table is the closing quote data***
|
|
|
THESE ARE NOT BUY RECOMMENDATIONS!
Comments contained in the body of this report are technical
opinions only. The material herein has been obtained
from sources believed to be reliable and accurate, however,
its accuracy and completeness cannot be guaranteed.
This site is not an investment advisor, hence it does
not endorse or recommend any securities or other investments.
Any recommendation contained in this report may not
be suitable for all investors and it is not to be deemed
an offer or solicitation on our part with respect to
the purchase or sale of any securities. All trademarks,
service marks and trade names appearing in this report
are the property of their respective owners, and are
likewise used for identification purposes only.
This report is a service available
only to active Paid Premium Members.
You may opt-out of receiving report notifications
at any time. Questions or comments may be submitted
by writing to Premium Membership Services 665 S.E. 10 Street, Suite 201 Deerfield Beach, FL 33441-5634 or by calling 1-800-965-8307
or 954-785-1121.
|
|
|