You are not logged in.
This means you
CAN ONLY VIEW reports that were published prior to Monday, February 19, 2024.
You
MUST UPGRADE YOUR MEMBERSHIP if you want to see any current reports.
AFTER MARKET UPDATE - THURSDAY, MARCH 3RD, 2022
Previous After Market Report Next After Market Report >>>
|
|
|
|
DOW |
-96.69 |
33,794.66 |
-0.29% |
|
Volume |
1,092,225,783 |
-3% |
|
Volume |
5,021,884,600 |
-3% |
|
NASDAQ |
-214.07 |
13,537.94 |
-1.56% |
|
Advancers |
1,349 |
42% |
|
Advancers |
1,544 |
35% |
|
S&P 500 |
-23.05 |
4,363.49 |
-0.53% |
|
Decliners |
1,831 |
58% |
|
Decliners |
2,873 |
65% |
|
Russell 2000 |
-26.46 |
2,032.41 |
-1.29% |
|
52 Wk Highs |
104 |
|
|
52 Wk Highs |
59 |
|
|
S&P 600 |
-9.42 |
1,316.98 |
-0.71% |
|
52 Wk Lows |
125 |
|
|
52 Wk Lows |
315 |
|
|
The major averages signaled a market correction (M criteria) with last week's noted plunge to new lows for the year. Friday, March 4th marks Day 7 of the new rally attempt. Followers of the fact-based investment system know to patiently watch for a solid follow-through day, ideally between Day 4-7, to confirm a new uptrend before any new buying efforts may be justified.
|
 |
Major Indices Fell With Lighter Volume Totals
Kenneth J. Gruneisen - Passed the CAN SLIM® Master's Exam
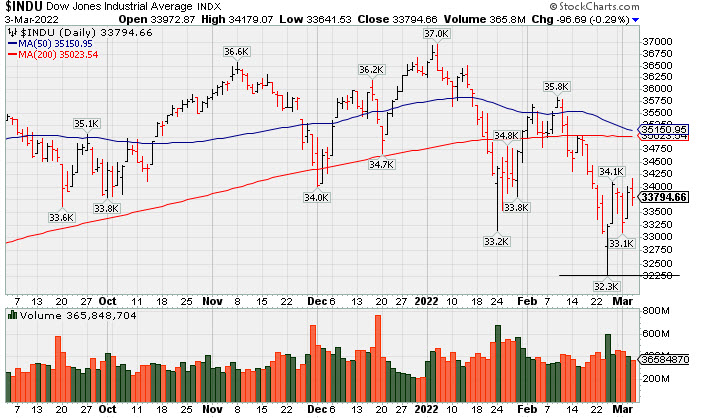
The Dow slipped 96 points, while the S&P 500 lost 0.5%. The Nasdaq Composite slumped 1.6% amid weakness in tech shares. Volume totals reported were lighter than the prior session on the NYSE and on the Nasdaq exchange. Breadth was negative as decliners led advancers by almost a 3-2 margin on the NYSE and nearly 2-1 on the Nasdaq exchange. There were 29 high-ranked companies from the Leaders List that hit new 52-week highs and were listed on the BreakOuts Page, versus 38 on the prior session. New 52-week lows totals expanded and outnumbered new 52-week highs on the NYSE and on the Nasdaq exchange. The market averages (M criteria) are in a "correction" and disciplined investors are reminded to reduce exposure and raise cash.
 PICTURED: The Dow Jones Industrial Average fell with lighter volume on Day 6 of a new rally attempt after slumping well below Its 200-day moving average (DMA) line to a new 2022 low.
U.S. stocks finished lower on Thursday as Wall Street assessed the impact of higher commodity prices on inflation and the global economic outlook. West Texas Intermediate crude fell 1.9% to $108.55/barrel, reversing earlier gains that sent the benchmark briefly above $116/barrel for the first time since 2008. Crude prices were whipsawed amid prospects an Iran nuclear deal could be reached within days, which would restore Iranian oil exports.
Central bank updates were in focus. In the final day of Federal Reserve (Fed) Chair Jerome Powell’s semi-annual Congressional testimony, he noted that upward inflation pressures could persist amid the Ukraine-Russia conflict. Yesterday, Powell reaffirmed expectations for a 25-basis point (0.25%) rate hike at the upcoming March 16 policy decision, but reiterated that officials would stay “nimble.” Treasuries were mostly higher, with the yield on the 10-year note down five basis points (0.05%) to 1.85%. On the data front, the Institute for Supply Management (ISM) showed U.S. services sector growth unexpectedly decelerated in February, with the purchasing managers’ index (PMI) slipping to 56.5, a one-year low.
Seven of 11 S&P 500 sectors closed in positive territory, with the traditionally defensive groups outperforming. Consumer Discretionary stocks led laggards as Amazon.com Inc. (AMZN -2.73%) and Tesla Inc. (TSLA -4.61%) both. In earnings, Kroger Co. (KR +11.61%) rose to a record after unveiling a robust profit forecast. Best Buy Co Inc. (BBY +9.22%) as the company’s improving long-term outlook overshadowed a disappointing holiday quarter. |
 Kenneth J. Gruneisen started out as a licensed stockbroker in August 1987, a couple of months prior to the historic stock market crash that took the Dow Jones Industrial Average down -22.6% in a single day. He has published daily fact-based fundamental and technical analysis on high-ranked stocks online for two decades. Through FACTBASEDINVESTING.COM, Kenneth provides educational articles, news, market commentary, and other information regarding proven investment systems that work in good times and bad.
Comments contained in the body of this report are technical opinions only and are not necessarily those of Gruneisen Growth Corp. The material herein has been obtained from sources believed to be reliable and accurate, however, its accuracy and completeness cannot be guaranteed. Our firm, employees, and customers may effect transactions, including transactions contrary to any recommendation herein, or have positions in the securities mentioned herein or options with respect thereto. Any recommendation contained in this report may not be suitable for all investors and it is not to be deemed an offer or solicitation on our part with respect to the purchase or sale of any securities. |
|
 |
Tech, Retail, and Financial Indexes Fell
Kenneth J. Gruneisen - Passed the CAN SLIM® Master's Exam
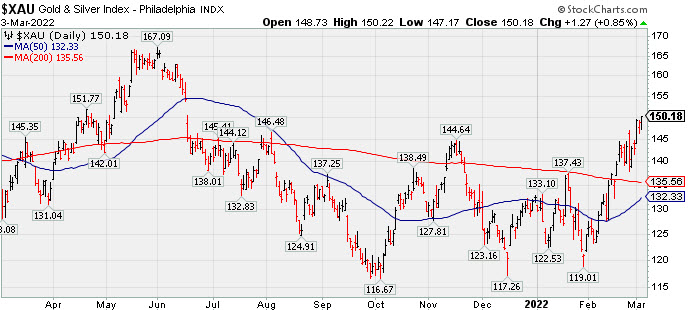
The Retail Index ($RLX -1.63%), Broker/Dealer Index ($XBD -1.47%), and Bank Index ($BKX -0.85%) each lost ground. The tech sector had a negative bias as the Semiconductor Index ($SOX -2.24%), Biotech Index ($BTK -1.05%), and Networking Index ($NWX -0.99%) lost ground. The Gold & Silver Index ($XAU +0.85%) posted a gain while the Oil Services Index ($OSX -0.06%) finished flat and the Integrated Oil Index ($XOI -0.90%) lost ground. PICTURED: The Gold & Silver Index ($XAU +0.85%) rose above its November 2021 high rebounding toward the June 2021 high.
| Oil Services |
$OSX |
70.79 |
-0.04 |
-0.06% |
+34.28% |
| Integrated Oil |
$XOI |
1,488.29 |
-13.44 |
-0.90% |
+26.32% |
| Semiconductor |
$SOX |
3,339.76 |
-76.40 |
-2.24% |
-15.37% |
| Networking |
$NWX |
878.48 |
-8.77 |
-0.99% |
-9.54% |
| Broker/Dealer |
$XBD |
466.53 |
-6.97 |
-1.47% |
-4.18% |
| Retail |
$RLX |
3,680.50 |
-60.86 |
-1.63% |
-12.92% |
| Gold & Silver |
$XAU |
150.18 |
+1.27 |
+0.85% |
+13.39% |
| Bank |
$BKX |
129.93 |
-1.11 |
-0.85% |
-1.73% |
| Biotech |
$BTK |
4,953.47 |
-52.37 |
-1.05% |
-10.24% |
|
|
|
 |
|
|
|
Color Codes Explained :
Y - Better candidates highlighted by our
staff of experts.
G - Previously featured
in past reports as yellow but may no longer be buyable under the
guidelines.
***Last / Change / Volume data in this table is the closing quote data***
|
|
|
THESE ARE NOT BUY RECOMMENDATIONS!
Comments contained in the body of this report are technical
opinions only. The material herein has been obtained
from sources believed to be reliable and accurate, however,
its accuracy and completeness cannot be guaranteed.
This site is not an investment advisor, hence it does
not endorse or recommend any securities or other investments.
Any recommendation contained in this report may not
be suitable for all investors and it is not to be deemed
an offer or solicitation on our part with respect to
the purchase or sale of any securities. All trademarks,
service marks and trade names appearing in this report
are the property of their respective owners, and are
likewise used for identification purposes only.
This report is a service available
only to active Paid Premium Members.
You may opt-out of receiving report notifications
at any time. Questions or comments may be submitted
by writing to Premium Membership Services 665 S.E. 10 Street, Suite 201 Deerfield Beach, FL 33441-5634 or by calling 1-800-965-8307
or 954-785-1121.
|
|
|