You are not logged in.
This means you
CAN ONLY VIEW reports that were published prior to Friday, February 23, 2024.
You
MUST UPGRADE YOUR MEMBERSHIP if you want to see any current reports.
AFTER MARKET UPDATE - TUESDAY, MARCH 3RD, 2020
Previous After Market Report Next After Market Report >>>
|
|
|
|
DOW |
-785.91 |
25,917.41 |
-2.94% |
|
Volume |
1,652,229,030 |
-4% |
|
Volume |
4,298,874,300 |
+2% |
|
NASDAQ |
-268.07 |
8,684.09 |
-2.99% |
|
Advancers |
937 |
35% |
|
Advancers |
971 |
30% |
|
S&P 500 |
-86.86 |
3,003.37 |
-2.81% |
|
Decliners |
1,755 |
65% |
|
Decliners |
2,213 |
69% |
|
Russell 2000 |
-32.41 |
1,486.08 |
-2.13% |
|
52 Wk Highs |
27 |
|
|
52 Wk Highs |
77 |
|
|
S&P 600 |
-19.29 |
888.60 |
-2.12% |
|
52 Wk Lows |
171 |
|
|
52 Wk Lows |
180 |
|
|
During market corrections it is especially important to reduce exposure, preserve your capital, and just be patient. Be safe! Historic studies have shown that the biggest up sessions have occurred during market corrections and bear markets.
Disciplined investors know to wait until a new confirmed rally marked by a solid follow-through day. The bold portion of the daily market commentary will note when that happens. For any clarification or additional help applying the fact-based investment system, we invite members to call, or contact us via the inquiry form.
|
 |
Indices Reverse Gains Amid Uncertainty of Emergency Rate Cut
Kenneth J. Gruneisen - Passed the CAN SLIM® Master's Exam
Equity benchmarks whipsawed, with the Dow paring a more than 300 point early session gain to finish 785 points lower. The S&P 500 declined 2.8%, while the Nasdaq Composite retreated 3.0%. Breadth was clearly positive as advancers led decliners by more than a 4-1 margin on the NYSE and by more than 2-1 on the Nasdaq exchange. The reported volume totals were mixed, lighter than the prior session total on the NYSE and higher on the Nasdaq exchange. Leadership remained thin as there were only 6 high-ranked companies from the Leaders List that hit a new 52-week high and were listed on the BreakOuts Page, versus 5 on the prior session. New 52-week lows totals easily outnumbered new 52-week highs on the NYSE and on the Nasdaq exchange. The major indices' (M criteria) have come under heavier pressure and earned the label of a "market correction". Disciplined investors know to watch for technical sell signals on a case-by-case basis and stand ready to reduce exposure especially if the market suffers more damaging losses. The Featured Stocks Page provides the most timely analysis on high-ranked leaders. Charts used courtesy of www.stockcharts.com
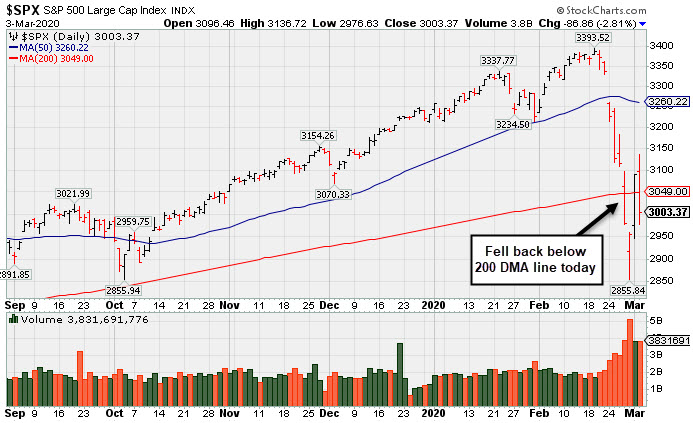
PICTURED: The S&P 500 Index fell back below its 200-day moving average (DMA) line with a big loss adding to a recent spurt of damaging volume-driven losses. The benchmark index is -11.5% off its all-time high hit on 2/19/20.
Volatile trading followed Monday’s session which saw the Dow surge 5.1%, its largest percentage gain since 2009 and biggest jump in points (1,293) on record. U.S. stocks declined on Tuesday, as investors assessed the Federal Reserve’s surprise announcement to cut its benchmark rate by 50 basis points. In an unanimous vote, policymakers reduced rates for the first time outside of a scheduled meeting since 2008. The policy statement reiterated the resilience of the U.S. economy, and noted that officials would continue to monitor the economic risks related to the coronavirus.
Treasuries rallied, with the yield on the 10-year note tumbling 14 basis points to 1.01%, after briefly trading at a fresh record low of 0.90%. On the short end of the curve, the yield on the two-year note plummeted 18 basis points to 0.71%. In commodities, WTI crude gained 1.1% to $47.26/barrel, while COMEX gold added 2.6% to $1,636.10/ounce.
All 11 S&P 500 sectors finished in negative territory, with seven groups down more than 2% on the day. Technology shares led laggards, with Microsoft (MSFT -4.79%) falling. Financials also underperformed amid a sharp decline in interest rates. In corporate news, Target (TGT -2.95%) fell after its quarterly sales missed consensus expectations and the retailer provided disappointing forward guidance. Visa (V -3.43%) fell after cautioning that its March quarter revenue growth would likely fall 2.5% to 3.5% short of previous forecasts.
|
 Kenneth J. Gruneisen started out as a licensed stockbroker in August 1987, a couple of months prior to the historic stock market crash that took the Dow Jones Industrial Average down -22.6% in a single day. He has published daily fact-based fundamental and technical analysis on high-ranked stocks online for two decades. Through FACTBASEDINVESTING.COM, Kenneth provides educational articles, news, market commentary, and other information regarding proven investment systems that work in good times and bad.
Comments contained in the body of this report are technical opinions only and are not necessarily those of Gruneisen Growth Corp. The material herein has been obtained from sources believed to be reliable and accurate, however, its accuracy and completeness cannot be guaranteed. Our firm, employees, and customers may effect transactions, including transactions contrary to any recommendation herein, or have positions in the securities mentioned herein or options with respect thereto. Any recommendation contained in this report may not be suitable for all investors and it is not to be deemed an offer or solicitation on our part with respect to the purchase or sale of any securities. |
|
 |
Gold & Silver Index Posts Standout Gain on Widely Negative Session
Kenneth J. Gruneisen - Passed the CAN SLIM® Master's Exam
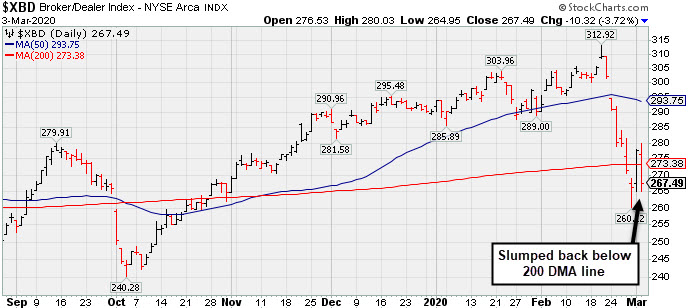
The Bank Index ($BKX -4.61%) and Broker/Dealer Index ($XBD -3.72%) both outpaced the Retail Index ($RLX -2.07%) to the downside with solid losses. The tech sector had a negative bias as the Networking Index ($NWX -2.10%), Biotech Index ($BTK -2.55%), and Semiconductor Index ($SOX -3.41%) each suffered solid losses. Commodity-linked groups were mixed as the Oil Services Index ($OSX -4.95%) and Integrated Oil Index ($XOI -2.34%) both slumped, meanwhile, the Gold & Silver Index ($XAU +3.68%) was a standout gainer.
PICTURED: The Broker/Dealer Index ($XBD -3.72%) slumped back below its 200-day moving average (DMA) line.
| Oil Services |
$OSX |
50.94 |
-2.66 |
-4.96% |
-34.93% |
| Integrated Oil |
$XOI |
946.16 |
-22.68 |
-2.34% |
-25.53% |
| Semiconductor |
$SOX |
1,705.26 |
-60.12 |
-3.41% |
-7.80% |
| Networking |
$NWX |
491.52 |
-10.57 |
-2.10% |
-15.75% |
| Broker/Dealer |
$XBD |
267.49 |
-10.32 |
-3.72% |
-7.88% |
| Retail |
$RLX |
2,404.81 |
-50.92 |
-2.07% |
-1.82% |
| Gold & Silver |
$XAU |
101.47 |
+3.60 |
+3.68% |
-5.10% |
| Bank |
$BKX |
91.11 |
-4.41 |
-4.62% |
-19.63% |
| Biotech |
$BTK |
4,903.40 |
-128.53 |
-2.55% |
-3.24% |
|
|
|
 |
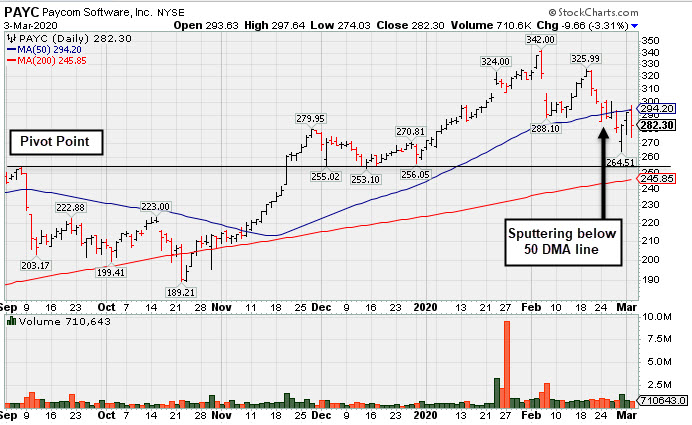
Sputtering Below 50-Day Moving Average
Kenneth J. Gruneisen - Passed the CAN SLIM® Master's Exam
Paycom Software Inc (PAYC -$9.66 or -3.31% to $282.30) rebounded near its 50-day moving average (DMA) line ($294) which acted as resistance today. It found prompt support after undercutting the prior high ($279.95 on 11/27/19). Additional gains above the 50 DMA line still are needed for its outlook to improve.
Fundamentals remain strong after it reported earnings +41% on +29% for the Dec '19 quarter. It has the highest possible Earnings Per Share Rating of 99, well above the 80+ minimum guideline for buy candidates. The 4 latest quarterly comparisons were above the +25% minimum earnings guideline (C criteria). Its annual earnings (A criteria) history has been strong and steady.
The Computer Software - Enterprise firm's current Up/Down Volume Ratio of 1.0 is an unbiased indication its shares have been neutral concefrning accumulation/distribution over the past 50 days. Its small supply of only 58.4 million shares outstanding (S criteria) can contribute to greater price volatility in the event of institutional buying or selling. The number of top-rated funds owning its shares rose from 384 in Jun '17 to 923 in Dec '19, a reassuring sign concerning the I criteria. It has a Timeliness rating of A and Sponsorship rating of B. It completed Secondary Offerings on 11/13/15, 9/16/15, 5/15/15 and 1/14/15 since its $15 IPO on 4/15/14. |
|
|
Color Codes Explained :
Y - Better candidates highlighted by our
staff of experts.
G - Previously featured
in past reports as yellow but may no longer be buyable under the
guidelines.
***Last / Change / Volume data in this table is the closing quote data***
Symbol/Exchange
Company Name
Industry Group |
PRICE |
CHANGE
(%Change) |
Day High |
Volume
(% DAV)
(% 50 day avg vol) |
52 Wk Hi
% From Hi |
Featured
Date |
Price
Featured |
Pivot Featured |
|
Max Buy |
 FTNT
-
NASDAQ
FTNT
-
NASDAQ
Fortinet Inc
Computer Sftwr-Security
|
$103.53
|
-6.57
-5.97% |
$110.48
|
2,242,709
167.99% of 50 DAV
50 DAV is 1,335,000
|
$121.82
-15.01%
|
12/9/2019
|
$103.85
|
PP = $106.10
|
|
MB = $111.41
|
 Most Recent Note - 3/3/2020 5:17:22 PM
G - Slumped badly today for another volume-driven loss. A rebound above the 50 DMA line ($113.74) is needed for its outlook to improve. Reported earnings +29% on +21% sales revenues for the Dec '19 quarter, continuing its strong earnings track record above the +25% minimum guideline (C criteria).
>>> FEATURED STOCK ARTICLE : Volume Driven Losses Violated 50-Day Moving Average - 2/26/2020 |
View all notes |
Set NEW NOTE alert |
Company Profile |
SEC
News |
Chart |
Request a new note
C
A
S
I |
LULU
-
NASDAQ
Lululemon Athletica
MANUFACTURING - Textile Manufacturing
|
$227.13
|
-1.77
-0.77% |
$235.42
|
3,567,126
239.40% of 50 DAV
50 DAV is 1,490,000
|
$266.20
-14.68%
|
9/6/2019
|
$201.25
|
PP = $194.35
|
|
MB = $204.07
|
Most Recent Note - 3/3/2020 5:18:09 PM
G - Churned heavy volume today and ended lower. Only a prompt rebound above the 50 DMA line ($240) would help its outlook improve. Fundamentals remain strong.
>>> FEATURED STOCK ARTICLE : Perched at Record High After 4th Consecutive Gain on Light Volume - 2/20/2020 |
View all notes |
Set NEW NOTE alert |
Company Profile |
SEC
News |
Chart |
Request a new note
C
A
S
I |
SPLK
-
NASDAQ
Splunk Inc
Computer Sftwr-Database
|
$148.50
|
-3.52
-2.32% |
$156.51
|
3,003,183
192.51% of 50 DAV
50 DAV is 1,560,000
|
$176.31
-15.77%
|
11/25/2019
|
$147.79
|
PP = $142.16
|
|
MB = $149.27
|
Most Recent Note - 3/3/2020 5:19:14 PM
G - Churned heavy volume today and ended lower. Due to report earnings news on 3/04/20. Only a prompt rebound above the 50 DMA line ($158) would help its outlook improve.
>>> FEATURED STOCK ARTICLE : Perched at Record High After 7th Consecutive Gain - 2/19/2020 |
View all notes |
Set NEW NOTE alert |
Company Profile |
SEC
News |
Chart |
Request a new note
C
A
S
I |
PAYC
-
NYSE
Paycom Software Inc
COMPUTER SOFTWARE and SERVICES - Application Software
|
$282.30
|
-9.66
-3.31% |
$297.64
|
710,643
73.41% of 50 DAV
50 DAV is 968,000
|
$342.00
-17.46%
|
11/20/2019
|
$252.97
|
PP = $259.81
|
|
MB = $272.80
|
Most Recent Note - 3/3/2020 5:16:10 PM
G - Met resistance after rebounding near its 50 DMA line ($294). Additional gains above that important short-term average still are needed to help its outlook improve. Fundamentals remain strong after it reported earnings +41% on +29% for the Dec '19 quarter. See the latest FSU analysis for more details and a new annotated graph.
>>> FEATURED STOCK ARTICLE : Sputtering Below 50-Day Moving Average - 3/3/2020 |
View all notes |
Set NEW NOTE alert |
Company Profile |
SEC
News |
Chart |
Request a new note
C
A
S
I |
TEAM
-
NASDAQ
Atlassian Corp Plc Cl A
Comp Sftwr-Spec Enterprs
|
$145.72
|
-1.10
-0.75% |
$151.57
|
2,618,832
161.16% of 50 DAV
50 DAV is 1,625,000
|
$156.12
-6.66%
|
1/24/2020
|
$144.66
|
PP = $140.49
|
|
MB = $147.51
|
Most Recent Note - 3/2/2020 5:37:54 PM
Y - Posted a 2nd consecutive gain with above average volume, showing resilience and still consolidating above its 50 DMA line ($138) amid widespread market weakness (M criteria). Fundamentals remain strong.
>>> FEATURED STOCK ARTICLE : Atlassian Has Been Hovering Near its All-Time High - 2/12/2020 |
View all notes |
Set NEW NOTE alert |
Company Profile |
SEC
News |
Chart |
Request a new note
C
A
S
I |
Symbol/Exchange
Company Name
Industry Group |
PRICE |
CHANGE
(%Change) |
Day High |
Volume
(% DAV)
(% 50 day avg vol) |
52 Wk Hi
% From Hi |
Featured
Date |
Price
Featured |
Pivot Featured |
|
Max Buy |
STNE
-
NASDAQ
Stoneco Ltd Cl A
Finance-CrdtCard/PmtPr
|
$44.29
|
+0.43
0.98% |
$46.69
|
5,173,415
265.17% of 50 DAV
50 DAV is 1,951,000
|
$45.72
-3.13%
|
1/22/2020
|
$43.94
|
PP = $45.72
|
|
MB = $48.01
|
Most Recent Note - 3/3/2020 12:58:16 PM
Y - Touched a new all-time high with today's 4th volume-driven gain in the span of 5 sessions. Volume-driven gain helped it promptly rebound above its 50 DMA line ($41.76). Reported earnings +71% on +43% sales revenues for the Dec '19 quarter, continuing its strong earnings track record. The worrisome market correction (M criteria) is cause for concern, even if there are subsequent gains above the pivot point backed by at least +40% above average volume to trigger a technical buy signal. See the latest FSU analysis for more details and an annotated graph.
>>> FEATURED STOCK ARTICLE : Volume-Driven Gain Above 50-Day Moving Average - 3/2/2020 |
View all notes |
Set NEW NOTE alert |
Company Profile |
SEC
News |
Chart |
Request a new note
C
A
S
I |
DAVA
-
NYSE
Endava Plc Cl A Ads
Computer-Tech Services
|
$53.68
|
+0.65
1.23% |
$54.15
|
219,558
174.25% of 50 DAV
50 DAV is 126,000
|
$56.76
-5.43%
|
2/13/2020
|
$53.71
|
PP = $49.86
|
|
MB = $52.35
|
Most Recent Note - 3/2/2020 12:36:24 PM
G - Still perched near its all-time high, which makes it an outlier in a very weak market (M criteria). Prior highs in the $49 area define initial support to watch above its 50 DMA line ($48.57).
>>> FEATURED STOCK ARTICLE : Breakout Gain Backed By +462% Above Average Volme - 2/13/2020 |
View all notes |
Set NEW NOTE alert |
Company Profile |
SEC
News |
Chart |
Request a new note
C
A
S
I |
|
|
|
THESE ARE NOT BUY RECOMMENDATIONS!
Comments contained in the body of this report are technical
opinions only. The material herein has been obtained
from sources believed to be reliable and accurate, however,
its accuracy and completeness cannot be guaranteed.
This site is not an investment advisor, hence it does
not endorse or recommend any securities or other investments.
Any recommendation contained in this report may not
be suitable for all investors and it is not to be deemed
an offer or solicitation on our part with respect to
the purchase or sale of any securities. All trademarks,
service marks and trade names appearing in this report
are the property of their respective owners, and are
likewise used for identification purposes only.
This report is a service available
only to active Paid Premium Members.
You may opt-out of receiving report notifications
at any time. Questions or comments may be submitted
by writing to Premium Membership Services 665 S.E. 10 Street, Suite 201 Deerfield Beach, FL 33441-5634 or by calling 1-800-965-8307
or 954-785-1121.
|
|
|