You are not logged in.
This means you
CAN ONLY VIEW reports that were published prior to Saturday, February 24, 2024.
You
MUST UPGRADE YOUR MEMBERSHIP if you want to see any current reports.
AFTER MARKET UPDATE - TUESDAY, MARCH 1ST, 2022
Previous After Market Report Next After Market Report >>>
|
|
|
|
DOW |
-597.65 |
33,294.95 |
-1.76% |
|
Volume |
1,328,620,641 |
-20% |
|
Volume |
6,056,194,300 |
+3% |
|
NASDAQ |
-218.94 |
13,532.46 |
-1.59% |
|
Advancers |
1,294 |
41% |
|
Advancers |
1,662 |
38% |
|
S&P 500 |
-67.68 |
4,306.26 |
-1.55% |
|
Decliners |
1,862 |
59% |
|
Decliners |
2,684 |
62% |
|
Russell 2000 |
-39.58 |
2,008.51 |
-1.93% |
|
52 Wk Highs |
109 |
|
|
52 Wk Highs |
67 |
|
|
S&P 600 |
-25.00 |
1,291.11 |
-1.90% |
|
52 Wk Lows |
133 |
|
|
52 Wk Lows |
229 |
|
|
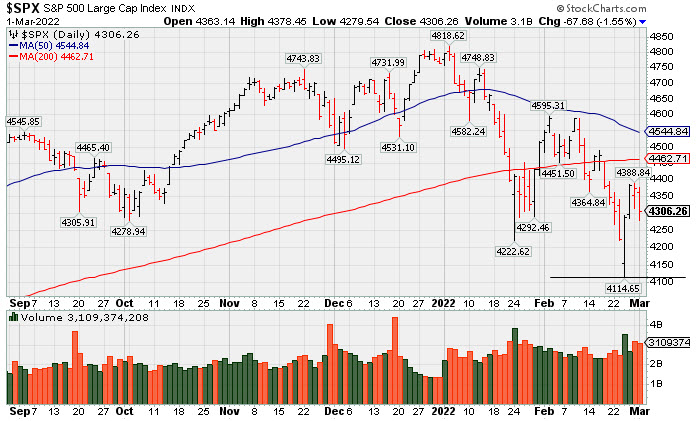
The major averages signaled a market correction (M criteria) with last week's noted plunge to new lows for the year. Wednesday, March 2nd will mark Day 5 of the new rally attempt. Followers of the fact-based investment system know to patiently watch for a solid follow-through day between Day 4-7 to confirm a new uptrend before any new buying efforts may be justified.
|
 |
Major Averages Fell on Day 4 of New Rally Attempt
Kenneth J. Gruneisen - Passed the CAN SLIM® Master's Exam
The Dow lost 597 points, while the S&P 500 and Nasdaq Composite each shed 1.6%. Volume totals reported were mixed, lighter than the prior session on the NYSE and higher on the Nasdaq exchange. Decliners led advancers by a 3-2 margin on the NYSE and on the Nasdaq exchange. There were 32 high-ranked companies from the Leaders List that hit new 52-week highs and were listed on the BreakOuts Page, versus 26 on the prior session. New 52-week lows totals still outnumbered new 52-week highs totals on the NYSE and on the Nasdaq exchange. The market averages (M criteria) are in a "correction" and disciplined investors are reminded to reduce exposure and raise cash.
 PICTURED: The S&P 500 Index suffered a loss on Day 4 of a new rally attempt after slumping well below Its 200-day moving average (DMA) line to a new 2022 low.
U.S. stocks finished firmly lower on Tuesday as Wall Street continued monitoring headlines around the escalating Ukraine-Russia conflict. Investors struck a decidedly risk-off tone amid worries a more destructive phase of the war was still to come. Also pressuring sentiment, West Texas Intermediate crude spiked 9.1% to $104.44/barrel, settling at its highest level in more than seven years despite the U.S. and other major economies agreeing on a coordinated release of crude stockpiles. Additionally, a measure of broader commodity prices surged the most since 2009, further stoking inflationary concerns. On Capitol Hill, all eyes will be on President Biden’s first State of the Union address at 9:00 p.m. ET tonight.
Perceived safe haven assets caught a bid, with COMEX gold soaring 2.4% to $1,946.20/ounce, while a gauge of the U.S. dollar jumped 0.7%. The yield on the 10-year Treasury note dropped 10 basis points (0.10%) to 1.73%, its lowest level since mid-January. The yield on the two-year Treasury note slid nine basis points (0.09%) to 1.35%, as market participants dialed back expectations for a more aggressive Federal Reserve rate hike path as the crisis in Eastern Europe dented economic growth prospects.
Ten of 11 S&P 500 sectors closed in negative territory, with Energy the lone advancer. Financials led the decline, falling 3.7% in tandem with the drop in Treasury yields. Chipmakers also lagged, with the Philadelphia Semiconductor Index sinking 3.6%. Big-box retailer Target Corp. (TGT +9.84%) bucked the downtrend after easily topping consensus earnings estimates and providing an upbeat outlook. |
 Kenneth J. Gruneisen started out as a licensed stockbroker in August 1987, a couple of months prior to the historic stock market crash that took the Dow Jones Industrial Average down -22.6% in a single day. He has published daily fact-based fundamental and technical analysis on high-ranked stocks online for two decades. Through FACTBASEDINVESTING.COM, Kenneth provides educational articles, news, market commentary, and other information regarding proven investment systems that work in good times and bad.
Comments contained in the body of this report are technical opinions only and are not necessarily those of Gruneisen Growth Corp. The material herein has been obtained from sources believed to be reliable and accurate, however, its accuracy and completeness cannot be guaranteed. Our firm, employees, and customers may effect transactions, including transactions contrary to any recommendation herein, or have positions in the securities mentioned herein or options with respect thereto. Any recommendation contained in this report may not be suitable for all investors and it is not to be deemed an offer or solicitation on our part with respect to the purchase or sale of any securities. |
|
 |
Financial and Tech Indexes Led Decliners; Gold & Silver Index Rose
Kenneth J. Gruneisen - Passed the CAN SLIM® Master's Exam
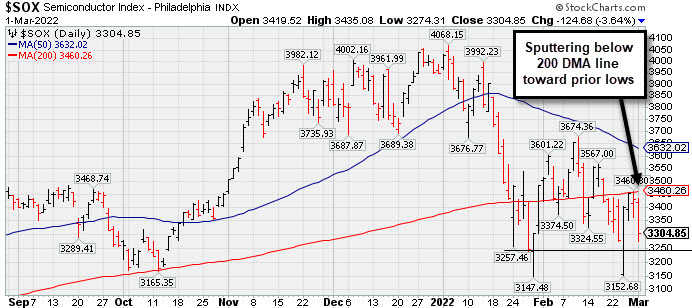
Financial stocks were weak and had a negative impact on the major averages Tuesday as the Bank Index ($BKX -5.72%) and Broker/Dealer Index ($XBD -3.50%) both suffered large losses. The Semiconductor Index ($SOX -3.64%) led the tech sector lower, followed by the Networking Index ($NWX -2.52%), while the Biotech Index ($BTK -0.05%) finished flat. The Retail Index ($RLX -0.50%) also edged lower. The Gold & Silver Index ($XAU +4.59%) posted a standout gain. Energy-linked groups were mixed as the Oil Services Index ($OSX -2.25%) fell while the Integrated Oil Index ($XOI +0.46%) edged higher. PICTURED: The Semiconductor Index ($SOX -3.64%) has been sputtering below its 200-day moving average (DMA) line toward prior lows.
| Oil Services |
$OSX |
67.83 |
-1.56 |
-2.25% |
+28.67% |
| Integrated Oil |
$XOI |
1,471.04 |
+6.67 |
+0.46% |
+24.85% |
| Semiconductor |
$SOX |
3,304.85 |
-124.68 |
-3.64% |
-16.25% |
| Networking |
$NWX |
860.63 |
-22.23 |
-2.52% |
-11.37% |
| Broker/Dealer |
$XBD |
464.30 |
-16.82 |
-3.50% |
-4.63% |
| Retail |
$RLX |
3,684.50 |
-18.43 |
-0.50% |
-12.82% |
| Gold & Silver |
$XAU |
149.36 |
+6.55 |
+4.59% |
+12.77% |
| Bank |
$BKX |
126.48 |
-7.68 |
-5.72% |
-4.34% |
| Biotech |
$BTK |
4,992.56 |
-2.30 |
-0.05% |
-9.53% |
|
|
|
 |
Featured Stocks
Kenneth J. Gruneisen - Passed the CAN SLIM® Master's Exam
|
|
|
Color Codes Explained :
Y - Better candidates highlighted by our
staff of experts.
G - Previously featured
in past reports as yellow but may no longer be buyable under the
guidelines.
***Last / Change / Volume data in this table is the closing quote data***
Symbol/Exchange
Company Name
Industry Group |
PRICE |
CHANGE
(%Change) |
Day High |
Volume
(% DAV)
(% 50 day avg vol) |
52 Wk Hi
% From Hi |
Featured
Date |
Price
Featured |
Pivot Featured |
|
Max Buy |
 REGN
-
NASDAQ
REGN
-
NASDAQ
Regeneron Pharmaceutical
DRUGS - Biotechnology
|
$607.03
|
-11.33
-1.83% |
$623.63
|
617,119
80.15% of 50 DAV
50 DAV is 770,000
|
$686.62
-11.59%
|
12/13/2021
|
$647.95
|
PP = $686.72
|
|
MB = $721.06
|
 Most Recent Note - 3/1/2022 5:02:00 PM
G - Volume totals have been cooling while still consolidating in a tight range below its 50 DMA line ($618.88) and above its 200 DMA line ($602.22). Prior lows in the $592-596 area define important near-term support.
>>> FEATURED STOCK ARTICLE : Earnings News Due While Consolidating Above 200 DMA Line - 2/1/2022 |
View all notes |
Set NEW NOTE alert |
Company Profile |
SEC
News |
Chart |
Request a new note
C
A
S
I |
SF
-
NYSE
Stifel Financial Corp
FINANCIAL SERVICES - Investment Brokerage - Regiona
|
$68.88
|
-4.62
-6.29% |
$73.05
|
1,047,068
167.00% of 50 DAV
50 DAV is 627,000
|
$83.28
-17.29%
|
1/27/2022
|
$74.17
|
PP = $76.23
|
|
MB = $80.04
|
Most Recent Note - 3/1/2022 5:04:31 PM
Violated its 200 DMA line with today's volume-driven loss raising greater concerns. Its Relative Strength Rating has slumped to 76, below the 80+ minimum guideline for buy candidates. It will be dropped from the Featured Stocks list tonight.
>>> FEATURED STOCK ARTICLE : Fourth Loss Following "Negative Reversal" at All-Time High - 2/14/2022 |
View all notes |
Set NEW NOTE alert |
Company Profile |
SEC
News |
Chart |
Request a new note
C
A
S
I |
TGH
-
NYSE
Textainer Group Holdings
TRANSPORTATION - Logistics
|
$34.65
|
-0.86
-2.42% |
$35.69
|
390,251
89.10% of 50 DAV
50 DAV is 438,000
|
$41.89
-17.28%
|
1/31/2022
|
$36.68
|
PP = $41.34
|
|
MB = $43.41
|
Most Recent Note - 3/1/2022 5:06:17 PM
G - Slumped with lighter than average volume today testing its 200 DMA line and prior lows. More damaging losses would raise greater concerns. A rebound above the 50 DMA line ($37.32) is needed for its outlook to improve and it faces resistance due to overhead supply up to the $41 level. Recently reported Dec '21 quarterly earnings +80% on +23% sales revenues versus the year ago period.
>>> FEATURED STOCK ARTICLE : Consolidating Near High Following Strong Earnings Report - 2/15/2022 |
View all notes |
Set NEW NOTE alert |
Company Profile |
SEC
News |
Chart |
Request a new note
C
A
S
I |
HWKN
-
NASDAQ
Hawkins Inc
CHEMICALS - Basic Chemicals
|
$43.72
|
-1.54
-3.40% |
$45.81
|
103,546
175.50% of 50 DAV
50 DAV is 59,000
|
$45.33
-3.55%
|
2/3/2022
|
$39.81
|
PP = $41.07
|
|
MB = $43.12
|
Most Recent Note - 3/1/2022 5:00:42 PM
G - There was a "negative reversal" today after hitting a new all-time high. Prior highs in the $40 area define initial support above its 50 DMA line ($39.78).
>>> FEATURED STOCK ARTICLE : Extended From Prior Base After 6th Consecutive Gain - 2/18/2022 |
View all notes |
Set NEW NOTE alert |
Company Profile |
SEC
News |
Chart |
Request a new note
C
A
S
I |
|
|
|
THESE ARE NOT BUY RECOMMENDATIONS!
Comments contained in the body of this report are technical
opinions only. The material herein has been obtained
from sources believed to be reliable and accurate, however,
its accuracy and completeness cannot be guaranteed.
This site is not an investment advisor, hence it does
not endorse or recommend any securities or other investments.
Any recommendation contained in this report may not
be suitable for all investors and it is not to be deemed
an offer or solicitation on our part with respect to
the purchase or sale of any securities. All trademarks,
service marks and trade names appearing in this report
are the property of their respective owners, and are
likewise used for identification purposes only.
This report is a service available
only to active Paid Premium Members.
You may opt-out of receiving report notifications
at any time. Questions or comments may be submitted
by writing to Premium Membership Services 665 S.E. 10 Street, Suite 201 Deerfield Beach, FL 33441-5634 or by calling 1-800-965-8307
or 954-785-1121.
|
|
|