You are not logged in.
This means you
CAN ONLY VIEW reports that were published prior to Friday, February 23, 2024.
You
MUST UPGRADE YOUR MEMBERSHIP if you want to see any current reports.
AFTER MARKET UPDATE - MONDAY, FEBRUARY 28TH, 2022
Previous After Market Report Next After Market Report >>>
|
|
|
|
DOW |
-166.15 |
33,892.60 |
-0.49% |
|
Volume |
1,652,218,282 |
+48% |
|
Volume |
5,897,444,400 |
+28% |
|
NASDAQ |
+56.77 |
13,751.40 |
+0.41% |
|
Advancers |
1,512 |
48% |
|
Advancers |
2,170 |
50% |
|
S&P 500 |
-10.71 |
4,373.94 |
-0.24% |
|
Decliners |
1,633 |
52% |
|
Decliners |
2,190 |
50% |
|
Russell 2000 |
+7.16 |
2,048.09 |
+0.35% |
|
52 Wk Highs |
68 |
|
|
52 Wk Highs |
62 |
|
|
S&P 600 |
+5.35 |
1,316.11 |
+0.41% |
|
52 Wk Lows |
104 |
|
|
52 Wk Lows |
185 |
|
|
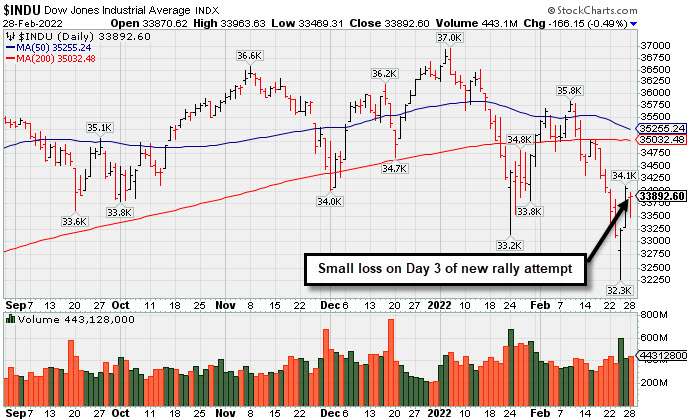
The major averages signaled a market correction (M criteria) with last week's noted plunge to new lows for the year. Tuesday, March 1st will mark Day 4 of the new rally attempt. Followers of the fact-based investment system know to patiently watch for a solid follow-through day between Day 4-7 to confirm a new uptrend before any new buying efforts may be justified.
|
 |
Major Indices Ended Indecisive Session Mixed
Kenneth J. Gruneisen - Passed the CAN SLIM® Master's Exam
The Dow shed 166 points, notching its worst month since November (-3.5%). The S&P 500 slipped 0.2%, extending its February drop to 3.1%, while the Nasdaq Composite climbed 0.4%, paring its monthly decline to 3.4%. Volume totals reported were higher than the prior session on the NYSE and on the Nasdaq exchange. Advancers and decliners were evenly mixed on the NYSE and on the Nasdaq exchange. There were 26 high-ranked companies from the Leaders List that hit new 52-week highs and were listed on the BreakOuts Page, versus 19 on the prior session. New 52-week lows totals still outnumbered new 52-week highs totals on the NYSE and on the Nasdaq exchange. The market averages (M criteria) are in a "correction" and disciplined investors are reminded to reduce exposure and raise cash.
 PICTURED: The Dow Jones Industrial Average suffered a small loss on Day 3 of a new rally attempt after slumping well below Its 200-day moving average (DMA) line to a new 2022 low.
U.S. stocks fluctuated on Monday as Wall Street continued to monitor the Russia-Ukraine conflict. The volatile session capped a second straight monthly decline for the major averages--a losing streak not seen since October 2020.
Over the weekend, the U.S. and its allies announced more sanctions against Russia, including penalties aimed at undermining the country’s financial institutions. Moscow retaliated with countersanctions, while its central bank implemented capital controls and hiked its benchmark lending rate to 20% from 9.5% as its currency dropped as much as 30%. Meanwhile, officials from Russia and Ukraine reportedly concluded initial ceasefire talks, with a second round of discussions potentially being held in the coming days. Still, battles around key Ukrainian cities are persisting.
Amid the risk-off mood, Treasuries rallied, with the yield on the 10-year note falling 14 basis points (0.14%) to 1.83% and the two-year note yield dropping 13 basis points (0.13%) to 1.44%. On the data front the Chicago purchasing managers’ index fell more than expected in February to 56.3, its lowest level since August 2020. Separately, a measure of manufacturing activity in the Dallas Fed region improved more than forecasted to 14.0 this month from January’s 2.0 print.
Seven of 11 S&P 500 sectors finished in negative territory, with Real Estate and Financials leading laggards. Energy stocks outperformed with West Texas Intermediate crude climbing 4.7% to $95.86/barrel. |
 Kenneth J. Gruneisen started out as a licensed stockbroker in August 1987, a couple of months prior to the historic stock market crash that took the Dow Jones Industrial Average down -22.6% in a single day. He has published daily fact-based fundamental and technical analysis on high-ranked stocks online for two decades. Through FACTBASEDINVESTING.COM, Kenneth provides educational articles, news, market commentary, and other information regarding proven investment systems that work in good times and bad.
Comments contained in the body of this report are technical opinions only and are not necessarily those of Gruneisen Growth Corp. The material herein has been obtained from sources believed to be reliable and accurate, however, its accuracy and completeness cannot be guaranteed. Our firm, employees, and customers may effect transactions, including transactions contrary to any recommendation herein, or have positions in the securities mentioned herein or options with respect thereto. Any recommendation contained in this report may not be suitable for all investors and it is not to be deemed an offer or solicitation on our part with respect to the purchase or sale of any securities. |
|
 |
Energy Linked Groups Led Gainers as Financials Fell
Kenneth J. Gruneisen - Passed the CAN SLIM® Master's Exam
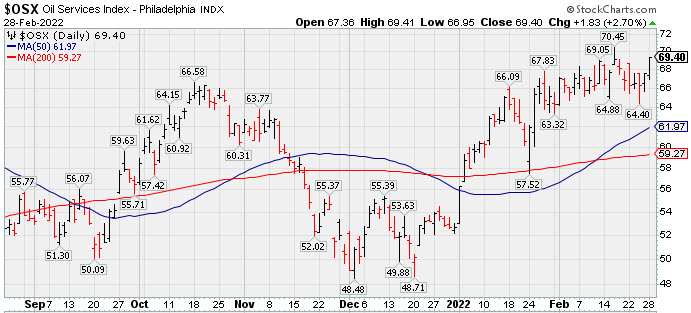
The Bank Index ($BKX -1.31%) and Broker/Dealer Index ($XBD -1.03%) both lost ground and created a drag on the major averages while the Retail Index ($RLX -0.08%) finished flat. The Oil Services Index ($OSX +2.70%) Integrated Oil Index ($XOI +1.99%) were standout gainers while the Gold & Silver Index ($XAU -0.09%) finished unchanged. The tech sector was mixed as the Semiconductor Index ($SOX -0.67%) edged lower while the Biotech Index ($BTK +0.31%) and Networking Index ($NWX +0.54%) both edged higher. PICTURED: The Oil Services Index ($OSX +2.70%) posted a solid gain and closed near its 2022 high.
| Oil Services |
$OSX |
69.40 |
+1.83 |
+2.70% |
+31.63% |
| Integrated Oil |
$XOI |
1,464.37 |
+28.60 |
+1.99% |
+24.29% |
| Semiconductor |
$SOX |
3,429.53 |
-23.14 |
-0.67% |
-13.09% |
| Networking |
$NWX |
882.86 |
+4.72 |
+0.54% |
-9.08% |
| Broker/Dealer |
$XBD |
481.13 |
-5.01 |
-1.03% |
-1.18% |
| Retail |
$RLX |
3,702.93 |
-2.83 |
-0.08% |
-12.39% |
| Gold & Silver |
$XAU |
142.81 |
-0.13 |
-0.09% |
+7.82% |
| Bank |
$BKX |
134.16 |
-1.79 |
-1.31% |
+1.47% |
| Biotech |
$BTK |
4,994.86 |
+15.30 |
+0.31% |
-9.49% |
|
|
|
 |
Featured Stocks
Kenneth J. Gruneisen - Passed the CAN SLIM® Master's Exam
|
|
|
Color Codes Explained :
Y - Better candidates highlighted by our
staff of experts.
G - Previously featured
in past reports as yellow but may no longer be buyable under the
guidelines.
***Last / Change / Volume data in this table is the closing quote data***
|
|
|
THESE ARE NOT BUY RECOMMENDATIONS!
Comments contained in the body of this report are technical
opinions only. The material herein has been obtained
from sources believed to be reliable and accurate, however,
its accuracy and completeness cannot be guaranteed.
This site is not an investment advisor, hence it does
not endorse or recommend any securities or other investments.
Any recommendation contained in this report may not
be suitable for all investors and it is not to be deemed
an offer or solicitation on our part with respect to
the purchase or sale of any securities. All trademarks,
service marks and trade names appearing in this report
are the property of their respective owners, and are
likewise used for identification purposes only.
This report is a service available
only to active Paid Premium Members.
You may opt-out of receiving report notifications
at any time. Questions or comments may be submitted
by writing to Premium Membership Services 665 S.E. 10 Street, Suite 201 Deerfield Beach, FL 33441-5634 or by calling 1-800-965-8307
or 954-785-1121.
|
|
|