***Last / Change / Volume data in this table is the closing quote data***
Symbol/Exchange
Company Name
Industry Group |
PRICE |
CHANGE
(%Change) |
Day High |
Volume
(% DAV)
(% 50 day avg vol) |
52 Wk Hi
% From Hi |
Featured
Date |
Price
Featured |
Pivot Featured |
|
Max Buy |
MLR
-
NYSE
Miller Industries Inc
AUTOMOTIVE - Auto Parts
|
$34.48
|
+0.27
0.79% |
$34.81
|
52,817
165.05% of 50 DAV
50 DAV is 32,000
|
$34.48
0.00%
|
11/30/2018
|
$28.35
|
PP = $29.50
|
|
MB = $30.98
|
Most Recent Note - 2/25/2019 12:55:04 PM
G - Very extended from the prior base and hitting another new all-time high with today's 9th consecutive gain. Prior highs and its 50 DMA line ($28.99) define near-term support to watch on pullbacks.
>>> FEATURED STOCK ARTICLE : Traded Above Pivot Point Recently Without Great Volume - 1/29/2019 |
View all notes |
Set NEW NOTE alert |
Company Profile |
SEC
News |
Chart |
Request a new note
C
A
S
I |
NSP
-
NYSE
Insperity Inc
Comml Svcs-Outsourcing
|
$126.05
|
-0.06
-0.05% |
$126.44
|
266,637
72.06% of 50 DAV
50 DAV is 370,000
|
$132.50
-4.87%
|
2/11/2019
|
$127.91
|
PP = $121.25
|
|
MB = $127.31
|
 Most Recent Note - 2/27/2019 1:54:41 PM
Y - Volume totals have been cooling and its color code is changed to yellow after pulling back below its "max buy" level. Prior highs in the $119-121 area define initial support to watch on pullbacks.
>>> FEATURED STOCK ARTICLE : Big Breakaway Gap Triggered Technical Buy Signal - 2/11/2019 |
View all notes |
Set NEW NOTE alert |
Company Profile |
SEC
News |
Chart |
Request a new note
C
A
S
I |
ZBRA
-
NASDAQ
Zebra Tech Corp Cl A
COMPUTER HARDWARE - Computer Peripherals
|
$202.48
|
-0.50
-0.25% |
$203.50
|
340,472
64.00% of 50 DAV
50 DAV is 532,000
|
$207.88
-2.60%
|
2/14/2019
|
$198.10
|
PP = $184.85
|
|
MB = $194.09
|
Most Recent Note - 2/22/2019 5:25:32 PM
G - Rallied further above its "max buy" level and finished near the session high with today's gain on higher (near average) volume. Prior highs in the $184 area define initial support to watch on pullbacks.
>>> FEATURED STOCK ARTICLE : Big Volume-Driven Gain for New High - 2/14/2019 |
View all notes |
Set NEW NOTE alert |
Company Profile |
SEC
News |
Chart |
Request a new note
C
A
S
I |
SPSC
-
NASDAQ
S P S Commerce Inc
COMPUTER SOFTWARE and SERVICES - Application Software
|
$107.39
|
+0.03
0.03% |
$108.03
|
90,827
52.20% of 50 DAV
50 DAV is 174,000
|
$113.31
-5.22%
|
2/13/2019
|
$104.30
|
PP = $100.78
|
|
MB = $105.82
|
Most Recent Note - 2/26/2019 6:42:40 PM
G - Pulled back today but remains above its "max buy" level, extended from the previously noted base. Prior highs in the $100 area define initial support to watch.
>>> FEATURED STOCK ARTICLE : Gap Up and Big Volume Driven Gain for New High - 2/13/2019 |
View all notes |
Set NEW NOTE alert |
Company Profile |
SEC
News |
Chart |
Request a new note
C
A
S
I |
SSNC
-
NASDAQ
S S & C Technologies
COMPUTER SOFTWARE and SERVICES - Application Software
|
$61.78
|
+0.07
0.11% |
$62.03
|
1,300,542
65.22% of 50 DAV
50 DAV is 1,994,000
|
$62.43
-1.04%
|
2/15/2019
|
$59.73
|
PP = $61.07
|
|
MB = $64.12
|
Most Recent Note - 2/25/2019 1:27:24 PM
Y - Hit a new high and rallied above the pivot point with above average volume behind today's gain. Stubbornly held its ground after highlighted in yellow in the 2/15/19 mid-day report.
>>> FEATURED STOCK ARTICLE : Volume-Driven Gain for New High Close - 2/19/2019 |
View all notes |
Set NEW NOTE alert |
Company Profile |
SEC
News |
Chart |
Request a new note
C
A
S
I |
Symbol/Exchange
Company Name
Industry Group |
PRICE |
CHANGE
(%Change) |
Day High |
Volume
(% DAV)
(% 50 day avg vol) |
52 Wk Hi
% From Hi |
Featured
Date |
Price
Featured |
Pivot Featured |
|
Max Buy |
IRBT
-
NASDAQ
Irobot Corp
CONSUMER DURABLES - Electronic Equipment
|
$124.07
|
+3.21
2.66% |
$124.74
|
511,845
62.96% of 50 DAV
50 DAV is 813,000
|
$123.26
0.66%
|
2/8/2019
|
$104.92
|
PP = $103.63
|
|
MB = $108.81
|
Most Recent Note - 2/25/2019 12:44:24 PM
G - Remains perched at its all-time high today stubbornly holding its ground after an impressive streak of 10 consecutive gains. Recent gains have lacked great volume conviction. It is extended from the previously noted "double bottom" base. Prior high ($103) defines initial support to watch on pullbacks.
>>> FEATURED STOCK ARTICLE : Volume-Driven Gains Cleared Prior High After Double Bottom - 2/8/2019 |
View all notes |
Set NEW NOTE alert |
Company Profile |
SEC
News |
Chart |
Request a new note
C
A
S
I |
LHCG
-
NASDAQ
L H C Group Inc
HEALTH SERVICES - Home Health Care
|
$106.39
|
-0.96
-0.89% |
$107.86
|
399,075
152.90% of 50 DAV
50 DAV is 261,000
|
$114.22
-6.86%
|
1/23/2019
|
$107.29
|
PP = $107.61
|
|
MB = $112.99
|
Most Recent Note - 2/27/2019 1:53:12 PM
Y - Due to report earnings news after the close today. Volume and volatility often increase near earnings news. Recent gains into new high territory lacked great volume conviction. Subsequent gains above the pivot point backed by at least +40% above average volume may help clinch a convincing technical buy signal.
>>> FEATURED STOCK ARTICLE : Recent Gains for New Highs Lacked Great Volume Conviction - 2/21/2019 |
View all notes |
Set NEW NOTE alert |
Company Profile |
SEC
News |
Chart |
Request a new note
C
A
S
I |
ENSG
-
NASDAQ
Ensign Group Inc
HEALTH SERVICES - Long-Term Care Facilities
|
$49.40
|
-0.48
-0.96% |
$50.10
|
307,973
82.79% of 50 DAV
50 DAV is 372,000
|
$54.56
-9.46%
|
2/7/2019
|
$48.71
|
PP = $49.06
|
|
MB = $51.51
|
Most Recent Note - 2/26/2019 6:35:50 PM
Y - Pulled back today with lighter volume. Prior highs in the $48 area define initial support to watch.
>>> FEATURED STOCK ARTICLE : Closed Near Pivot Point After Gap Up and Big Volume-Driven Gain - 2/7/2019 |
View all notes |
Set NEW NOTE alert |
Company Profile |
SEC
News |
Chart |
Request a new note
C
A
S
I |
NXST
-
NASDAQ
Nexstar Media Group Cl A
MEDIA - Broadcasting - TV
|
$95.49
|
+0.65
0.69% |
$96.75
|
645,104
112.98% of 50 DAV
50 DAV is 571,000
|
$95.15
0.36%
|
2/26/2019
|
$94.26
|
PP = $89.76
|
|
MB = $94.25
|
Most Recent Note - 2/26/2019 6:34:23 PM
Y - Finished strong after highlighted in yellow with pivot point cited based on its 12/04/18 high plus 10 cents in the earlier mid-day report. Hit a new 52-week high with today's big gain backed by +99% above average volume, clinching a technical buy signal. Recent quarterly comparisons through Dec '18 showed strong earnings increases above the +25% minimum guideline (C criteria) versus the year ago periods with encouraging sales revenues acceleration. See the latest FSU analysis for more details and a new annotated graph.
>>> FEATURED STOCK ARTICLE : Twice Average Volume Behind Gain for New High - 2/26/2019 |
View all notes |
Set NEW NOTE alert |
Company Profile |
SEC
News |
Chart |
Request a new note
C
A
S
I |
BSTC
-
NASDAQ
Biospecifics Technologie
Medical-Biomed/Biotech
|
$68.60
|
+0.70
1.03% |
$69.14
|
29,518
65.60% of 50 DAV
50 DAV is 45,000
|
$73.31
-6.42%
|
1/18/2019
|
$67.40
|
PP = $66.31
|
|
MB = $69.63
|
Most Recent Note - 2/25/2019 6:06:05 PM
Y - Color code is changed to yellow as this thinly-traded Biomed/Biotech firm is encountering mild distributional pressure while pulling back below its "max buy" level. Prior highs and its 50 DMA line define near-term support to watch on pullbacks.
>>> FEATURED STOCK ARTICLE : Reversed Into Red After Hitting a New High - 2/5/2019 |
View all notes |
Set NEW NOTE alert |
Company Profile |
SEC
News |
Chart |
Request a new note
C
A
S
I |
Symbol/Exchange
Company Name
Industry Group |
PRICE |
CHANGE
(%Change) |
Day High |
Volume
(% DAV)
(% 50 day avg vol) |
52 Wk Hi
% From Hi |
Featured
Date |
Price
Featured |
Pivot Featured |
|
Max Buy |
UBNT
-
NASDAQ
Ubiquiti Networks
TELECOMMUNICATIONS - Diversified Communication Serv
|
$147.53
|
+1.10
0.75% |
$148.68
|
426,612
108.55% of 50 DAV
50 DAV is 393,000
|
$146.93
0.41%
|
2/8/2019
|
$121.97
|
PP = $115.54
|
|
MB = $121.32
|
Most Recent Note - 2/27/2019 1:56:47 PM
G - Very extended from the prior base with today's 13th consecutive gain. Bullish action came after it reported earnings +75% on +23% sales revenues for the Dec '18 quarter. Prior high ($115) defines initial support to watch on pullbacks.
>>> FEATURED STOCK ARTICLE : Consolidating Above 50-Day Moving Average - 1/31/2019 |
View all notes |
Set NEW NOTE alert |
Company Profile |
SEC
News |
Chart |
Request a new note
C
A
S
I |
NOW
-
NYSE
Servicenow Inc
Computer Sftwr-Enterprse
|
$240.31
|
+4.10
1.74% |
$240.86
|
2,211,980
101.10% of 50 DAV
50 DAV is 2,188,000
|
$239.45
0.36%
|
1/31/2019
|
$218.14
|
PP = $206.40
|
|
MB = $216.72
|
Most Recent Note - 2/22/2019 5:33:57 PM
G - Posted a solid gain with near average volume for a best-ever close. Stubbornly held its ground near its all-time high in recent weeks. Prior high ($206) defines initial support to watch on pullbacks.
>>> FEATURED STOCK ARTICLE : Breakaway Gap Followed Strong Earnings Report - 2/1/2019 |
View all notes |
Set NEW NOTE alert |
Company Profile |
SEC
News |
Chart |
Request a new note
C
A
S
I |
PANW
-
NYSE
Palo Alto Networks
Computer Sftwr-Security
|
$254.88
|
+19.33
8.21% |
$260.63
|
6,558,058
500.62% of 50 DAV
50 DAV is 1,310,000
|
$239.50
6.42%
|
2/25/2019
|
$233.54
|
PP = $239.60
|
|
MB = $251.58
|
Most Recent Note - 2/27/2019 1:29:16 PM
Y - Hit a new all-time high with today's big "breakaway gap" clinching a technical buy signal while rising from a 23-week cup shaped base. Prior high ($239) defines initial support to watch on pullbacks. Reported earnings +44% on +30% sales revenues for the Jan '19 quarter, continuing its strong earnings track record. See the latest FSU analysis for more details and an annotated graph.
>>> FEATURED STOCK ARTICLE : Rebounded Near Prior High With Earnings News Due - 2/25/2019 |
View all notes |
Set NEW NOTE alert |
Company Profile |
SEC
News |
Chart |
Request a new note
C
A
S
I |
PAYC
-
NYSE
Paycom Software Inc
COMPUTER SOFTWARE and SERVICES - Application Software
|
$182.72
|
+2.29
1.27% |
$182.90
|
245,530
37.26% of 50 DAV
50 DAV is 659,000
|
$186.00
-1.76%
|
2/6/2019
|
$171.66
|
PP = $164.18
|
|
MB = $172.39
|
Most Recent Note - 2/22/2019 5:35:36 PM
G - Posted a solid gain today with higher (near average) volume for a new all-time high, getting more extended from any sound base. Prior high ($164) defines initial support to watch above its 50 DMA line.
>>> FEATURED STOCK ARTICLE : Breakaway Gap Backed by Volume +388% Above Average - 2/6/2019 |
View all notes |
Set NEW NOTE alert |
Company Profile |
SEC
News |
Chart |
Request a new note
C
A
S
I |
PYPL
-
NASDAQ
Paypal Holdings Inc
Finance-CrdtCard/PmtPr
|
$97.86
|
+1.27
1.31% |
$98.04
|
5,563,260
63.34% of 50 DAV
50 DAV is 8,783,000
|
$97.30
0.57%
|
1/24/2019
|
$92.56
|
PP = $93.80
|
|
MB = $98.49
|
Most Recent Note - 2/22/2019 5:23:31 PM
Y - Finished near the session high with another gain today on lighter than average volume, wedging into new high territory. See the latest FSU analysis for more details and a new annotated graph.
>>> FEATURED STOCK ARTICLE : Wedging into New High Territory With Gains Lacking Volume - 2/22/2019 |
View all notes |
Set NEW NOTE alert |
Company Profile |
SEC
News |
Chart |
Request a new note
C
A
S
I |
Symbol/Exchange
Company Name
Industry Group |
PRICE |
CHANGE
(%Change) |
Day High |
Volume
(% DAV)
(% 50 day avg vol) |
52 Wk Hi
% From Hi |
Featured
Date |
Price
Featured |
Pivot Featured |
|
Max Buy |
ALRM
-
NASDAQ
Alarm.com Holdings Inc
Security/Sfty
|
$65.05
|
+0.52
0.81% |
$65.36
|
473,173
92.42% of 50 DAV
50 DAV is 512,000
|
$65.65
-0.91%
|
1/22/2019
|
$60.52
|
PP = $60.30
|
|
MB = $63.32
|
Most Recent Note - 2/27/2019 1:47:55 PM
G - Due to report earnings news after the close on Thursday, February 28th. Volume and volatility often increase near earnings news. Volume totals have been cooling in recent weeks while still stubbornly holding its ground in a tight range perched near its all-time high. Prior highs in the $60 area define initial support above its 50 DMA line.
>>> FEATURED STOCK ARTICLE : Volume Totals Cooling While Perched at All-Time High - 2/20/2019 |
View all notes |
Set NEW NOTE alert |
Company Profile |
SEC
News |
Chart |
Request a new note
C
A
S
I |
PLNT
-
NYSE
Planet Fitness Inc Cl A
Leisure-Services
|
$58.45
|
+1.56
2.74% |
$61.90
|
3,805,474
288.73% of 50 DAV
50 DAV is 1,318,000
|
$61.51
-4.97%
|
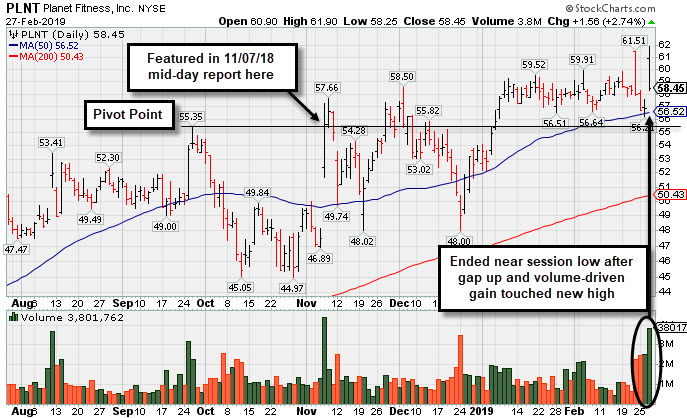
11/7/2018
|
$57.10
|
PP = $55.45
|
|
MB = $58.22
|
Most Recent Note - 2/27/2019 5:59:44 PM
G - Color code is changed to green after a gain above its "max buy" level as it met distributional pressure after hitting another new all-time high. Found support near its 50 DMA line ($56.52) and recent low. Reported earnings +42% on +30% sales revenues for the Dec '18 quarter. Volume and volatility often increase near earnings news. See the latest FSU analysis for additional details and a new annotated graph.
>>> FEATURED STOCK ARTICLE : Met Distributional Pressure While Hitting New High After Earnings - 2/27/2019 |
View all notes |
Set NEW NOTE alert |
Company Profile |
SEC
News |
Chart |
Request a new note
C
A
S
I |
TEAM
-
NASDAQ
Atlassian Corp Plc Cl A
Comp Sftwr-Spec Enterprs
|
$106.33
|
+0.45
0.43% |
$106.65
|
996,838
58.19% of 50 DAV
50 DAV is 1,713,000
|
$107.95
-1.50%
|
1/7/2019
|
$94.68
|
PP = $98.31
|
|
MB = $103.23
|
Most Recent Note - 2/25/2019 6:18:26 PM
G - Gapped up and posted a small gain with below average volume for a new all-time high. Recent gains lacked great volume conviction. Its prior high ($98.21) and 50 DMA line ($94.07) define near-term support to watch on pullbacks. Fundamentals remain strong.
>>> FEATURED STOCK ARTICLE : Volume Light While Hovering Near High - 1/28/2019 |
View all notes |
Set NEW NOTE alert |
Company Profile |
SEC
News |
Chart |
Request a new note
C
A
S
I |
GLOB
-
NYSE
Globant SA
Computer-Tech Services
|
$69.41
|
-0.77
-1.10% |
$70.50
|
184,916
79.02% of 50 DAV
50 DAV is 234,000
|
$74.00
-6.20%
|
2/15/2019
|
$69.35
|
PP = $70.00
|
|
MB = $73.50
|
Most Recent Note - 2/22/2019 5:32:10 PM
Y - Posted a gain today with light volume for a best-ever close. Volume totals have been cooling since 2/15/19 when noted as it rallied from an advanced "3-weeks tight" base.
>>> FEATURED STOCK ARTICLE : Volume-Driven Gain From Advanced "3-Weeks Tight" Base - 2/15/2019 |
View all notes |
Set NEW NOTE alert |
Company Profile |
SEC
News |
Chart |
Request a new note
C
A
S
I |
TTD
-
NASDAQ
The Trade Desk Inc Cl A
Comml Svcs-Advertising
|
$195.00
|
-0.50
-0.26% |
$199.60
|
1,236,215
92.46% of 50 DAV
50 DAV is 1,337,000
|
$202.30
-3.61%
|
2/6/2019
|
$148.65
|
PP = $149.00
|
|
MB = $156.45
|
Most Recent Note - 2/26/2019 12:58:20 PM
G - Holding its ground near its all-time high. Color code was changed to green after a gap up and considerable gain above its "max buy" level backed by heavy volume. Bullish action on the prior session came after it reported earnings +102% on +56% sales revenues for the Dec '18 quarter.
>>> FEATURED STOCK ARTICLE : Near High After Third Consecutive Gain with Light Volume - 2/12/2019 |
View all notes |
Set NEW NOTE alert |
Company Profile |
SEC
News |
Chart |
Request a new note
C
A
S
I |
Symbol/Exchange
Company Name
Industry Group |
PRICE |
CHANGE
(%Change) |
Day High |
Volume
(% DAV)
(% 50 day avg vol) |
52 Wk Hi
% From Hi |
Featured
Date |
Price
Featured |
Pivot Featured |
|
Max Buy |
MEDP
-
NASDAQ
Medpace Holdings Inc
Medical-Research Eqp/Svc
|
$56.05
|
+0.96
1.74% |
$56.37
|
1,334,324
154.97% of 50 DAV
50 DAV is 861,000
|
$71.66
-21.78%
|
1/30/2019
|
$64.10
|
PP = $65.19
|
|
MB = $68.45
|
Most Recent Note - 2/26/2019 12:08:46 PM
G - Reported earnings +95% on +71% sales revenues for the Dec '18 quarter. continuing its strong earnings track record. Gapped down today following earnings news, negating the recent breakout and violating its 50 DMA line ($60) with a damaging volume-driven loss triggering a technical sell signal.
>>> FEATURED STOCK ARTICLE : Rallied Near 52-Week High With a Volume-Driven Gain - 1/30/2019 |
View all notes |
Set NEW NOTE alert |
Company Profile |
SEC
News |
Chart |
Request a new note
C
A
S
I |