You are not logged in.
This means you
CAN ONLY VIEW reports that were published prior to Friday, February 23, 2024.
You
MUST UPGRADE YOUR MEMBERSHIP if you want to see any current reports.
AFTER MARKET UPDATE - WEDNESDAY, FEBRUARY 26TH, 2020
Previous After Market Report Next After Market Report >>>
|
|
|
|
DOW |
-123.77 |
26,957.59 |
-0.46% |
|
Volume |
1,316,479,740 |
-3% |
|
Volume |
3,544,029,000 |
-1% |
|
NASDAQ |
+15.16 |
8,980.77 |
+0.17% |
|
Advancers |
940 |
34% |
|
Advancers |
1,171 |
37% |
|
S&P 500 |
-11.82 |
3,116.39 |
-0.38% |
|
Decliners |
1,861 |
66% |
|
Decliners |
2,010 |
63% |
|
Russell 2000 |
-19.14 |
1,552.76 |
-1.22% |
|
52 Wk Highs |
28 |
|
|
52 Wk Highs |
41 |
|
|
S&P 600 |
-11.89 |
935.03 |
-1.26% |
|
52 Wk Lows |
352 |
|
|
52 Wk Lows |
244 |
|
|
 |
Major Indices Ended Mixed After Abrupt Market Correction
Kenneth J. Gruneisen - Passed the CAN SLIM® Master's Exam
The Dow slipped 123 points, erasing a 461 point advance earlier in the session. The S&P 500 reversed a gain of more than 1% to end the day down 0.4%. The Nasdaq Composite added 0.2%, lifting the Tech-heavy index back into positive territory for the year. Breadth was negative as decliners led advancers by a 2-1 margin on the NYSE and by nearly 2-1 on the Nasdaq exchange. The reported volume totals were slightly lower than the prior session totals on the NYSE and on the Nasdaq exchange. Leadership was thin as there were only 8 high-ranked companies from the Leaders List that hit a new 52-week high and were listed on the BreakOuts Page, down from the 139 on last Wednesday's session. New 52-week lows totals solidly outnumbered shrinking new 52-week highs on the NYSE and on the Nasdaq exchange. The major indices' (M criteria) have come under heavier pressure and quickly earned the label of a "market correction". Disciplined investors know to watch for technical sell signals on a case-by-case basis and stand ready to reduce exposure especially if the market suffers more damaging losses. The Featured Stocks Page provides the most timely analysis on high-ranked leaders. Charts used courtesy of www.stockcharts.com
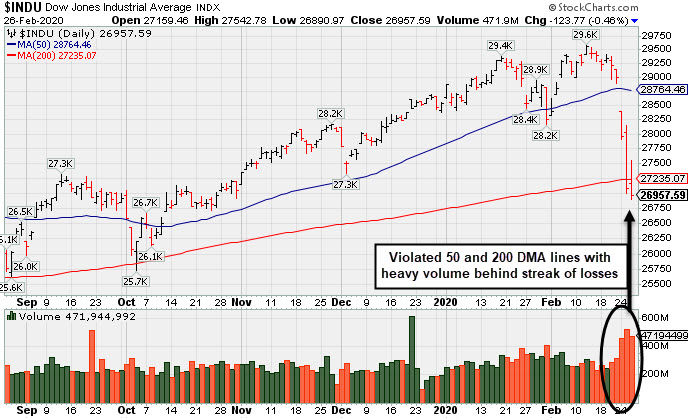
PICTURED: The Dow Jones Industrial Average is -8.8% off its all-time high after 5 consecutive losses marked by heavier volume. It has violated its 50-day and 200-day moving average (DMA) lines.
Stocks finished mixed on Wednesday. Investors digested reports that New York state officials were monitoring a group for exposure to the coronavirus. Stocks have retreated sharply this week amid growing fears that the coronavirus could become a global pandemic. The S&P 500’s collective 6.3% slump on Monday and Tuesday marked the worst two-session drop for the benchmark since August 2015.
Ten of 11 S&P 500 sectors closed in negative territory, with Technology shares bucking the downtrend. The Energy group led decliners, with WTI crude sliding further into bear market territory, down 2.3% to $48.73. According to Bloomberg, trading volume during the last five days has jumped to its highest level since December of 2018.
In corporate news, Disney (DIS -3.77%) following an announcement that Bob Iger stepped down as CEO. In earnings, TJX Companies (TJX +7.3%) gapped up after delivering better-than-expected same-store sales during the holiday period. Elsewhere, Toll Brothers (TOL -14.61%) plunged following disappointing quarterly figures from the luxury home builder.
Treasuries ended little changed, with the yield on the 10-year note steady at 1.34% after dipping to a record low of 1.31% during intraday trading on Tuesday. On the data front, new home sales spiked 7.9% in January to the highest level since July 2007. |
 Kenneth J. Gruneisen started out as a licensed stockbroker in August 1987, a couple of months prior to the historic stock market crash that took the Dow Jones Industrial Average down -22.6% in a single day. He has published daily fact-based fundamental and technical analysis on high-ranked stocks online for two decades. Through FACTBASEDINVESTING.COM, Kenneth provides educational articles, news, market commentary, and other information regarding proven investment systems that work in good times and bad.
Comments contained in the body of this report are technical opinions only and are not necessarily those of Gruneisen Growth Corp. The material herein has been obtained from sources believed to be reliable and accurate, however, its accuracy and completeness cannot be guaranteed. Our firm, employees, and customers may effect transactions, including transactions contrary to any recommendation herein, or have positions in the securities mentioned herein or options with respect thereto. Any recommendation contained in this report may not be suitable for all investors and it is not to be deemed an offer or solicitation on our part with respect to the purchase or sale of any securities. |
|
 |
Energy-Linked Indexes Were Standout Decliners Again
Kenneth J. Gruneisen - Passed the CAN SLIM® Master's Exam
The Bank Index ($BKX -1.47%) slumped as the Broker/Dealer Index ($XBD -0.15%) and the Retail Index ($RLX -0.21%) both edged lower. The Networking Index ($NWX -0.86%) lost ground and the Biotech Index ($BTK +0.01%) and Semiconductor Index ($SOX +0.22%) both eked out tiny gains. The Oil Services Index ($OSX -2.88%) and the Integrated Oil Index ($XOI -2.91%) both lost considerable ground again.
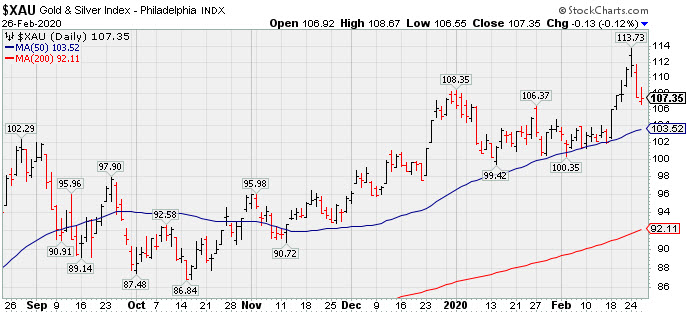
PICTURED: The Gold & Silver Index ($XAU -0.12%) finished flat, consolidating after a breakout to new highs.
| Oil Services |
$OSX |
53.68 |
-1.60 |
-2.89% |
-31.43% |
| Integrated Oil |
$XOI |
991.05 |
-29.70 |
-2.91% |
-22.00% |
| Semiconductor |
$SOX |
1,749.95 |
+3.84 |
+0.22% |
-5.39% |
| Networking |
$NWX |
509.76 |
-4.41 |
-0.86% |
-12.62% |
| Broker/Dealer |
$XBD |
279.77 |
-0.41 |
-0.15% |
-3.66% |
| Retail |
$RLX |
2,494.55 |
-5.16 |
-0.21% |
+1.85% |
| Gold & Silver |
$XAU |
107.35 |
-0.13 |
-0.12% |
+0.40% |
| Bank |
$BKX |
98.04 |
-1.46 |
-1.47% |
-13.51% |
| Biotech |
$BTK |
4,996.04 |
+0.50 |
+0.01% |
-1.41% |
|
|
|
 |
Volume Driven Losses Violated 50-Day Moving Average
Kenneth J. Gruneisen - Passed the CAN SLIM® Master's Exam
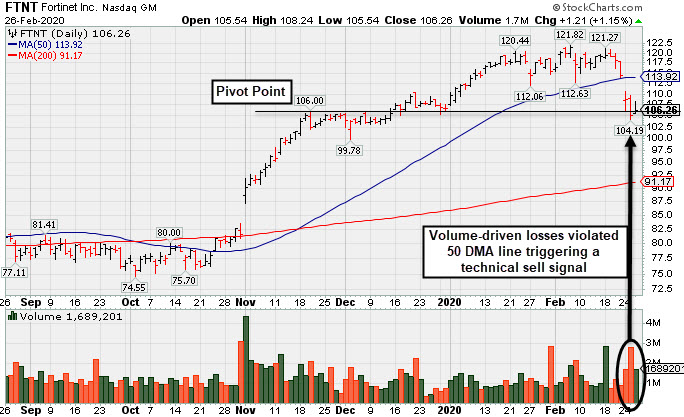
Fortinet Inc (FTNT +$1.21 or +1.15% to $106.26) halted its slide today after violating the 50-day moving average (DMA) line ($113.92) and prior low ($112.06) with big losses on higher volume triggering technical sell signals. It may find support near the prior pivot point, however, a rebound above the 50 DMA line is needed for its outlook to improve.
Fundamentals remain strong. It reported earnings +29% on +21% sales revenues for the Dec '19 quarter, its 8th consecutive quarterly comparison with earnings above the +25% minimum guideline (C criteria). Annual earnings (A criteria) have been improving since FY '14, also helping it match with the fact-based investment system's guidelines.
FTNT was highlighted in yellow with new pivot point cited based on its 4/16/19 high plus 10 cents in the 11/11/19 mid-day report (read here). It was last shown in this FSU section on 2/04/20 with an annotated graph under the headline, "Fortinet Posted Gain for Best-Ever Close".
The number of top-rated funds owning its shares rose from 960 in Jun '18 to 1,553 in Dec '19, a reassuring sign concerning the I criteria. Its current Up/Down Volume ratio of 1.2 is an unbiased indication its shares have been under accumulation over the past 50 days. It has a Timeliness rating of A and Sponsorship rating of B.
Charts courtesy of www.stockcharts.com
 |
|
|
Color Codes Explained :
Y - Better candidates highlighted by our
staff of experts.
G - Previously featured
in past reports as yellow but may no longer be buyable under the
guidelines.
***Last / Change / Volume data in this table is the closing quote data***
Symbol/Exchange
Company Name
Industry Group |
PRICE |
CHANGE
(%Change) |
Day High |
Volume
(% DAV)
(% 50 day avg vol) |
52 Wk Hi
% From Hi |
Featured
Date |
Price
Featured |
Pivot Featured |
|
Max Buy |
 FTNT
-
NASDAQ
FTNT
-
NASDAQ
Fortinet Inc
Computer Sftwr-Security
|
$106.26
|
+1.21
1.15% |
$108.24
|
1,729,966
150.17% of 50 DAV
50 DAV is 1,152,000
|
$121.82
-12.77%
|
12/9/2019
|
$103.85
|
PP = $106.10
|
|
MB = $111.41
|
 Most Recent Note - 2/26/2020 5:13:09 PM
G - Halted its slide today after violating the 50 DMA line ($113.92) and prior low ($112.06) with damaging losses on higher volume triggering technical sell signals. A rebound above the 50 DMA line is needed for its outlook to improve.Reported earnings +29% on +21% sales revenues for the Dec '19 quarter, continuing its strong earnings track record above the +25% minimum guideline (C criteria). See the latest FSU analysis for more details and a new annotated graph.
>>> FEATURED STOCK ARTICLE : Volume Driven Losses Violated 50-Day Moving Average - 2/26/2020 |
View all notes |
Set NEW NOTE alert |
Company Profile |
SEC
News |
Chart |
Request a new note
C
A
S
I |
SPSC
-
NASDAQ
S P S Commerce Inc
COMPUTER SOFTWARE and SERVICES - Application Software
|
$54.44
|
+0.07
0.13% |
$55.21
|
199,786
119.56% of 50 DAV
50 DAV is 167,100
|
$62.26
-12.56%
|
11/29/2019
|
$56.59
|
PP = $59.24
|
|
MB = $62.20
|
Most Recent Note - 2/24/2020 6:40:52 PM
G - Color code is changed to green after a 4th consecutive loss, and it violated its 50 DMA line ($57.34) while retreating abruptly from its all-time high. Fundamentals remain strong. Its current Relative Strength Rating of 54 is below the 80+ minimum guideline for buy candidates. See the latest FSU analysis for more details and a new annotated graph.
>>> FEATURED STOCK ARTICLE : 4 Damaging Losses Followed Recent Technical Breakout - 2/24/2020 |
View all notes |
Set NEW NOTE alert |
Company Profile |
SEC
News |
Chart |
Request a new note
C
A
S
I |
AUDC
-
NASDAQ
Audiocodes Ltd
ELECTRONICS - Scientific and Technical Instrum
|
$24.02
|
-0.21
-0.87% |
$24.74
|
312,924
87.41% of 50 DAV
50 DAV is 358,000
|
$28.73
-16.39%
|
9/13/2019
|
$19.68
|
PP = $19.84
|
|
MB = $20.83
|
Most Recent Note - 2/26/2020 5:06:17 PM
G - Met resistance at its 50 DMA line ($24.96) while trying to rebound from damaging losses Still faces resistance due to overhead supply up to the $28 level. Fundamentals remain strong after it reported earnings +30% on +15% sales revenues for the Dec '19 quarter.
>>> FEATURED STOCK ARTICLE : Rebounding After Damaging Losses Triggered Sell Signals - 2/14/2020 |
View all notes |
Set NEW NOTE alert |
Company Profile |
SEC
News |
Chart |
Request a new note
C
A
S
I |
CHDN
-
NASDAQ
Churchill Downs Inc
LEISURE - Gaming Activities
|
$145.44
|
-4.80
-3.19% |
$153.40
|
411,022
206.54% of 50 DAV
50 DAV is 199,000
|
$167.53
-13.19%
|
10/8/2019
|
$129.77
|
PP = $132.83
|
|
MB = $139.47
|
Most Recent Note - 2/25/2020 5:53:52 PM
G - Pulled back and finished -10.3% off its 52-week high. Its 50 DMA line ($144) defines near-term support. Due to report Dec '19 earnings news on 2/26/20. The Jun and Sep '19 quarterly earnings versus the year ago periods were both below the +25% minimum guideline (C criteria) and raised fundamental concerns.
>>> FEATURED STOCK ARTICLE : Perched at New Record High After Recent Gains on Average Volume - 2/7/2020 |
View all notes |
Set NEW NOTE alert |
Company Profile |
SEC
News |
Chart |
Request a new note
C
A
S
I |
LULU
-
NASDAQ
Lululemon Athletica
MANUFACTURING - Textile Manufacturing
|
$238.56
|
-0.25
-0.10% |
$244.13
|
1,218,359
67.88% of 50 DAV
50 DAV is 1,795,000
|
$266.20
-10.38%
|
9/6/2019
|
$201.25
|
PP = $194.35
|
|
MB = $204.07
|
Most Recent Note - 2/24/2020 6:33:36 PM
G - Finished near the session high today after a gap down tested its 50 DMA line ($239.97) and prior low ($231.84 on 1/27/20). Fundamentals remain strong. More damaging losses would raise concerns.
>>> FEATURED STOCK ARTICLE : Perched at Record High After 4th Consecutive Gain on Light Volume - 2/20/2020 |
View all notes |
Set NEW NOTE alert |
Company Profile |
SEC
News |
Chart |
Request a new note
C
A
S
I |
Symbol/Exchange
Company Name
Industry Group |
PRICE |
CHANGE
(%Change) |
Day High |
Volume
(% DAV)
(% 50 day avg vol) |
52 Wk Hi
% From Hi |
Featured
Date |
Price
Featured |
Pivot Featured |
|
Max Buy |
SPLK
-
NASDAQ
Splunk Inc
Computer Sftwr-Database
|
$156.51
|
+0.89
0.57% |
$161.32
|
1,558,314
102.39% of 50 DAV
50 DAV is 1,522,000
|
$176.31
-11.23%
|
11/25/2019
|
$147.79
|
PP = $142.16
|
|
MB = $149.27
|
Most Recent Note - 2/26/2020 5:10:47 PM
G - Pulled back from its all-time high and it is consolidating near its 50 DMA line ($157.69). Additional damaging losses would raise serious concerns and trigger a more worrisome technical sell signal.
>>> FEATURED STOCK ARTICLE : Perched at Record High After 7th Consecutive Gain - 2/19/2020 |
View all notes |
Set NEW NOTE alert |
Company Profile |
SEC
News |
Chart |
Request a new note
C
A
S
I |
PAYC
-
NYSE
Paycom Software Inc
COMPUTER SOFTWARE and SERVICES - Application Software
|
$291.92
|
+3.01
1.04% |
$300.52
|
664,583
72.32% of 50 DAV
50 DAV is 919,000
|
$342.00
-14.64%
|
11/20/2019
|
$252.97
|
PP = $259.81
|
|
MB = $272.80
|
Most Recent Note - 2/26/2020 5:08:48 PM
G - Halted its slide after undercutting the prior low and it is consolidating near its 50 DMA line ($292). Additional damaging losses would raise concerns and trigger a more worrisome technical sell signal. Fundamentals remain strong after it reported earnings +41% on +29% for the Dec '19 quarter.
>>> FEATURED STOCK ARTICLE : Pulled Back Near 50-Day Average Following Strong Earnings Report - 2/11/2020 |
View all notes |
Set NEW NOTE alert |
Company Profile |
SEC
News |
Chart |
Request a new note
C
A
S
I |
BLD
-
NYSE
Topbuild Corp
Bldg-Constr Prds/Misc
|
$108.70
|
-5.31
-4.66% |
$115.71
|
691,020
239.11% of 50 DAV
50 DAV is 289,000
|
$125.66
-13.50%
|
12/9/2019
|
$109.71
|
PP = $113.84
|
|
MB = $119.53
|
Most Recent Note - 2/26/2020 5:15:30 PM
G - Color code is changed to green after violating its 50 DMA line ($111) with today's additional damaging loss triggering a technical sell signal. Only a prompt rebound above the 50 DMA line would help its outlook improve.
>>> FEATURED STOCK ARTICLE : Volume Totals Cooling While Consolidating Near All-Time High - 2/6/2020 |
View all notes |
Set NEW NOTE alert |
Company Profile |
SEC
News |
Chart |
Request a new note
C
A
S
I |
TEAM
-
NASDAQ
Atlassian Corp Plc Cl A
Comp Sftwr-Spec Enterprs
|
$146.50
|
+2.02
1.40% |
$149.94
|
1,538,428
96.70% of 50 DAV
50 DAV is 1,591,000
|
$156.12
-6.16%
|
1/24/2020
|
$144.66
|
PP = $140.49
|
|
MB = $147.51
|
Most Recent Note - 2/24/2020 6:36:57 PM
Y - Color code is changed to yellow as it managed a "positive reversal" today after undercutting its "max buy" level amid widespread weakness. Fundamentals remain strong.
>>> FEATURED STOCK ARTICLE : Atlassian Has Been Hovering Near its All-Time High - 2/12/2020 |
View all notes |
Set NEW NOTE alert |
Company Profile |
SEC
News |
Chart |
Request a new note
C
A
S
I |
GLOB
-
NYSE
Globant SA
Computer-Tech Services
|
$114.02
|
-1.98
-1.71% |
$118.55
|
465,587
174.38% of 50 DAV
50 DAV is 267,000
|
$141.67
-19.52%
|
11/14/2019
|
$106.87
|
PP = $112.43
|
|
MB = $118.05
|
Most Recent Note - 2/25/2020 6:13:18 PM
G - Violated its 50 DMA line today, abruptly retreating from its all-time high. Reported earnings +28% on +32% sales revenues for the Dec '19 quarter, continuing its strong earnings track record. It is extended from any sound base. Its prior high ($112.33) defines important near-term support to watch.
>>> FEATURED STOCK ARTICLE : Encountering Distributional Pressure After Wedging to New Highs - 2/5/2020 |
View all notes |
Set NEW NOTE alert |
Company Profile |
SEC
News |
Chart |
Request a new note
C
A
S
I |
Symbol/Exchange
Company Name
Industry Group |
PRICE |
CHANGE
(%Change) |
Day High |
Volume
(% DAV)
(% 50 day avg vol) |
52 Wk Hi
% From Hi |
Featured
Date |
Price
Featured |
Pivot Featured |
|
Max Buy |
STNE
-
NASDAQ
Stoneco Ltd Cl A
Finance-CrdtCard/PmtPr
|
$41.57
|
+0.57
1.39% |
$42.19
|
2,704,059
156.94% of 50 DAV
50 DAV is 1,723,000
|
$45.72
-9.08%
|
1/22/2020
|
$43.94
|
PP = $45.72
|
|
MB = $48.01
|
Most Recent Note - 2/24/2020 6:42:09 PM
Y - Found impressive support near its 50 DMA line ($41). Subsequent gains above the pivot point backed by at least +40% above average volume are needed to trigger a technical buy signal.
>>> FEATURED STOCK ARTICLE : 50-Day Moving Average Line Violation Hurts Outlook - 2/10/2020 |
View all notes |
Set NEW NOTE alert |
Company Profile |
SEC
News |
Chart |
Request a new note
C
A
S
I |
DAVA
-
NYSE
Endava Plc Cl A Ads
Computer-Tech Services
|
$53.81
|
+3.74
7.47% |
$54.69
|
210,203
187.68% of 50 DAV
50 DAV is 112,000
|
$55.75
-3.48%
|
2/13/2020
|
$53.71
|
PP = $49.86
|
|
MB = $52.35
|
Most Recent Note - 2/25/2020 6:14:55 PM
Y - Retreating from its all-time high. Color code was changed to yellow after retreating below its "max buy" level. Prior highs in the $49 area define initial support to watch above its 50 DMA line ($47.98).
>>> FEATURED STOCK ARTICLE : Breakout Gain Backed By +462% Above Average Volme - 2/13/2020 |
View all notes |
Set NEW NOTE alert |
Company Profile |
SEC
News |
Chart |
Request a new note
C
A
S
I |
|
|
|
THESE ARE NOT BUY RECOMMENDATIONS!
Comments contained in the body of this report are technical
opinions only. The material herein has been obtained
from sources believed to be reliable and accurate, however,
its accuracy and completeness cannot be guaranteed.
This site is not an investment advisor, hence it does
not endorse or recommend any securities or other investments.
Any recommendation contained in this report may not
be suitable for all investors and it is not to be deemed
an offer or solicitation on our part with respect to
the purchase or sale of any securities. All trademarks,
service marks and trade names appearing in this report
are the property of their respective owners, and are
likewise used for identification purposes only.
This report is a service available
only to active Paid Premium Members.
You may opt-out of receiving report notifications
at any time. Questions or comments may be submitted
by writing to Premium Membership Services 665 S.E. 10 Street, Suite 201 Deerfield Beach, FL 33441-5634 or by calling 1-800-965-8307
or 954-785-1121.
|
|
|