***Last / Change / Volume data in this table is the closing quote data***
Symbol/Exchange
Company Name
Industry Group |
PRICE |
CHANGE
(%Change) |
Day High |
Volume
(% DAV)
(% 50 day avg vol) |
52 Wk Hi
% From Hi |
Featured
Date |
Price
Featured |
Pivot Featured |
|
Max Buy |
MLR
-
NYSE
Miller Industries Inc
AUTOMOTIVE - Auto Parts
|
$34.07
|
+0.52
1.55% |
$34.28
|
59,106
190.66% of 50 DAV
50 DAV is 31,000
|
$33.77
0.88%
|
11/30/2018
|
$28.35
|
PP = $29.50
|
|
MB = $30.98
|
 Most Recent Note - 2/25/2019 12:55:04 PM
G - Very extended from the prior base and hitting another new all-time high with today's 9th consecutive gain. Prior highs and its 50 DMA line ($28.99) define near-term support to watch on pullbacks.
>>> FEATURED STOCK ARTICLE : Traded Above Pivot Point Recently Without Great Volume - 1/29/2019 |
View all notes |
Set NEW NOTE alert |
Company Profile |
SEC
News |
Chart |
Request a new note
C
A
S
I |
NSP
-
NYSE
Insperity Inc
Comml Svcs-Outsourcing
|
$128.04
|
-2.36
-1.81% |
$130.91
|
429,448
118.96% of 50 DAV
50 DAV is 361,000
|
$132.50
-3.37%
|
2/11/2019
|
$127.91
|
PP = $121.25
|
|
MB = $127.31
|
Most Recent Note - 2/21/2019 5:59:44 PM
G - Stubbornly holding its ground above its "max buy" level. Prior highs in the $119-121 area define initial support to watch on pullbacks.
>>> FEATURED STOCK ARTICLE : Big Breakaway Gap Triggered Technical Buy Signal - 2/11/2019 |
View all notes |
Set NEW NOTE alert |
Company Profile |
SEC
News |
Chart |
Request a new note
C
A
S
I |
ZBRA
-
NASDAQ
Zebra Tech Corp Cl A
COMPUTER HARDWARE - Computer Peripherals
|
$204.64
|
-1.71
-0.83% |
$207.88
|
505,814
95.44% of 50 DAV
50 DAV is 530,000
|
$206.65
-0.97%
|
2/14/2019
|
$198.10
|
PP = $184.85
|
|
MB = $194.09
|
Most Recent Note - 2/22/2019 5:25:32 PM
G - Rallied further above its "max buy" level and finished near the session high with today's gain on higher (near average) volume. Prior highs in the $184 area define initial support to watch on pullbacks.
>>> FEATURED STOCK ARTICLE : Big Volume-Driven Gain for New High - 2/14/2019 |
View all notes |
Set NEW NOTE alert |
Company Profile |
SEC
News |
Chart |
Request a new note
C
A
S
I |
SPSC
-
NASDAQ
S P S Commerce Inc
COMPUTER SOFTWARE and SERVICES - Application Software
|
$109.73
|
-0.40
-0.36% |
$112.00
|
125,221
70.75% of 50 DAV
50 DAV is 177,000
|
$113.31
-3.16%
|
2/13/2019
|
$104.30
|
PP = $100.78
|
|
MB = $105.82
|
Most Recent Note - 2/20/2019 5:02:31 PM
G - Color code is changed to green after rallying above its "max buy" level, however, it reversed into the red today after early gains. Prior highs in the $100 area define initial support to watch.
>>> FEATURED STOCK ARTICLE : Gap Up and Big Volume Driven Gain for New High - 2/13/2019 |
View all notes |
Set NEW NOTE alert |
Company Profile |
SEC
News |
Chart |
Request a new note
C
A
S
I |
SSNC
-
NASDAQ
S S & C Technologies
COMPUTER SOFTWARE and SERVICES - Application Software
|
$61.37
|
+1.49
2.49% |
$62.43
|
3,941,024
203.99% of 50 DAV
50 DAV is 1,932,000
|
$60.97
0.66%
|
2/15/2019
|
$59.73
|
PP = $61.07
|
|
MB = $64.12
|
Most Recent Note - 2/25/2019 1:27:24 PM
Y - Hit a new high and rallied above the pivot point with above average volume behind today's gain. Stubbornly held its ground after highlighted in yellow in the 2/15/19 mid-day report.
>>> FEATURED STOCK ARTICLE : Volume-Driven Gain for New High Close - 2/19/2019 |
View all notes |
Set NEW NOTE alert |
Company Profile |
SEC
News |
Chart |
Request a new note
C
A
S
I |
Symbol/Exchange
Company Name
Industry Group |
PRICE |
CHANGE
(%Change) |
Day High |
Volume
(% DAV)
(% 50 day avg vol) |
52 Wk Hi
% From Hi |
Featured
Date |
Price
Featured |
Pivot Featured |
|
Max Buy |
IRBT
-
NASDAQ
Irobot Corp
CONSUMER DURABLES - Electronic Equipment
|
$121.69
|
+1.19
0.99% |
$123.26
|
1,391,994
173.35% of 50 DAV
50 DAV is 803,000
|
$122.89
-0.98%
|
2/8/2019
|
$104.92
|
PP = $103.63
|
|
MB = $108.81
|
Most Recent Note - 2/25/2019 12:44:24 PM
G - Remains perched at its all-time high today stubbornly holding its ground after an impressive streak of 10 consecutive gains. Recent gains have lacked great volume conviction. It is extended from the previously noted "double bottom" base. Prior high ($103) defines initial support to watch on pullbacks.
>>> FEATURED STOCK ARTICLE : Volume-Driven Gains Cleared Prior High After Double Bottom - 2/8/2019 |
View all notes |
Set NEW NOTE alert |
Company Profile |
SEC
News |
Chart |
Request a new note
C
A
S
I |
LHCG
-
NASDAQ
L H C Group Inc
HEALTH SERVICES - Home Health Care
|
$109.06
|
-1.94
-1.75% |
$113.03
|
214,292
82.42% of 50 DAV
50 DAV is 260,000
|
$114.22
-4.52%
|
1/23/2019
|
$107.29
|
PP = $107.61
|
|
MB = $112.99
|
Most Recent Note - 2/21/2019 6:02:24 PM
Y - Pulled back quietly today. Recently tallied 5 consecutive gains with below average volume. Subsequent gains above the pivot point backed by at least +40% above average volume may help clinch a convincing technical buy signal. See the latest FSU analysis for more details and a new annotated graph.
>>> FEATURED STOCK ARTICLE : Recent Gains for New Highs Lacked Great Volume Conviction - 2/21/2019 |
View all notes |
Set NEW NOTE alert |
Company Profile |
SEC
News |
Chart |
Request a new note
C
A
S
I |
ENSG
-
NASDAQ
Ensign Group Inc
HEALTH SERVICES - Long-Term Care Facilities
|
$51.13
|
-2.86
-5.30% |
$54.52
|
573,525
151.33% of 50 DAV
50 DAV is 379,000
|
$54.56
-6.29%
|
2/7/2019
|
$48.71
|
PP = $49.06
|
|
MB = $51.51
|
Most Recent Note - 2/25/2019 6:22:23 PM
Y - Color code is changed to yellow after today's slump below its "max buy" level. Prior highs in the $48 area define initial support to watch.
>>> FEATURED STOCK ARTICLE : Closed Near Pivot Point After Gap Up and Big Volume-Driven Gain - 2/7/2019 |
View all notes |
Set NEW NOTE alert |
Company Profile |
SEC
News |
Chart |
Request a new note
C
A
S
I |
BSTC
-
NASDAQ
Biospecifics Technologie
Medical-Biomed/Biotech
|
$69.31
|
-1.66
-2.34% |
$72.51
|
55,263
122.81% of 50 DAV
50 DAV is 45,000
|
$73.31
-5.46%
|
1/18/2019
|
$67.40
|
PP = $66.31
|
|
MB = $69.63
|
Most Recent Note - 2/25/2019 6:06:05 PM
Y - Color code is changed to yellow as this thinly-traded Biomed/Biotech firm is encountering mild distributional pressure while pulling back below its "max buy" level. Prior highs and its 50 DMA line define near-term support to watch on pullbacks.
>>> FEATURED STOCK ARTICLE : Reversed Into Red After Hitting a New High - 2/5/2019 |
View all notes |
Set NEW NOTE alert |
Company Profile |
SEC
News |
Chart |
Request a new note
C
A
S
I |
UBNT
-
NASDAQ
Ubiquiti Networks
TELECOMMUNICATIONS - Diversified Communication Serv
|
$145.24
|
+1.77
1.23% |
$146.00
|
362,454
91.76% of 50 DAV
50 DAV is 395,000
|
$143.62
1.13%
|
2/8/2019
|
$121.97
|
PP = $115.54
|
|
MB = $121.32
|
Most Recent Note - 2/20/2019 5:03:25 PM
G - Rallied further above its "max buy" level with today's 8th consecutive gain. Bullish action came after it reported earnings +75% on +23% sales revenues for the Dec '18 quarter. Prior high ($115) defines initial support to watch on pullbacks.
>>> FEATURED STOCK ARTICLE : Consolidating Above 50-Day Moving Average - 1/31/2019 |
View all notes |
Set NEW NOTE alert |
Company Profile |
SEC
News |
Chart |
Request a new note
C
A
S
I |
Symbol/Exchange
Company Name
Industry Group |
PRICE |
CHANGE
(%Change) |
Day High |
Volume
(% DAV)
(% 50 day avg vol) |
52 Wk Hi
% From Hi |
Featured
Date |
Price
Featured |
Pivot Featured |
|
Max Buy |
NOW
-
NYSE
Servicenow Inc
Computer Sftwr-Enterprse
|
$237.00
|
+2.00
0.85% |
$239.45
|
1,535,535
69.11% of 50 DAV
50 DAV is 2,222,000
|
$237.49
-0.21%
|
1/31/2019
|
$218.14
|
PP = $206.40
|
|
MB = $216.72
|
Most Recent Note - 2/22/2019 5:33:57 PM
G - Posted a solid gain with near average volume for a best-ever close. Stubbornly held its ground near its all-time high in recent weeks. Prior high ($206) defines initial support to watch on pullbacks.
>>> FEATURED STOCK ARTICLE : Breakaway Gap Followed Strong Earnings Report - 2/1/2019 |
View all notes |
Set NEW NOTE alert |
Company Profile |
SEC
News |
Chart |
Request a new note
C
A
S
I |
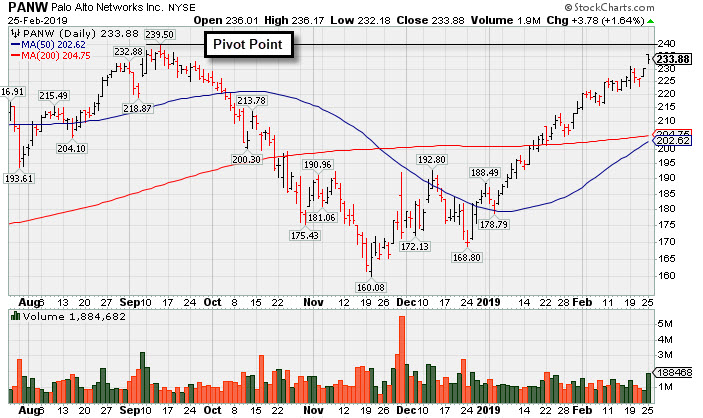
PANW
-
NYSE
Palo Alto Networks
Computer Sftwr-Security
|
$233.88
|
+3.78
1.64% |
$236.17
|
1,836,857
140.76% of 50 DAV
50 DAV is 1,305,000
|
$239.50
-2.35%
|
2/25/2019
|
$233.54
|
PP = $239.60
|
|
MB = $251.58
|
Most Recent Note - 2/25/2019 6:27:31 PM
Y - Returned to the Featured Stocks list highlighted in yellow with pivot point cited based on its 9/13/18 high plus 10 cents in the earlier mid-day report. Perched within striking distance of its all-time high after a 23-week cup shaped base. Due to report earnings news after the close on Tuesday, February 26, 2019. Volume and volatility often increase near earnings news. Fundamentals remained strong. See the latest FSU analysis for more details and a new annotated graph.
>>> FEATURED STOCK ARTICLE : Rebounded Near Prior High With Earnings News Due - 2/25/2019 |
View all notes |
Set NEW NOTE alert |
Company Profile |
SEC
News |
Chart |
Request a new note
C
A
S
I |
PAYC
-
NYSE
Paycom Software Inc
COMPUTER SOFTWARE and SERVICES - Application Software
|
$181.33
|
-2.95
-1.60% |
$186.00
|
562,417
84.96% of 50 DAV
50 DAV is 662,000
|
$184.28
-1.60%
|
2/6/2019
|
$171.66
|
PP = $164.18
|
|
MB = $172.39
|
Most Recent Note - 2/22/2019 5:35:36 PM
G - Posted a solid gain today with higher (near average) volume for a new all-time high, getting more extended from any sound base. Prior high ($164) defines initial support to watch above its 50 DMA line.
>>> FEATURED STOCK ARTICLE : Breakaway Gap Backed by Volume +388% Above Average - 2/6/2019 |
View all notes |
Set NEW NOTE alert |
Company Profile |
SEC
News |
Chart |
Request a new note
C
A
S
I |
PYPL
-
NASDAQ
Paypal Holdings Inc
Finance-CrdtCard/PmtPr
|
$96.70
|
+0.72
0.75% |
$97.30
|
7,224,161
81.32% of 50 DAV
50 DAV is 8,884,000
|
$96.04
0.69%
|
1/24/2019
|
$92.56
|
PP = $93.80
|
|
MB = $98.49
|
Most Recent Note - 2/22/2019 5:23:31 PM
Y - Finished near the session high with another gain today on lighter than average volume, wedging into new high territory. See the latest FSU analysis for more details and a new annotated graph.
>>> FEATURED STOCK ARTICLE : Wedging into New High Territory With Gains Lacking Volume - 2/22/2019 |
View all notes |
Set NEW NOTE alert |
Company Profile |
SEC
News |
Chart |
Request a new note
C
A
S
I |
ALRM
-
NASDAQ
Alarm.com Holdings Inc
Security/Sfty
|
$64.72
|
-0.37
-0.57% |
$65.63
|
324,635
63.16% of 50 DAV
50 DAV is 514,000
|
$65.65
-1.41%
|
1/22/2019
|
$60.52
|
PP = $60.30
|
|
MB = $63.32
|
Most Recent Note - 2/20/2019 5:55:00 PM
G - Volume totals have been cooling in recent weeks while still stubbornly holding its ground perched near its all-time high. Prior highs in the $60 area define initial support above its 50 DMA line. See the latest FSU analysis for more details and a new annotated graph.
>>> FEATURED STOCK ARTICLE : Volume Totals Cooling While Perched at All-Time High - 2/20/2019 |
View all notes |
Set NEW NOTE alert |
Company Profile |
SEC
News |
Chart |
Request a new note
C
A
S
I |
Symbol/Exchange
Company Name
Industry Group |
PRICE |
CHANGE
(%Change) |
Day High |
Volume
(% DAV)
(% 50 day avg vol) |
52 Wk Hi
% From Hi |
Featured
Date |
Price
Featured |
Pivot Featured |
|
Max Buy |
PLNT
-
NYSE
Planet Fitness Inc Cl A
Leisure-Services
|
$56.72
|
-1.28
-2.21% |
$58.25
|
2,359,128
188.28% of 50 DAV
50 DAV is 1,253,000
|
$61.51
-7.79%
|
11/7/2018
|
$57.10
|
PP = $55.45
|
|
MB = $58.22
|
Most Recent Note - 2/25/2019 1:10:26 PM
Y - Color code is changed to yellow after pulling back below its "max buy" level. There was a "negative reversal" on the prior session after hitting a new all-time high. Its 50 DMA line ($56.41) and recent lows define important near-term support to watch on pullbacks. Due to report earnings news after the market closes on Tuesday, February 26, 2019. Volume and volatility often increase near earnings news.
>>> FEATURED STOCK ARTICLE : Hovering in a Tight Range Near All-Time High - 1/25/2019 |
View all notes |
Set NEW NOTE alert |
Company Profile |
SEC
News |
Chart |
Request a new note
C
A
S
I |
TEAM
-
NASDAQ
Atlassian Corp Plc Cl A
Comp Sftwr-Spec Enterprs
|
$106.75
|
+1.50
1.43% |
$107.95
|
1,389,335
81.82% of 50 DAV
50 DAV is 1,698,000
|
$107.20
-0.42%
|
1/7/2019
|
$94.68
|
PP = $98.31
|
|
MB = $103.23
|
Most Recent Note - 2/25/2019 6:18:26 PM
G - Gapped up and posted a small gain with below average volume for a new all-time high. Recent gains lacked great volume conviction. Its prior high ($98.21) and 50 DMA line ($94.07) define near-term support to watch on pullbacks. Fundamentals remain strong.
>>> FEATURED STOCK ARTICLE : Volume Light While Hovering Near High - 1/28/2019 |
View all notes |
Set NEW NOTE alert |
Company Profile |
SEC
News |
Chart |
Request a new note
C
A
S
I |
GLOB
-
NYSE
Globant SA
Computer-Tech Services
|
$71.87
|
-0.12
-0.17% |
$74.00
|
202,080
84.55% of 50 DAV
50 DAV is 239,000
|
$73.00
-1.55%
|
2/15/2019
|
$69.35
|
PP = $70.00
|
|
MB = $73.50
|
Most Recent Note - 2/22/2019 5:32:10 PM
Y - Posted a gain today with light volume for a best-ever close. Volume totals have been cooling since 2/15/19 when noted as it rallied from an advanced "3-weeks tight" base.
>>> FEATURED STOCK ARTICLE : Volume-Driven Gain From Advanced "3-Weeks Tight" Base - 2/15/2019 |
View all notes |
Set NEW NOTE alert |
Company Profile |
SEC
News |
Chart |
Request a new note
C
A
S
I |
TTD
-
NASDAQ
The Trade Desk Inc Cl A
Comml Svcs-Advertising
|
$197.62
|
-0.11
-0.06% |
$202.30
|
3,183,338
249.28% of 50 DAV
50 DAV is 1,277,000
|
$200.15
-1.26%
|
2/6/2019
|
$148.65
|
PP = $149.00
|
|
MB = $156.45
|
Most Recent Note - 2/25/2019 1:28:30 PM
G - Holding its ground today. Color code was changed to green after a gap up and considerable gain above its "max buy" level backed by heavy volume. Bullish action on the prior session came after it reported earnings +102% on +56% sales revenues for the Dec '18 quarter.
>>> FEATURED STOCK ARTICLE : Near High After Third Consecutive Gain with Light Volume - 2/12/2019 |
View all notes |
Set NEW NOTE alert |
Company Profile |
SEC
News |
Chart |
Request a new note
C
A
S
I |
MEDP
-
NASDAQ
Medpace Holdings Inc
Medical-Research Eqp/Svc
|
$70.58
|
+0.60
0.86% |
$71.66
|
629,132
83.11% of 50 DAV
50 DAV is 757,000
|
$70.78
-0.28%
|
1/30/2019
|
$64.10
|
PP = $65.19
|
|
MB = $68.45
|
Most Recent Note - 2/25/2019 6:09:01 PM
G - Posted another small gain today with below average volume for a new all-time high. Held its ground stubbornly after wedging higher with gains lacking great volume conviction. Fundamentals remain strong.
>>> FEATURED STOCK ARTICLE : Rallied Near 52-Week High With a Volume-Driven Gain - 1/30/2019 |
View all notes |
Set NEW NOTE alert |
Company Profile |
SEC
News |
Chart |
Request a new note
C
A
S
I |
Symbol/Exchange
Company Name
Industry Group |
PRICE |
CHANGE
(%Change) |
Day High |
Volume
(% DAV)
(% 50 day avg vol) |
52 Wk Hi
% From Hi |
Featured
Date |
Price
Featured |
Pivot Featured |
|
Max Buy |