You are not logged in.
This means you
CAN ONLY VIEW reports that were published prior to Monday, February 19, 2024.
You
MUST UPGRADE YOUR MEMBERSHIP if you want to see any current reports.
AFTER MARKET UPDATE - THURSDAY, FEBRUARY 21ST, 2019
Previous After Market Report Next After Market Report >>>
|
|
|
|
DOW |
-103.81 |
25,850.63 |
-0.40% |
|
Volume |
854,564,600 |
-8% |
|
Volume |
2,103,340,907 |
-3% |
|
NASDAQ |
-29.36 |
7,459.71 |
-0.39% |
|
Advancers |
1,136 |
39% |
|
Advancers |
1,283 |
42% |
|
S&P 500 |
-9.82 |
2,774.88 |
-0.35% |
|
Decliners |
1,785 |
61% |
|
Decliners |
1,780 |
58% |
|
Russell 2000 |
-6.11 |
1,575.55 |
-0.39% |
|
52 Wk Highs |
91 |
|
|
52 Wk Highs |
75 |
|
|
S&P 600 |
-4.92 |
982.95 |
-0.50% |
|
52 Wk Lows |
8 |
|
|
52 Wk Lows |
17 |
|
|
 |
Major Indices Fell With Lighter Volume Totals
Kenneth J. Gruneisen - Passed the CAN SLIM® Master's Exam
Stocks declined Thursday. The Dow fell 103 points to 25,850 while the S&P 500 was off 9 points to 2,774. The Nasdaq Composite lost 29 points to 7,459. The volume totals reported were lighter than the prior session totals on the NYSE and the Nasdaq exchange. Breadth was negative as decliners led advancers by about a 3-2 margin on the NYSE and on the Nasdaq exchange. There were 37 high-ranked companies from the Leaders List that made a new 52-week high and were listed on the BreakOuts Page, versus the total of 45 on the prior session. New 52-week highs totals solidly outnumbered new 52-week lows totals on the NYSE and on the Nasdaq exchange. The major indices are in a confirmed uptrend (M criteria) while healthy leadership has underpinned the market. The Featured Stocks Page provides the most timely analysis on high-ranked leaders. Charts used courtesy of www.stockcharts.com
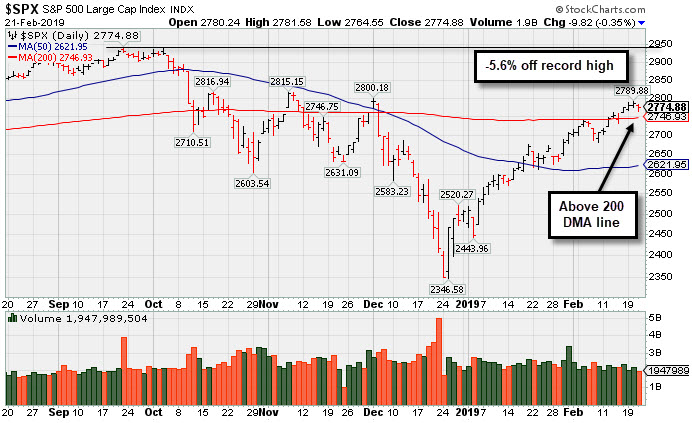
PICTURED: The S&P 500 Index is -5.6% below its record high. It made progress above its 200-day moving average (DMA) line with its recent gains, showing more signs of technical improvement.
The major averages finished lower as investors assessed a mixed bag of economic data. A flash reading of U.S. PMI showed manufacturing activity expanded at the slowest rate in seventeen months in February while service sector activity increased to an eight month high in the same period. A separate report revealed durable goods orders increased 1.2% in December, while the Philadelphia business index fell to the lowest point since May 2016. The January leading index ticked down 0.1%, matching the 0.1% decline in December. Another update showed existing home sales slipped to a three-year low in January. Trade negotiations also garnered an outsized focus today as delegates from the U.S. and China began writing a memorandum of understanding for a new pact.
Seven of 11 S&P 500 sectors finished in negative territory with the Energy and Healthcare groups as loss leaders. Consumer Staples outperformed as Coca-Cola (KO +1.69%) rose after the company increased its dividend and authorized an additional share buyback plan.
Treasuries were weaker with the yield on the 10-year note up four basis points to 2.68%. In commodities, WTI crude fell 0.5% to $56.87/barrel. COMEX gold was down 1.6% to $1322.00/ounce amid a stronger dollar. |
 Kenneth J. Gruneisen started out as a licensed stockbroker in August 1987, a couple of months prior to the historic stock market crash that took the Dow Jones Industrial Average down -22.6% in a single day. He has published daily fact-based fundamental and technical analysis on high-ranked stocks online for two decades. Through FACTBASEDINVESTING.COM, Kenneth provides educational articles, news, market commentary, and other information regarding proven investment systems that work in good times and bad.
Comments contained in the body of this report are technical opinions only and are not necessarily those of Gruneisen Growth Corp. The material herein has been obtained from sources believed to be reliable and accurate, however, its accuracy and completeness cannot be guaranteed. Our firm, employees, and customers may effect transactions, including transactions contrary to any recommendation herein, or have positions in the securities mentioned herein or options with respect thereto. Any recommendation contained in this report may not be suitable for all investors and it is not to be deemed an offer or solicitation on our part with respect to the purchase or sale of any securities. |
|
 |
Financial, Retail, Tech, and Commodity-Linked Groups Fell
Kenneth J. Gruneisen - Passed the CAN SLIM® Master's Exam
The Bank Index ($BKX -0.64%), Broker/Dealer Index ($XBD -0.78%) and the Retail Index ($RLX -0.33%) ended the session lower. The tech sector had a negative bias as the Biotech Index ($BTK -1.99%) outpaced the Semiconductor Index ($SOX -0.74%) to the downside while the Networking Index ($NWX -0.12%) inched lower. Commodity-linked groups had a negative bias as the Oil Services Index ($OSX -2.96%), Integrated Oil Index ($XOI -1.35%), and the Gold & Silver Index ($XAU -1.41%) each fell.
Charts courtesy of www.stockcharts.com
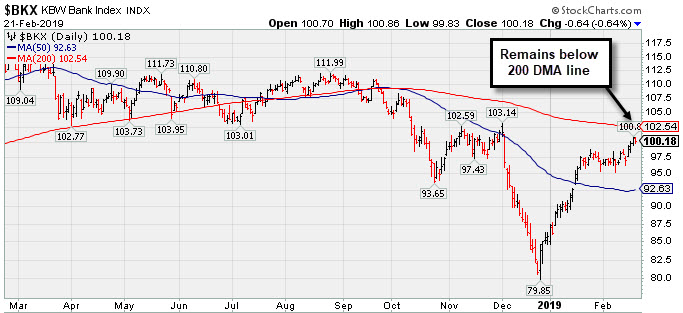 PICTURED: The Bank Index ($BKX -0.64%) remains below its 200-day moving average (DMA) line.
| Oil Services |
$OSX |
95.97 |
-2.92 |
-2.95% |
+19.07% |
| Integrated Oil |
$XOI |
1,300.76 |
-17.81 |
-1.35% |
+12.22% |
| Semiconductor |
$SOX |
1,350.25 |
-10.03 |
-0.74% |
+16.89% |
| Networking |
$NWX |
579.12 |
-0.72 |
-0.12% |
+18.51% |
| Broker/Dealer |
$XBD |
267.62 |
-2.10 |
-0.78% |
+12.76% |
| Retail |
$RLX |
2,142.41 |
-7.05 |
-0.33% |
+9.79% |
| Gold & Silver |
$XAU |
78.30 |
-1.12 |
-1.41% |
+10.81% |
| Bank |
$BKX |
100.18 |
-0.64 |
-0.63% |
+16.77% |
| Biotech |
$BTK |
4,847.03 |
-98.37 |
-1.99% |
+14.84% |
|
|
|
 |
Recent Gains for New Highs Lacked Great Volume Conviction
Kenneth J. Gruneisen - Passed the CAN SLIM® Master's Exam
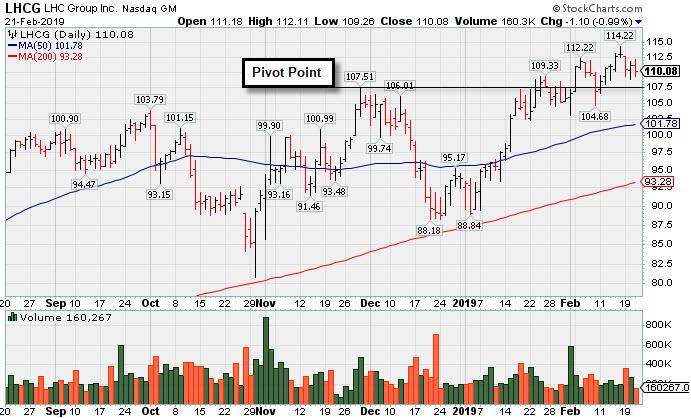
L H C Group Inc (LHCG -$1.10 or -0.99% to $110.08) pulled back with light volume today. A recent streak of 5 consecutive gains was marked by below average volume. Confirming volume-driven gains would be a reassuring sign, since the recent gains above the pivot point were not backed by the at least +40% above average volume necessary to trigger a proper technical buy signal. Keep in mind that its next earnings release is due after the market closes on Wednesday, February 27, 2019. Volume and volatility often increase near earnings news.
LHCG was highlighted in yellow with pivot point cited based on its 11/29/18 high plus 10 cents in the mid-day report (read here). It was last shown in this FSU section on 1/23/19 with an annotated graph under the headline, "Healthcare Services Firm Reached a New High". It found support above its 200 DMA line since noted in the 12/17/18 mid-day report - "The Sep '18 report marked its 3rd strong quarterly earnings increase above the +25% minimum guideline (C criteria), helping it better match with the fact-based investment system's fundamental guidelines."
Its annual earnings growth (A criteria) has been strong, and it has a current Earnings Per Share Rating of 94. The number of top-rated funds owning its shares rose from 350 in Mar '18 to 487 in Dec '18, a reassuring sign concerning the I criteria. It has earned an A Timeliness Rating and a B Sponsorship Rating. It has a small supply of only 31.4 million shares (S criteria) outstanding, which can contribute to greater volatility i the event of institutional buying or selling.
Charts courtesy of www.stockcharts.com
 |
|
|
Color Codes Explained :
Y - Better candidates highlighted by our
staff of experts.
G - Previously featured
in past reports as yellow but may no longer be buyable under the
guidelines.
***Last / Change / Volume data in this table is the closing quote data***
Symbol/Exchange
Company Name
Industry Group |
PRICE |
CHANGE
(%Change) |
Day High |
Volume
(% DAV)
(% 50 day avg vol) |
52 Wk Hi
% From Hi |
Featured
Date |
Price
Featured |
Pivot Featured |
|
Max Buy |
MLR
-
NYSE
Miller Industries Inc
AUTOMOTIVE - Auto Parts
|
$33.52
|
+0.83
2.54% |
$33.65
|
37,388
116.84% of 50 DAV
50 DAV is 32,000
|
$32.94
1.78%
|
11/30/2018
|
$28.35
|
PP = $29.50
|
|
MB = $30.98
|
Most Recent Note - 2/19/2019 12:26:24 PM
G - Prior highs and its 50 DMA line ($28.50) define near-term support to watch on pullbacks. Hitting another new all-time high and rising further above its "max buy" level with today's 5th consecutive gain. Gain on 2/15/19 was backed by +75% above average volume and clinched a technical buy signal.
>>> FEATURED STOCK ARTICLE : Traded Above Pivot Point Recently Without Great Volume - 1/29/2019 |
View all notes |
Set NEW NOTE alert |
Company Profile |
SEC
News |
Chart |
Request a new note
C
A
S
I |
NSP
-
NYSE
Insperity Inc
Comml Svcs-Outsourcing
|
$129.17
|
+1.14
0.89% |
$129.64
|
298,151
82.82% of 50 DAV
50 DAV is 360,000
|
$132.50
-2.51%
|
2/11/2019
|
$127.91
|
PP = $121.25
|
|
MB = $127.31
|
 Most Recent Note - 2/21/2019 5:59:44 PM
G - Stubbornly holding its ground above its "max buy" level. Prior highs in the $119-121 area define initial support to watch on pullbacks.
>>> FEATURED STOCK ARTICLE : Big Breakaway Gap Triggered Technical Buy Signal - 2/11/2019 |
View all notes |
Set NEW NOTE alert |
Company Profile |
SEC
News |
Chart |
Request a new note
C
A
S
I |
ZBRA
-
NASDAQ
Zebra Tech Corp Cl A
COMPUTER HARDWARE - Computer Peripherals
|
$199.82
|
-0.03
-0.02% |
$200.37
|
332,247
63.04% of 50 DAV
50 DAV is 527,000
|
$203.95
-2.03%
|
2/14/2019
|
$198.10
|
PP = $184.85
|
|
MB = $194.09
|
Most Recent Note - 2/20/2019 5:05:01 PM
G - Color code is changed to green after recent gains above its "max buy" level. Prior highs in the $184 area define initial support to watch on pullbacks.
>>> FEATURED STOCK ARTICLE : Big Volume-Driven Gain for New High - 2/14/2019 |
View all notes |
Set NEW NOTE alert |
Company Profile |
SEC
News |
Chart |
Request a new note
C
A
S
I |
SPSC
-
NASDAQ
S P S Commerce Inc
COMPUTER SOFTWARE and SERVICES - Application Software
|
$108.76
|
+1.73
1.62% |
$109.16
|
152,287
85.08% of 50 DAV
50 DAV is 179,000
|
$113.31
-4.02%
|
2/13/2019
|
$104.30
|
PP = $100.78
|
|
MB = $105.82
|
Most Recent Note - 2/20/2019 5:02:31 PM
G - Color code is changed to green after rallying above its "max buy" level, however, it reversed into the red today after early gains. Prior highs in the $100 area define initial support to watch.
>>> FEATURED STOCK ARTICLE : Gap Up and Big Volume Driven Gain for New High - 2/13/2019 |
View all notes |
Set NEW NOTE alert |
Company Profile |
SEC
News |
Chart |
Request a new note
C
A
S
I |
SSNC
-
NASDAQ
S S & C Technologies
COMPUTER SOFTWARE and SERVICES - Application Software
|
$59.17
|
-0.09
-0.15% |
$59.19
|
2,043,239
105.43% of 50 DAV
50 DAV is 1,938,000
|
$60.97
-2.95%
|
2/15/2019
|
$59.73
|
PP = $61.07
|
|
MB = $64.12
|
Most Recent Note - 2/19/2019 5:42:04 PM
Y - Finished at a new high close with +40% above average volume behind today's 7th consecutive gain. Highlighted in yellow with pivot point cited based on its 8/03/19 high plus 10 cents in the 2/15/19 mid-day report when noted - "Subsequent volume-driven gains above the pivot point may trigger a new technical buy signal. Reported earnings +76% on +153% sales revenues for the Dec '18 quarter marking its 3rd consecutive quarterly comparison above the +25% minimum earnings guideline (C criteria), helping it better match the fact-based investment system's fundamental guidelines. Went through a deep consolidation below its 200 DMA line and rebounded since noted with caution in the 9/07/18 mid-day report. Completed new Public Offerings on 4/03/18 and on 6/19/15."
>>> FEATURED STOCK ARTICLE : Volume-Driven Gain for New High Close - 2/19/2019 |
View all notes |
Set NEW NOTE alert |
Company Profile |
SEC
News |
Chart |
Request a new note
C
A
S
I |
Symbol/Exchange
Company Name
Industry Group |
PRICE |
CHANGE
(%Change) |
Day High |
Volume
(% DAV)
(% 50 day avg vol) |
52 Wk Hi
% From Hi |
Featured
Date |
Price
Featured |
Pivot Featured |
|
Max Buy |
IRBT
-
NASDAQ
Irobot Corp
CONSUMER DURABLES - Electronic Equipment
|
$119.47
|
-3.06
-2.50% |
$122.85
|
974,032
122.37% of 50 DAV
50 DAV is 796,000
|
$122.89
-2.78%
|
2/8/2019
|
$104.92
|
PP = $103.63
|
|
MB = $108.81
|
Most Recent Note - 2/19/2019 12:16:06 PM
G - Perched at its all-time high today after 8 consecutive gains. Color code was changed to green after rallying above its "max buy" level. Prior high ($103) defines initial support to watch on pullbacks.
>>> FEATURED STOCK ARTICLE : Volume-Driven Gains Cleared Prior High After Double Bottom - 2/8/2019 |
View all notes |
Set NEW NOTE alert |
Company Profile |
SEC
News |
Chart |
Request a new note
C
A
S
I |
LHCG
-
NASDAQ
L H C Group Inc
HEALTH SERVICES - Home Health Care
|
$110.08
|
-1.10
-0.99% |
$112.11
|
160,130
61.12% of 50 DAV
50 DAV is 262,000
|
$114.22
-3.62%
|
1/23/2019
|
$107.29
|
PP = $107.61
|
|
MB = $112.99
|
Most Recent Note - 2/21/2019 6:02:24 PM
Y - Pulled back quietly today. Recently tallied 5 consecutive gains with below average volume. Subsequent gains above the pivot point backed by at least +40% above average volume may help clinch a convincing technical buy signal. See the latest FSU analysis for more details and a new annotated graph.
>>> FEATURED STOCK ARTICLE : Recent Gains for New Highs Lacked Great Volume Conviction - 2/21/2019 |
View all notes |
Set NEW NOTE alert |
Company Profile |
SEC
News |
Chart |
Request a new note
C
A
S
I |
ENSG
-
NASDAQ
Ensign Group Inc
HEALTH SERVICES - Long-Term Care Facilities
|
$53.56
|
+0.02
0.04% |
$53.92
|
366,343
96.66% of 50 DAV
50 DAV is 379,000
|
$53.77
-0.39%
|
2/7/2019
|
$48.71
|
PP = $49.06
|
|
MB = $51.51
|
Most Recent Note - 2/20/2019 5:08:58 PM
G - Posted a 4th consecutive gain today and hit another new 52-week high with +64% above average volume. Color code was changed to green after getting extended from the previously noted base.
>>> FEATURED STOCK ARTICLE : Closed Near Pivot Point After Gap Up and Big Volume-Driven Gain - 2/7/2019 |
View all notes |
Set NEW NOTE alert |
Company Profile |
SEC
News |
Chart |
Request a new note
C
A
S
I |
BSTC
-
NASDAQ
Biospecifics Technologie
Medical-Biomed/Biotech
|
$69.70
|
-0.40
-0.57% |
$71.44
|
48,034
109.17% of 50 DAV
50 DAV is 44,000
|
$73.31
-4.92%
|
1/18/2019
|
$67.40
|
PP = $66.31
|
|
MB = $69.63
|
Most Recent Note - 2/19/2019 12:05:05 PM
G - Perched at its 52-week high after gains backed by above average volume. Thinly-traded Biomed/Biotech firm held its ground after a gain above its pivot point on 2/04/19 backed by +148% above average volume triggered a technical buy signal.
>>> FEATURED STOCK ARTICLE : Reversed Into Red After Hitting a New High - 2/5/2019 |
View all notes |
Set NEW NOTE alert |
Company Profile |
SEC
News |
Chart |
Request a new note
C
A
S
I |
UBNT
-
NASDAQ
Ubiquiti Networks
TELECOMMUNICATIONS - Diversified Communication Serv
|
$142.45
|
+1.80
1.28% |
$142.89
|
385,096
98.24% of 50 DAV
50 DAV is 392,000
|
$140.93
1.08%
|
2/8/2019
|
$121.97
|
PP = $115.54
|
|
MB = $121.32
|
Most Recent Note - 2/20/2019 5:03:25 PM
G - Rallied further above its "max buy" level with today's 8th consecutive gain. Bullish action came after it reported earnings +75% on +23% sales revenues for the Dec '18 quarter. Prior high ($115) defines initial support to watch on pullbacks.
>>> FEATURED STOCK ARTICLE : Consolidating Above 50-Day Moving Average - 1/31/2019 |
View all notes |
Set NEW NOTE alert |
Company Profile |
SEC
News |
Chart |
Request a new note
C
A
S
I |
Symbol/Exchange
Company Name
Industry Group |
PRICE |
CHANGE
(%Change) |
Day High |
Volume
(% DAV)
(% 50 day avg vol) |
52 Wk Hi
% From Hi |
Featured
Date |
Price
Featured |
Pivot Featured |
|
Max Buy |
NOW
-
NYSE
Servicenow Inc
Computer Sftwr-Enterprse
|
$230.01
|
+0.51
0.22% |
$231.24
|
1,303,866
58.68% of 50 DAV
50 DAV is 2,222,000
|
$237.49
-3.15%
|
1/31/2019
|
$218.14
|
PP = $206.40
|
|
MB = $216.72
|
Most Recent Note - 2/19/2019 12:59:49 PM
G - Stubbornly holding its ground near its all-time high with volume totals cooling. Prior high ($206) defines initial support to watch on pullbacks.
>>> FEATURED STOCK ARTICLE : Breakaway Gap Followed Strong Earnings Report - 2/1/2019 |
View all notes |
Set NEW NOTE alert |
Company Profile |
SEC
News |
Chart |
Request a new note
C
A
S
I |
PAYC
-
NYSE
Paycom Software Inc
COMPUTER SOFTWARE and SERVICES - Application Software
|
$178.93
|
+1.89
1.07% |
$180.88
|
480,159
72.20% of 50 DAV
50 DAV is 665,000
|
$182.55
-1.98%
|
2/6/2019
|
$171.66
|
PP = $164.18
|
|
MB = $172.39
|
Most Recent Note - 2/19/2019 5:43:44 PM
G - Pulled back today with lighter (near average) volume Prior high ($164) defines initial support to watch above its 50 DMA line.
>>> FEATURED STOCK ARTICLE : Breakaway Gap Backed by Volume +388% Above Average - 2/6/2019 |
View all notes |
Set NEW NOTE alert |
Company Profile |
SEC
News |
Chart |
Request a new note
C
A
S
I |
PYPL
-
NASDAQ
Paypal Holdings Inc
Finance-CrdtCard/PmtPr
|
$94.96
|
+0.23
0.24% |
$95.51
|
5,844,193
64.83% of 50 DAV
50 DAV is 9,014,000
|
$96.04
-1.12%
|
1/24/2019
|
$92.56
|
PP = $93.80
|
|
MB = $98.49
|
Most Recent Note - 2/19/2019 12:50:21 PM
Y - Posting a 3rd consecutive small gain today on light volume, quietly wedging into new high territory. Reported +25% earnings on +13% sales revenues for the Dec '18 quarter. Disciplined investors note that the recent gains above the pivot point lacked the +40% above average volume needed to trigger a proper technical buy signal.
>>> FEATURED STOCK ARTICLE : Perched Within Striking Distance of High Ahead of Earnings News - 1/24/2019 |
View all notes |
Set NEW NOTE alert |
Company Profile |
SEC
News |
Chart |
Request a new note
C
A
S
I |
ALRM
-
NASDAQ
Alarm.com Holdings Inc
Security/Sfty
|
$64.24
|
-0.46
-0.71% |
$64.83
|
253,486
48.75% of 50 DAV
50 DAV is 520,000
|
$65.58
-2.04%
|
1/22/2019
|
$60.52
|
PP = $60.30
|
|
MB = $63.32
|
Most Recent Note - 2/20/2019 5:55:00 PM
G - Volume totals have been cooling in recent weeks while still stubbornly holding its ground perched near its all-time high. Prior highs in the $60 area define initial support above its 50 DMA line. See the latest FSU analysis for more details and a new annotated graph.
>>> FEATURED STOCK ARTICLE : Volume Totals Cooling While Perched at All-Time High - 2/20/2019 |
View all notes |
Set NEW NOTE alert |
Company Profile |
SEC
News |
Chart |
Request a new note
C
A
S
I |
PLNT
-
NYSE
Planet Fitness Inc Cl A
Leisure-Services
|
$58.25
|
-0.23
-0.39% |
$58.73
|
618,231
49.90% of 50 DAV
50 DAV is 1,239,000
|
$59.91
-2.77%
|
11/7/2018
|
$57.10
|
PP = $55.45
|
|
MB = $58.22
|
Most Recent Note - 2/19/2019 12:48:48 PM
G - Color code is changed to green while quietly trading above its "max buy" level. Its 50 DMA line ($56.12) and recent lows define important near-term support to watch on pullbacks.
>>> FEATURED STOCK ARTICLE : Hovering in a Tight Range Near All-Time High - 1/25/2019 |
View all notes |
Set NEW NOTE alert |
Company Profile |
SEC
News |
Chart |
Request a new note
C
A
S
I |
Symbol/Exchange
Company Name
Industry Group |
PRICE |
CHANGE
(%Change) |
Day High |
Volume
(% DAV)
(% 50 day avg vol) |
52 Wk Hi
% From Hi |
Featured
Date |
Price
Featured |
Pivot Featured |
|
Max Buy |
TEAM
-
NASDAQ
Atlassian Corp Plc Cl A
Comp Sftwr-Spec Enterprs
|
$103.04
|
-1.08
-1.04% |
$103.88
|
949,331
55.23% of 50 DAV
50 DAV is 1,719,000
|
$107.20
-3.88%
|
1/7/2019
|
$94.68
|
PP = $98.31
|
|
MB = $103.23
|
Most Recent Note - 2/19/2019 12:53:12 PM
G - Volume totals have been cooling while stubbornly holding its ground at its all-time high. Recent gains lacked great volume conviction. Its prior high ($98.21) and 50 DMA line ($92.32) define near-term support to watch on pullbacks. Fundamentals remain strong.
>>> FEATURED STOCK ARTICLE : Volume Light While Hovering Near High - 1/28/2019 |
View all notes |
Set NEW NOTE alert |
Company Profile |
SEC
News |
Chart |
Request a new note
C
A
S
I |
GLOB
-
NYSE
Globant SA
Computer-Tech Services
|
$69.75
|
+0.33
0.48% |
$70.31
|
149,262
62.72% of 50 DAV
50 DAV is 238,000
|
$73.00
-4.45%
|
2/15/2019
|
$69.35
|
PP = $70.00
|
|
MB = $73.50
|
Most Recent Note - 2/20/2019 5:07:22 PM
Y - Pulled back today with lighter volume following 2 consecutive volume-driven gains for new highs. Color code was changed to yellow with pivot point cited based on its 1/30/19 high plus 10 cents while it rallied from an advanced "3-weeks tight" base.
>>> FEATURED STOCK ARTICLE : Volume-Driven Gain From Advanced "3-Weeks Tight" Base - 2/15/2019 |
View all notes |
Set NEW NOTE alert |
Company Profile |
SEC
News |
Chart |
Request a new note
C
A
S
I |
TTD
-
NASDAQ
The Trade Desk Inc Cl A
Comml Svcs-Advertising
|
$150.49
|
+0.40
0.27% |
$153.20
|
1,697,180
151.13% of 50 DAV
50 DAV is 1,123,000
|
$165.70
-9.18%
|
2/6/2019
|
$148.65
|
PP = $149.00
|
|
MB = $156.45
|
Most Recent Note - 2/20/2019 12:51:07 PM
Y - Color code is changed to yellow while pulling back today with heavier volume, undercutting the previously cited pivot point after rallying from a "double bottom" base. Due to release financial results for the fourth quarter and fiscal year 2018 ended December 31, 2018 after market close on Thursday, February 21, 2019. Volume and volatility often increase near earnings news.
>>> FEATURED STOCK ARTICLE : Near High After Third Consecutive Gain with Light Volume - 2/12/2019 |
View all notes |
Set NEW NOTE alert |
Company Profile |
SEC
News |
Chart |
Request a new note
C
A
S
I |
MEDP
-
NASDAQ
Medpace Holdings Inc
Medical-Research Eqp/Svc
|
$69.17
|
-1.05
-1.50% |
$70.23
|
349,287
45.72% of 50 DAV
50 DAV is 764,000
|
$70.78
-2.27%
|
1/30/2019
|
$64.10
|
PP = $65.19
|
|
MB = $68.45
|
Most Recent Note - 2/19/2019 5:47:47 PM
G - Perched near its all-time high, quietly holding its ground after wedging higher last week with gains lacking great volume conviction, and its color code is changed to green. Fundamentals remain strong.
>>> FEATURED STOCK ARTICLE : Rallied Near 52-Week High With a Volume-Driven Gain - 1/30/2019 |
View all notes |
Set NEW NOTE alert |
Company Profile |
SEC
News |
Chart |
Request a new note
C
A
S
I |
|
|
|
THESE ARE NOT BUY RECOMMENDATIONS!
Comments contained in the body of this report are technical
opinions only. The material herein has been obtained
from sources believed to be reliable and accurate, however,
its accuracy and completeness cannot be guaranteed.
This site is not an investment advisor, hence it does
not endorse or recommend any securities or other investments.
Any recommendation contained in this report may not
be suitable for all investors and it is not to be deemed
an offer or solicitation on our part with respect to
the purchase or sale of any securities. All trademarks,
service marks and trade names appearing in this report
are the property of their respective owners, and are
likewise used for identification purposes only.
This report is a service available
only to active Paid Premium Members.
You may opt-out of receiving report notifications
at any time. Questions or comments may be submitted
by writing to Premium Membership Services 665 S.E. 10 Street, Suite 201 Deerfield Beach, FL 33441-5634 or by calling 1-800-965-8307
or 954-785-1121.
|
|
|

