You are not logged in.
This means you
CAN ONLY VIEW reports that were published prior to Saturday, February 24, 2024.
You
MUST UPGRADE YOUR MEMBERSHIP if you want to see any current reports.
AFTER MARKET UPDATE - FRIDAY, FEBRUARY 18TH, 2022
Previous After Market Report Next After Market Report >>>
|
|
|
|
DOW |
-232.85 |
34,079.18 |
-0.68% |
|
Volume |
1,099,827,135 |
+19% |
|
Volume |
4,441,793,900 |
+5% |
|
NASDAQ |
-168.65 |
13,548.07 |
-1.23% |
|
Advancers |
1,224 |
39% |
|
Advancers |
1,510 |
34% |
|
S&P 500 |
-31.39 |
4,348.87 |
-0.72% |
|
Decliners |
1,935 |
61% |
|
Decliners |
2,895 |
66% |
|
Russell 2000 |
-18.76 |
2,009.33 |
-0.92% |
|
52 Wk Highs |
23 |
|
|
52 Wk Highs |
30 |
|
|
S&P 600 |
-6.58 |
1,297.92 |
-0.50% |
|
52 Wk Lows |
178 |
|
|
52 Wk Lows |
454 |
|
|
Following the Monday, January 31st follow-through day in the market (M criteria) which confirmed a new uptrend the major averages have again come under noted pressure. New buying efforts may be made only in stocks fitting all key criteria of the fact-based investment system.
|
 |
Major Averages Fell Again With Higher Volume Totals
Kenneth J. Gruneisen - Passed the CAN SLIM® Master's Exam
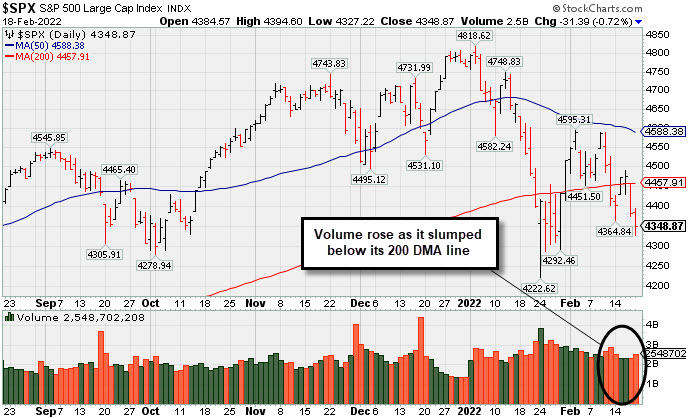
The Dow slid 232 points to extend its weekly drawdown to 1.9%. The S&P 500 lost 0.7% on the day, while the Nasdaq Composite fell 1.2%, with the benchmarks capping weekly declines of 1.6% and 1.8%, respectively. Volume totals reported were higher than the prior session on the NYSE and on the Nasdaq exchange, indicative of distributional pressure or greater institutional selling. Breadth was negative as decliners led advancer by a 3-2 margin on the NYSE and nearly 2-1 on the Nasdaq exchange. There were 10 high-ranked companies from the Leaders List that hit new 52-week highs and were listed on the BreakOuts Page, versus 7 on the prior session. New 52-week lows totals swelled and solidly outnumbered new 52-week highs on the NYSE and on the Nasdaq exchange. The market averages (M criteria) are in an uptrend under pressure. For any sustained rally there must be a healthy crop of stocks hitting new highs, so it remains critically important for leadership to improve.
 PICTURED: The Dow Jones Industrial Average met resistance at its 200-day moving average (DMA) line and fell with higher volume .
U.S. stocks finished firmly lower on Friday as a confluence of market catalysts dented risk appetite. Geopolitical tensions in Eastern Europe remained in focus, as U.S. officials cautioned that prospects of a diplomatic resolution seemed to be dimming. Additionally, investors contended with conflicting reports from both Russia and Ukraine accusing one another of cease-fire violations. Meanwhile, worries that the Federal Reserve (Fed) would be more aggressive in tightening monetary policy resurfaced after Chicago Fed President Charles Evans, widely seen as a dovish member, called for a “substantial adjustment” of current policy that he described as “wrong-footed.”
All three major averages posted a second consecutive weekly decline. Treasuries advanced, with the yield on the 10-year note down four basis points (0.04%) to 1.92%. In commodities, West Texas Intermediate crude slipped 0.2% to $91.59/barrel, capping its first weekly decline in nine weeks. COMEX gold eased 0.2% to $1896.80/ounce, still capping a third straight weekly advance with its best five-day showing since May 2021 (+3%).
10 of 11 S&P 500 sectors finished in negative territory, with the Consumer Staples group narrowly bucking the downtrend. Technology shares led laggards, with Intel Corp. (INTC -5.32%) down after being the subject of downbeat analyst commentary. In other corporate news, Celanese Corp. (CE -5.68%) fell after DuPont de Nemours, Inc. (DD -1.20%) agreed to sell the majority of its materials unit to the specialty chemicals maker in a $11 billion deal. |
 Kenneth J. Gruneisen started out as a licensed stockbroker in August 1987, a couple of months prior to the historic stock market crash that took the Dow Jones Industrial Average down -22.6% in a single day. He has published daily fact-based fundamental and technical analysis on high-ranked stocks online for two decades. Through FACTBASEDINVESTING.COM, Kenneth provides educational articles, news, market commentary, and other information regarding proven investment systems that work in good times and bad.
Comments contained in the body of this report are technical opinions only and are not necessarily those of Gruneisen Growth Corp. The material herein has been obtained from sources believed to be reliable and accurate, however, its accuracy and completeness cannot be guaranteed. Our firm, employees, and customers may effect transactions, including transactions contrary to any recommendation herein, or have positions in the securities mentioned herein or options with respect thereto. Any recommendation contained in this report may not be suitable for all investors and it is not to be deemed an offer or solicitation on our part with respect to the purchase or sale of any securities. |
|
 |
Retail, Financial, Tech, and Commodity-Linked Groups Fell
Kenneth J. Gruneisen - Passed the CAN SLIM® Master's Exam
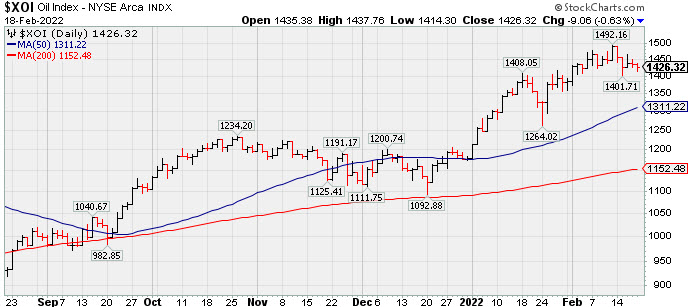
The Retail Index ($RLX -0.62%), Broker/Dealer Index ($XBD -0.40%), and Bank Index ($BKX -0.43%) each edged lower and created a drag on the major averages. The Semiconductor Index ($SOX -1.12%) and Biotech Index ($BTK -0.80%) both lost ground while the Networking Index ($NWX +0.18%) eked out a tiny gain. Commodity-linked groups also had a negative bias as the Oil Services Index ($OSX -2.06%), Integrated Oil Index ($XOI -0.63%), and Gold & Silver Index ($XAU -0.99%) each lost ground. PICTURED: The Integrated Oil Index ($XOI -0.63%) has been hovering near its 52-week high.
| Oil Services |
$OSX |
66.79 |
-1.41 |
-2.06% |
+26.69% |
| Integrated Oil |
$XOI |
1,426.32 |
-9.06 |
-0.63% |
+21.06% |
| Semiconductor |
$SOX |
3,384.30 |
-38.30 |
-1.12% |
-14.24% |
| Networking |
$NWX |
868.24 |
+1.54 |
+0.18% |
-10.59% |
| Broker/Dealer |
$XBD |
490.12 |
-1.96 |
-0.40% |
+0.67% |
| Retail |
$RLX |
3,751.87 |
-23.24 |
-0.62% |
-11.23% |
| Gold & Silver |
$XAU |
142.08 |
-1.42 |
-0.99% |
+7.27% |
| Bank |
$BKX |
137.20 |
-0.60 |
-0.43% |
+3.76% |
| Biotech |
$BTK |
4,936.57 |
-39.72 |
-0.80% |
-10.54% |
|
|
|
 |
Extended From Prior Base After 6th Consecutive Gain
Kenneth J. Gruneisen - Passed the CAN SLIM® Master's Exam
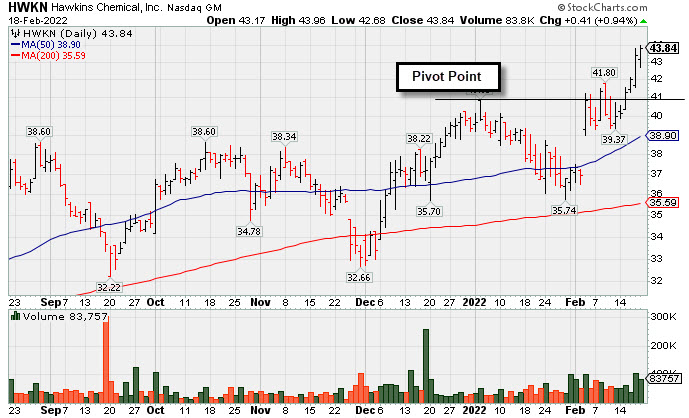
Hawkins Inc (HWKN +$0.41 or +0.94% to $43.84) posted a 6th consecutive gain today with above average volume as it hit another new all-time high. It is extended from prior highs in the $40 area which define initial support above its 50-day moving average DMA line ($39.02).
Bullish action came after it reported Dec '21 quarterly earnings +26% on +31% sales revenues versus the year ago period. Three of the 4 latest quarterly comparisons showed earnings increases above the +25% minimum guideline (C criteria) with a strong sales revenues growth rate. Annual earnings growth (A criteria) has been strong after a downturn in FY '18. It has an Earnings Per Share Rating of 90.
There are only 21.1 million shares outstanding (S criteria) which contribute to greater price volatility in the event of institutional buying or selling. The number of top-rated funds owning its shares rose from 326 in Mar '21 to 338 in Dec '21, a reassuring sign concerning the I criteria. The current Up/Down Volume Ratio of 2.0 is an unbiased indication its shares have been under accumulation over the past 50 days. The company hails from the CHEMICALS - Basic Chemicals industry group which is currently ranked 25th on the 187 Industry Groups list (L criteria). It has a Timeliness Rating of B and Sponsorship Rating of C. |
|
|
Color Codes Explained :
Y - Better candidates highlighted by our
staff of experts.
G - Previously featured
in past reports as yellow but may no longer be buyable under the
guidelines.
***Last / Change / Volume data in this table is the closing quote data***
|
|
|
THESE ARE NOT BUY RECOMMENDATIONS!
Comments contained in the body of this report are technical
opinions only. The material herein has been obtained
from sources believed to be reliable and accurate, however,
its accuracy and completeness cannot be guaranteed.
This site is not an investment advisor, hence it does
not endorse or recommend any securities or other investments.
Any recommendation contained in this report may not
be suitable for all investors and it is not to be deemed
an offer or solicitation on our part with respect to
the purchase or sale of any securities. All trademarks,
service marks and trade names appearing in this report
are the property of their respective owners, and are
likewise used for identification purposes only.
This report is a service available
only to active Paid Premium Members.
You may opt-out of receiving report notifications
at any time. Questions or comments may be submitted
by writing to Premium Membership Services 665 S.E. 10 Street, Suite 201 Deerfield Beach, FL 33441-5634 or by calling 1-800-965-8307
or 954-785-1121.
|
|
|