You are not logged in.
This means you
CAN ONLY VIEW reports that were published prior to Sunday, February 18, 2024.
You
MUST UPGRADE YOUR MEMBERSHIP if you want to see any current reports.
AFTER MARKET UPDATE - THURSDAY, FEBRUARY 17TH, 2022
Previous After Market Report Next After Market Report >>>
|
|
|
|
DOW |
-622.24 |
34,312.03 |
-1.78% |
|
Volume |
923,473,887 |
+4% |
|
Volume |
4,239,018,400 |
+2% |
|
NASDAQ |
-407.38 |
13,716.72 |
-2.88% |
|
Advancers |
854 |
26% |
|
Advancers |
1,027 |
23% |
|
S&P 500 |
-94.75 |
4,380.26 |
-2.12% |
|
Decliners |
2,384 |
74% |
|
Decliners |
3,354 |
77% |
|
Russell 2000 |
-51.22 |
2,028.09 |
-2.46% |
|
52 Wk Highs |
21 |
|
|
52 Wk Highs |
36 |
|
|
S&P 600 |
-25.19 |
1,304.50 |
-1.89% |
|
52 Wk Lows |
156 |
|
|
52 Wk Lows |
334 |
|
|
Following the Monday, January 31st follow-through day in the market (M criteria) which confirmed a new uptrend the major averages have again come under noted pressure. New buying efforts may be made only in stocks fitting all key criteria of the fact-based investment system.
|
 |
Major Indices Fall Under Greater Pressure
Kenneth J. Gruneisen - Passed the CAN SLIM® Master's Exam
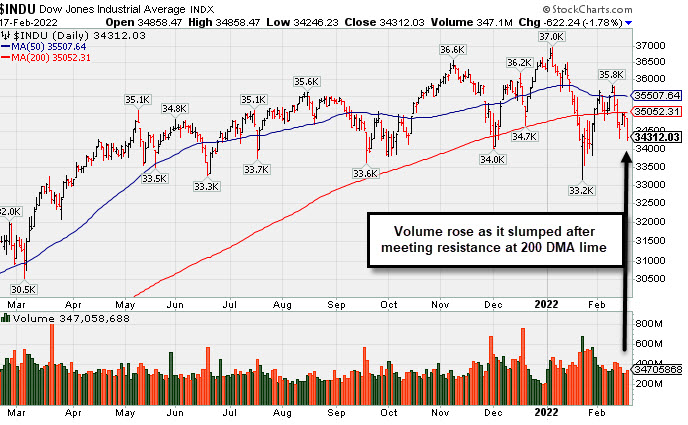
The Dow slid 622 points, its biggest one-day decline of 2022. The S&P 500 fell 2.1%, while the Nasdaq Composite slumped 2.9% as Tech shares led laggards.. Volume totals reported were higher than the prior session on the NYSE and on the Nasdaq exchange, indicative of distributional pressure or greater institutional selling. Breadth was negative as decliners led advancer by nearly a 3-1 margin on the NYSE and on the Nasdaq exchange. There were 7 high-ranked companies from the Leaders List that hit new 52-week highs and were listed on the BreakOuts Page, versus 20 on the prior session. New 52-week lows totals solidly outnumbered shrinking new 52-week highs totals on the NYSE and on the Nasdaq exchange. The market averages (M criteria) are in an uptrend under pressure. For any sustained rally there must be a healthy crop of stocks hitting new highs, so it remains critically important for leadership to improve. PICTURED: The Dow Jones Industrial Average met resistance at its 200-day moving average (DMA) line and fell with higher volume .
U.S. stocks finished firmly lower on Thursday as geopolitical tensions continued to dampen risk appetite. Investors contended with conflicting reports about Russia amassing additional troops on the border of Ukraine and fresh warnings from President Biden about an imminent Russian invasion. Treasuries advanced amid the perceived risk-off tone, with the yield on the 10-year note down six basis points (0.06%) to 1.96%. In commodities, West Texas Intermediate crude lost 2.1% to $91.67/barrel, while COMEX gold jumped 1.6% to $1,899.50/ounce.
Nine of 11 S&P 500 sectors closed in negative territory, with the traditionally defensive Consumer Staples and Utilities groups the only advancers. Corporate earnings results provided a bright spot, with Walmart Inc. (WMT +4.01%) rose after topping analyst profit and sales estimates. DoorDash Inc. (DASH +10.69%) rose on the heels of a record number of food-delivery orders in the latest quarter. Cisco Systems Inc. (CSCO +2.73%) rose after providing an upbeat outlook and boosting its share buyback program. Meanwhile, NVIDIA Corp. (NVDA -7.51%) fell as its forward guidance failed to meet Wall Street’s lofty expectations.
On the data front, weekly initial jobless claims came in at 248,000, unexpectedly rising from the prior 225,000 figure. Separately, housing starts declined 4.1% in January, while building permits rose 0.7% during the same period, defying projections for a 7.2% slump. Notably, the 30-year fixed-rate mortgage climbed to 3.92% in the latest week, a peak not seen since May 2019. |
 Kenneth J. Gruneisen started out as a licensed stockbroker in August 1987, a couple of months prior to the historic stock market crash that took the Dow Jones Industrial Average down -22.6% in a single day. He has published daily fact-based fundamental and technical analysis on high-ranked stocks online for two decades. Through FACTBASEDINVESTING.COM, Kenneth provides educational articles, news, market commentary, and other information regarding proven investment systems that work in good times and bad.
Comments contained in the body of this report are technical opinions only and are not necessarily those of Gruneisen Growth Corp. The material herein has been obtained from sources believed to be reliable and accurate, however, its accuracy and completeness cannot be guaranteed. Our firm, employees, and customers may effect transactions, including transactions contrary to any recommendation herein, or have positions in the securities mentioned herein or options with respect thereto. Any recommendation contained in this report may not be suitable for all investors and it is not to be deemed an offer or solicitation on our part with respect to the purchase or sale of any securities. |
|
 |
Financial, Retail, and Tech Indexes Led Market Pulback
Kenneth J. Gruneisen - Passed the CAN SLIM® Master's Exam
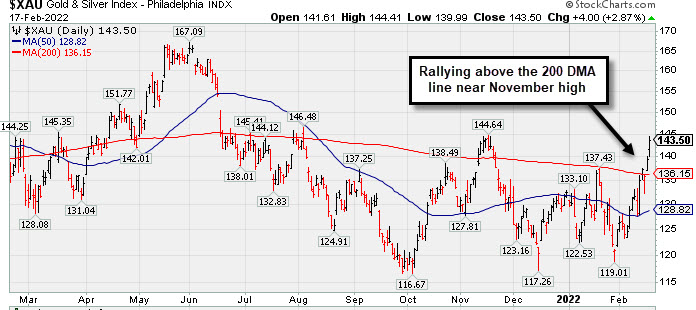
The Bank Index ($BKX -3.65%), Broker/Dealer Index ($XBD -2.79%), and Retail Index ($RLX -1.96%) suffered big losses weighing on the major averages. The Semiconductor Index ($SOX -3.74%) and Biotech Index ($BTK -2.98%) led the tech sector's retreat while the Networking Index ($NWX -0.89%) also fell. The Gold & Silver Index ($XAU +2.87%) posted a solid gain while the Oil Services Index ($OSX -1.38%) slumped and the Integrated Oil Index ($XOI -0.18%) also edged lower. PICTURED: The Gold & Silver Index ($XAU +2.87%) has rebounded above its 200-day moving average (DMA) line with recent gains..
| Oil Services |
$OSX |
68.20 |
-0.95 |
-1.38% |
+29.36% |
| Integrated Oil |
$XOI |
1,435.38 |
-2.65 |
-0.18% |
+21.83% |
| Semiconductor |
$SOX |
3,422.60 |
-133.09 |
-3.74% |
-13.27% |
| Networking |
$NWX |
866.70 |
-7.78 |
-0.89% |
-10.75% |
| Broker/Dealer |
$XBD |
492.08 |
-14.11 |
-2.79% |
+1.07% |
| Retail |
$RLX |
3,775.11 |
-75.47 |
-1.96% |
-10.68% |
| Gold & Silver |
$XAU |
143.50 |
+4.00 |
+2.87% |
+8.35% |
| Bank |
$BKX |
137.79 |
-5.22 |
-3.65% |
+4.22% |
| Biotech |
$BTK |
4,976.28 |
-153.08 |
-2.98% |
-9.82% |
|
|
|
 |
Featured Stocks
Kenneth J. Gruneisen - Passed the CAN SLIM® Master's Exam
|
|
|
Color Codes Explained :
Y - Better candidates highlighted by our
staff of experts.
G - Previously featured
in past reports as yellow but may no longer be buyable under the
guidelines.
***Last / Change / Volume data in this table is the closing quote data***
|
|
|
THESE ARE NOT BUY RECOMMENDATIONS!
Comments contained in the body of this report are technical
opinions only. The material herein has been obtained
from sources believed to be reliable and accurate, however,
its accuracy and completeness cannot be guaranteed.
This site is not an investment advisor, hence it does
not endorse or recommend any securities or other investments.
Any recommendation contained in this report may not
be suitable for all investors and it is not to be deemed
an offer or solicitation on our part with respect to
the purchase or sale of any securities. All trademarks,
service marks and trade names appearing in this report
are the property of their respective owners, and are
likewise used for identification purposes only.
This report is a service available
only to active Paid Premium Members.
You may opt-out of receiving report notifications
at any time. Questions or comments may be submitted
by writing to Premium Membership Services 665 S.E. 10 Street, Suite 201 Deerfield Beach, FL 33441-5634 or by calling 1-800-965-8307
or 954-785-1121.
|
|
|