***Last / Change / Volume data in this table is the closing quote data***
Symbol/Exchange
Company Name
Industry Group |
PRICE |
CHANGE
(%Change) |
Day High |
Volume
(% DAV)
(% 50 day avg vol) |
52 Wk Hi
% From Hi |
Featured
Date |
Price
Featured |
Pivot Featured |
|
Max Buy |
MLR
-
NYSE
Miller Industries Inc
AUTOMOTIVE - Auto Parts
|
$31.53
|
+1.17
3.85% |
$31.95
|
46,638
155.46% of 50 DAV
50 DAV is 30,000
|
$30.84
2.24%
|
11/30/2018
|
$28.35
|
PP = $29.50
|
|
MB = $30.98
|
 Most Recent Note - 2/15/2019 2:53:42 PM
G - Color code is changed to green after hitting a new all-time high and rising above its "max buy" level with today's 4th consecutive gain. Recent gains above the pivot point were not backed by that at least +40% above average volume needed to clinch a proper technical buy signal. Its 50 DMA line ($28.42) defines near-term support to watch on pullbacks.
>>> FEATURED STOCK ARTICLE : Traded Above Pivot Point Recently Without Great Volume - 1/29/2019 |
View all notes |
Set NEW NOTE alert |
Company Profile |
SEC
News |
Chart |
Request a new note
C
A
S
I |
NSP
-
NYSE
Insperity Inc
Comml Svcs-Outsourcing
|
$129.73
|
+4.63
3.70% |
$129.87
|
631,289
179.85% of 50 DAV
50 DAV is 351,000
|
$132.50
-2.09%
|
2/11/2019
|
$127.91
|
PP = $121.25
|
|
MB = $127.31
|
Most Recent Note - 2/15/2019 2:55:23 PM
G - Posting another gain today with above average volume, rising above its "max buy" level and its color code is changed to green. Prior highs in the $119-121 area define initial support to watch on pullbacks. See the latest FSU analysis for more details and an annotated graph.
>>> FEATURED STOCK ARTICLE : Big Breakaway Gap Triggered Technical Buy Signal - 2/11/2019 |
View all notes |
Set NEW NOTE alert |
Company Profile |
SEC
News |
Chart |
Request a new note
C
A
S
I |
ZBRA
-
NASDAQ
Zebra Tech Corp Cl A
COMPUTER HARDWARE - Computer Peripherals
|
$199.75
|
+3.28
1.67% |
$200.10
|
766,220
147.35% of 50 DAV
50 DAV is 520,000
|
$203.01
-1.61%
|
2/14/2019
|
$198.10
|
PP = $184.85
|
|
MB = $194.09
|
Most Recent Note - 2/14/2019 6:02:18 PM
Y - Finished strong after highlighted in yellow in the earlier mid-day report with new pivot point cited based on its 11/06/18 high plus 10 cents. Hit a new all-time high with today's big gain backed by +480% above average volume triggering a technical buy signal. Reported earnings +33% on +11% sales revenues for the Dec '18 quarter. See the latest FSU analysis for more details and a new annotated graph.
>>> FEATURED STOCK ARTICLE : Big Volume-Driven Gain for New High - 2/14/2019 |
View all notes |
Set NEW NOTE alert |
Company Profile |
SEC
News |
Chart |
Request a new note
C
A
S
I |
SPSC
-
NASDAQ
S P S Commerce Inc
COMPUTER SOFTWARE and SERVICES - Application Software
|
$108.69
|
+3.14
2.97% |
$108.92
|
225,495
124.58% of 50 DAV
50 DAV is 181,000
|
$113.31
-4.08%
|
2/13/2019
|
$104.30
|
PP = $100.78
|
|
MB = $105.82
|
Most Recent Note - 2/14/2019 11:38:18 AM
Y - Holding its ground today. Finished in the middle of its intra-day range with a big gain on the prior session after highlighted in yellow with pivot point cited based on its 9/14/18 high plus 10 cents in the mid-day report. Hit new all-time highs with a gap up and big gain backed by +430% above average volume triggering a technical buy signal. Reported earnings +89% on +12% sales revenues for the quarter ended December 31, 2018. The past 5 quarterly earnings comparisons were above the +25% minimum guideline (C criteria). Small downturn in FY '16 earnings was previously noted as a flaw in its annual earnings (A criteria) history. Completed new Public Offerings on 11/20/13 and 9/06/12. See the latest FSU analysis for more details and an annotated graph.
>>> FEATURED STOCK ARTICLE : Gap Up and Big Volume Driven Gain for New High - 2/13/2019 |
View all notes |
Set NEW NOTE alert |
Company Profile |
SEC
News |
Chart |
Request a new note
C
A
S
I |
SSNC
-
NASDAQ
S S & C Technologies
COMPUTER SOFTWARE and SERVICES - Application Software
|
$59.86
|
+3.52
6.25% |
$60.86
|
5,096,364
259.36% of 50 DAV
50 DAV is 1,965,000
|
$60.97
-1.82%
|
2/15/2019
|
$59.73
|
PP = $61.07
|
|
MB = $64.12
|
Most Recent Note - 2/15/2019 1:56:15 PM
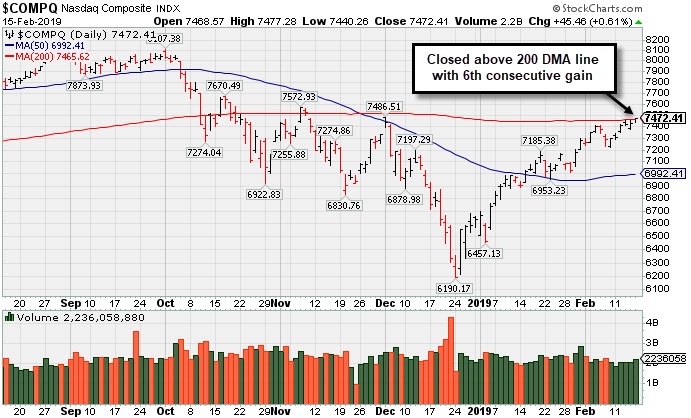
Y - Color code is changed to yellow with pivot point cited based on its 8/03/19 high plus 10 cents.No resistance remains after a big gap up today challenging its 52-week and all-time highs with its 6th consecutive gain marked by ever-increasing volume. Subsequent volume-driven gains above the pivot point may trigger a new technical buy signal. Reported earnings +76% on +153% sales revenues for the Dec '18 quarter marking its 3rd consecutive quarterly comparison above the +25% minimum earnings guideline (C criteria), helping it better match the fact-based investment system's fundamental guidelines. Went through a deep consolidation below its 200 DMA line and rebounded since last noted with caution in the 9/07/18 mid-day report. Completed new Public Offerings on 4/03/18 and on 6/19/15.
>>> FEATURED STOCK ARTICLE : Enduring Distributional Pressure While Retreating Near Prior Highs - 1/16/2014 |
View all notes |
Set NEW NOTE alert |
Company Profile |
SEC
News |
Chart |
Request a new note
C
A
S
I |
Symbol/Exchange
Company Name
Industry Group |
PRICE |
CHANGE
(%Change) |
Day High |
Volume
(% DAV)
(% 50 day avg vol) |
52 Wk Hi
% From Hi |
Featured
Date |
Price
Featured |
Pivot Featured |
|
Max Buy |
IRBT
-
NASDAQ
Irobot Corp
CONSUMER DURABLES - Electronic Equipment
|
$119.39
|
+4.11
3.57% |
$119.40
|
970,378
121.91% of 50 DAV
50 DAV is 796,000
|
$118.75
0.54%
|
2/8/2019
|
$104.92
|
PP = $103.63
|
|
MB = $108.81
|
Most Recent Note - 2/13/2019 12:46:07 PM
G - Challenging its all-time high with today's 6th consecutive volume-driven gain. Color code was changed to green after rallying above its "max buy" level. Prior high ($103) defines initial support to watch on pullbacks.
>>> FEATURED STOCK ARTICLE : Volume-Driven Gains Cleared Prior High After Double Bottom - 2/8/2019 |
View all notes |
Set NEW NOTE alert |
Company Profile |
SEC
News |
Chart |
Request a new note
C
A
S
I |
LHCG
-
NASDAQ
L H C Group Inc
HEALTH SERVICES - Home Health Care
|
$113.02
|
+0.38
0.34% |
$114.22
|
199,641
75.91% of 50 DAV
50 DAV is 263,000
|
$113.14
-0.10%
|
1/23/2019
|
$107.29
|
PP = $107.61
|
|
MB = $112.99
|
Most Recent Note - 2/13/2019 5:32:41 PM
Y - Posted a 3rd consecutive gain with below average volume. Subsequent gains above the pivot point backed by at least +40% above average volume may help clinch a convincing technical buy signal.
>>> FEATURED STOCK ARTICLE : Healthcare Services Firm Reached a New High - 1/23/2019 |
View all notes |
Set NEW NOTE alert |
Company Profile |
SEC
News |
Chart |
Request a new note
C
A
S
I |
ENSG
-
NASDAQ
Ensign Group Inc
HEALTH SERVICES - Long-Term Care Facilities
|
$52.19
|
+1.77
3.51% |
$52.22
|
324,726
86.83% of 50 DAV
50 DAV is 374,000
|
$51.21
1.91%
|
2/7/2019
|
$48.71
|
PP = $49.06
|
|
MB = $51.51
|
Most Recent Note - 2/12/2019 1:47:31 PM
Y - Posting another big gain today and hitting a new 52-week high with volume running at an above average pace. Color code was changed to yellow with pivot point cited based on its 12/12/18 high plus 10 cents.
>>> FEATURED STOCK ARTICLE : Closed Near Pivot Point After Gap Up and Big Volume-Driven Gain - 2/7/2019 |
View all notes |
Set NEW NOTE alert |
Company Profile |
SEC
News |
Chart |
Request a new note
C
A
S
I |
BSTC
-
NASDAQ
Biospecifics Technologie
Medical-Biomed/Biotech
|
$71.62
|
+3.64
5.35% |
$72.99
|
98,864
235.39% of 50 DAV
50 DAV is 42,000
|
$70.25
1.95%
|
1/18/2019
|
$67.40
|
PP = $66.31
|
|
MB = $69.63
|
Most Recent Note - 2/15/2019 1:00:12 PM
G - Hitting another new 52-week high and its color code is changed to green after rallying above its "max buy" level with today's big volume-driven gain. Thinly-traded Biomed/Biotech firm held its ground after a gain above its pivot point on 2/04/19 backed by +148% above average volume triggered a technical buy signal.
>>> FEATURED STOCK ARTICLE : Reversed Into Red After Hitting a New High - 2/5/2019 |
View all notes |
Set NEW NOTE alert |
Company Profile |
SEC
News |
Chart |
Request a new note
C
A
S
I |
UBNT
-
NASDAQ
Ubiquiti Networks
TELECOMMUNICATIONS - Diversified Communication Serv
|
$136.25
|
+0.06
0.04% |
$137.69
|
360,303
90.76% of 50 DAV
50 DAV is 397,000
|
$136.89
-0.47%
|
2/8/2019
|
$121.97
|
PP = $115.54
|
|
MB = $121.32
|
Most Recent Note - 2/14/2019 6:11:59 PM
G - Rallied further above its "max buy" level with today's 5th consecutive gain. Bullish action came after it reported earnings +75% on +23% sales revenues for the Dec '18 quarter. Prior high ($115) defines initial support to watch on pullbacks.
>>> FEATURED STOCK ARTICLE : Consolidating Above 50-Day Moving Average - 1/31/2019 |
View all notes |
Set NEW NOTE alert |
Company Profile |
SEC
News |
Chart |
Request a new note
C
A
S
I |
Symbol/Exchange
Company Name
Industry Group |
PRICE |
CHANGE
(%Change) |
Day High |
Volume
(% DAV)
(% 50 day avg vol) |
52 Wk Hi
% From Hi |
Featured
Date |
Price
Featured |
Pivot Featured |
|
Max Buy |
NOW
-
NYSE
Servicenow Inc
Computer Sftwr-Enterprse
|
$234.89
|
+0.86
0.37% |
$236.70
|
1,384,172
60.95% of 50 DAV
50 DAV is 2,271,000
|
$237.49
-1.09%
|
1/31/2019
|
$218.14
|
PP = $206.40
|
|
MB = $216.72
|
Most Recent Note - 2/12/2019 6:27:03 PM
G - Stubbornly held its ground and rallied further above its "max buy" level for yet another new all-time high. Prior high ($206) defines initial support to watch on pullbacks.
>>> FEATURED STOCK ARTICLE : Breakaway Gap Followed Strong Earnings Report - 2/1/2019 |
View all notes |
Set NEW NOTE alert |
Company Profile |
SEC
News |
Chart |
Request a new note
C
A
S
I |
PAYC
-
NYSE
Paycom Software Inc
COMPUTER SOFTWARE and SERVICES - Application Software
|
$182.47
|
+4.09
2.29% |
$182.53
|
726,771
110.96% of 50 DAV
50 DAV is 655,000
|
$179.22
1.81%
|
2/6/2019
|
$171.66
|
PP = $164.18
|
|
MB = $172.39
|
Most Recent Note - 2/14/2019 6:04:56 PM
G - Posted a gain with above average volume for a best-ever close. Color code was changed to green after rising above its "max buy" level. Prior high ($164) defines initial support to watch on pullbacks.
>>> FEATURED STOCK ARTICLE : Breakaway Gap Backed by Volume +388% Above Average - 2/6/2019 |
View all notes |
Set NEW NOTE alert |
Company Profile |
SEC
News |
Chart |
Request a new note
C
A
S
I |
PYPL
-
NASDAQ
Paypal Holdings Inc
Finance-CrdtCard/PmtPr
|
$94.91
|
+0.49
0.52% |
$95.43
|
6,018,000
65.76% of 50 DAV
50 DAV is 9,152,000
|
$96.04
-1.18%
|
1/24/2019
|
$92.56
|
PP = $93.80
|
|
MB = $98.49
|
Most Recent Note - 2/11/2019 5:19:53 PM
Y - Posted a small gain today on light volume. Reported +25% earnings on +13% sales revenues for the Dec '18 quarter. Disciplined investors note that the recent gains above the pivot point lacked the +40% above average volume needed to trigger a proper technical buy signal.
>>> FEATURED STOCK ARTICLE : Perched Within Striking Distance of High Ahead of Earnings News - 1/24/2019 |
View all notes |
Set NEW NOTE alert |
Company Profile |
SEC
News |
Chart |
Request a new note
C
A
S
I |
ALRM
-
NASDAQ
Alarm.com Holdings Inc
Security/Sfty
|
$65.01
|
+0.00
0.00% |
$65.30
|
285,581
53.99% of 50 DAV
50 DAV is 529,000
|
$65.58
-0.87%
|
1/22/2019
|
$60.52
|
PP = $60.30
|
|
MB = $63.32
|
Most Recent Note - 2/13/2019 5:31:27 PM
G - Volume totals have been cooling while stubbornly holding its ground perched near its all-time high. Prior highs in the $60 area define initial support to watch on pullbacks.
>>> FEATURED STOCK ARTICLE : Pullback Broke Steak of Gains and Reversed From New High - 1/22/2019 |
View all notes |
Set NEW NOTE alert |
Company Profile |
SEC
News |
Chart |
Request a new note
C
A
S
I |
PLNT
-
NYSE
Planet Fitness Inc Cl A
Leisure-Services
|
$58.97
|
+0.33
0.56% |
$59.35
|
951,523
76.61% of 50 DAV
50 DAV is 1,242,000
|
$59.91
-1.57%
|
11/7/2018
|
$57.10
|
PP = $55.45
|
|
MB = $58.22
|
Most Recent Note - 2/11/2019 5:18:54 PM
Y - Color code is changed to yellow while quietly consolidating just below its "max buy" level. Its 50 DMA line ($55.85) defines important near-term support to watch above the recent low ($48).
>>> FEATURED STOCK ARTICLE : Hovering in a Tight Range Near All-Time High - 1/25/2019 |
View all notes |
Set NEW NOTE alert |
Company Profile |
SEC
News |
Chart |
Request a new note
C
A
S
I |
Symbol/Exchange
Company Name
Industry Group |
PRICE |
CHANGE
(%Change) |
Day High |
Volume
(% DAV)
(% 50 day avg vol) |
52 Wk Hi
% From Hi |
Featured
Date |
Price
Featured |
Pivot Featured |
|
Max Buy |
TEAM
-
NASDAQ
Atlassian Corp Plc Cl A
Comp Sftwr-Spec Enterprs
|
$104.90
|
+0.09
0.09% |
$106.15
|
898,491
51.31% of 50 DAV
50 DAV is 1,751,000
|
$107.20
-2.15%
|
1/7/2019
|
$94.68
|
PP = $98.31
|
|
MB = $103.23
|
Most Recent Note - 2/11/2019 5:21:47 PM
G - Quiet gain today hit another new all-time high. Recent gains have lacked great volume conviction. Gains and a strong close above the pivot point backed by at least +40% above average volume are needed to clinch a proper technical buy signal. Its 50 DMA line ($90.34) and prior low define near-term support to watch on pullbacks. Fundamentals remain strong.
>>> FEATURED STOCK ARTICLE : Volume Light While Hovering Near High - 1/28/2019 |
View all notes |
Set NEW NOTE alert |
Company Profile |
SEC
News |
Chart |
Request a new note
C
A
S
I |
GLOB
-
NYSE
Globant SA
Computer-Tech Services
|
$70.78
|
+2.52
3.69% |
$73.00
|
591,401
261.68% of 50 DAV
50 DAV is 226,000
|
$69.90
1.26%
|
2/15/2019
|
$69.35
|
PP = $70.00
|
|
MB = $73.50
|
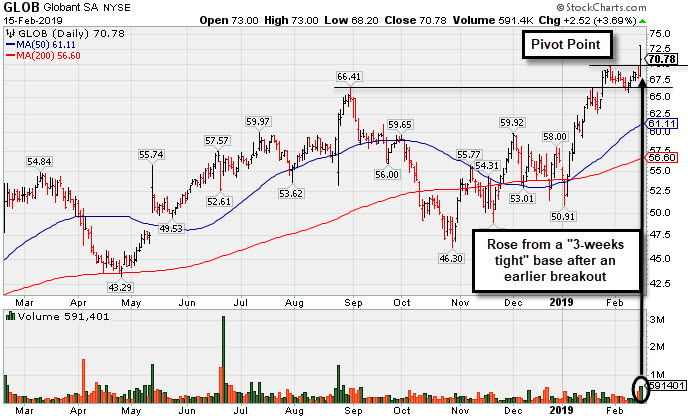
Most Recent Note - 2/15/2019 5:21:48 PM
Y - Finished in the middle of its intra-day range with gain for new high backed by +160% above average volume. Color code was changed to yellow with pivot point cited based on its 1/30/19 high plus 10 cents. Rallied from an advanced "3-weeks tight" base. Volume-driven gains for new highs in prior weeks triggered an earlier technical buy signal. Reported Dec '18 quarterly earnings +28% on +21% sales revenues. Prior quarterly comparisons versus the year ago periods were very near or above the +25% minimum earnings guideline (C criteria). This Luxembourg-based Computer - Tech Services firm completed a Secondary Offering on 6/21/18. See the latest FSU for more details and a new annotated graph.
>>> FEATURED STOCK ARTICLE : Volume-Driven Gain From Advanced "3-Weeks Tight" Base - 2/15/2019 |
View all notes |
Set NEW NOTE alert |
Company Profile |
SEC
News |
Chart |
Request a new note
C
A
S
I |
TTD
-
NASDAQ
The Trade Desk Inc Cl A
Comml Svcs-Advertising
|
$158.12
|
+4.69
3.06% |
$158.27
|
1,271,093
118.57% of 50 DAV
50 DAV is 1,072,000
|
$161.50
-2.09%
|
2/6/2019
|
$148.65
|
PP = $149.00
|
|
MB = $156.45
|
Most Recent Note - 2/12/2019 6:30:15 PM
Y - Posted a 3rd consecutive gain today with lighter than average volume. Faces little resistance due to overhead supply up to the $161 level. Gain on 2/04/19 was backed by +48% above average volume while clearing a "double bottom" base. Reported earnings +86% on +50% sales revenues for the Sep '18 quarter. Three of the past 4 quarterly comparisons were well above the +25% minimum guideline (C criteria). See the latest FSU analysis for more details and a new annotated graph.
>>> FEATURED STOCK ARTICLE : Near High After Third Consecutive Gain with Light Volume - 2/12/2019 |
View all notes |
Set NEW NOTE alert |
Company Profile |
SEC
News |
Chart |
Request a new note
C
A
S
I |
MEDP
-
NASDAQ
Medpace Holdings Inc
Medical-Research Eqp/Svc
|
$70.36
|
+2.00
2.93% |
$70.39
|
558,138
71.19% of 50 DAV
50 DAV is 784,000
|
$69.71
0.93%
|
1/30/2019
|
$64.10
|
PP = $65.19
|
|
MB = $68.45
|
Most Recent Note - 2/13/2019 5:34:49 PM
Y - Posted a 2nd big gain today with below average volume for its second-best close ever. Subsequent gains above the pivot point backed by at least +40% above average volume may trigger a technical buy signal. Fundamentals remain strong. The 200 DMA line acted as support above the prior low and it has rebounded since dropped from the Featured Stocks list on 12/19/18.
>>> FEATURED STOCK ARTICLE : Rallied Near 52-Week High With a Volume-Driven Gain - 1/30/2019 |
View all notes |
Set NEW NOTE alert |
Company Profile |
SEC
News |
Chart |
Request a new note
C
A
S
I |