You are not logged in.
This means you
CAN ONLY VIEW reports that were published prior to Sunday, February 25, 2024.
You
MUST UPGRADE YOUR MEMBERSHIP if you want to see any current reports.
AFTER MARKET UPDATE - THURSDAY, FEBRUARY 14TH, 2019
Previous After Market Report Next After Market Report >>>
|
|
|
|
DOW |
-103.88 |
25,439.39 |
-0.41% |
|
Volume |
950,472,550 |
+16% |
|
Volume |
2,102,474,230 |
+1% |
|
NASDAQ |
+6.57 |
7,426.95 |
+0.09% |
|
Advancers |
1,577 |
54% |
|
Advancers |
1,545 |
51% |
|
S&P 500 |
-7.30 |
2,745.73 |
-0.27% |
|
Decliners |
1,356 |
46% |
|
Decliners |
1,512 |
49% |
|
Russell 2000 |
+2.16 |
1,545.11 |
+0.14% |
|
52 Wk Highs |
71 |
|
|
52 Wk Highs |
75 |
|
|
S&P 600 |
+2.05 |
961.15 |
+0.21% |
|
52 Wk Lows |
8 |
|
|
52 Wk Lows |
29 |
|
|
 |
Leadership Waned as Major Indices Ended Mixed
Kenneth J. Gruneisen - Passed the CAN SLIM® Master's Exam
Stocks finished mixed Thursday. The Dow fell 103 points to 25,439 while the S&P 500 lost 7 points to 2,745. The Nasdaq Composite added 6 points to 7,426. The volume totals were higher than the prior session on both the NYSE and the Nasdaq exchange. Advancers narrowly led decliners on the NYSE and on the Nasdaq exchange. There were 33 high-ranked companies from the Leaders List that made a new 52-week high and were listed on the BreakOuts Page, versus the total of 41 on the prior session. New 52-week highs solidly outnumbered new 52-week lows totals on the NYSE and on the Nasdaq exchange. The major indices are in a confirmed uptrend after recently noted improvements helped to signal a change in market direction (M criteria) back to a bullish stance. The Featured Stocks Page provides the most timely analysis on high-ranked leaders. Charts used courtesy of www.stockcharts.com

PICTURED: The S&P 500 Index is consolidating near its 200-day moving average (DMA) line, still -6.6% below its record high.
The major averages fluctuated as a weak economic update offset trade optimism. On the data front, a survey revealed retail sales unexpectedly slipped 1.2% in December, the largest monthly drop since September 2009. A separate update on the producer price index showed a 0.1% decline in January. However, core PPI (ex- food and energy) rebounded 0.3% from a 0.1% decline in December. Trade updates were also in focus as reports indicated the White House is considering extending the March 1st tariff deadline. Meanwhile, President Trump will reportedly sign a bipartisan boarder-security funding bill ahead of the government shutdown deadline on Friday.
Six of 11 S&P 500 sectors ended in negative territory. Consumer Staples led losses with Coca-Cola (KO -8.44%) fell after the company lowered its full year sales guidance. Financials also underperformed as American International Group (AIG -9.03%) fell after the insurance giant missed analyst profit projections for the sixth consecutive quarter. The Technology group ended in positive territory with Cisco Systems (CSCO +1.89%) rose after topping Wall Street earnings estimates.
Treasuries strengthened with the yield on the 10-year note down five basis points to 2.65%. In commodities, WTI crude gained 1.1% to $54.48/barrel. COMEX gold fell 0.1% to $1309.80/ounce despite a weaker dollar. |
 Kenneth J. Gruneisen started out as a licensed stockbroker in August 1987, a couple of months prior to the historic stock market crash that took the Dow Jones Industrial Average down -22.6% in a single day. He has published daily fact-based fundamental and technical analysis on high-ranked stocks online for two decades. Through FACTBASEDINVESTING.COM, Kenneth provides educational articles, news, market commentary, and other information regarding proven investment systems that work in good times and bad.
Comments contained in the body of this report are technical opinions only and are not necessarily those of Gruneisen Growth Corp. The material herein has been obtained from sources believed to be reliable and accurate, however, its accuracy and completeness cannot be guaranteed. Our firm, employees, and customers may effect transactions, including transactions contrary to any recommendation herein, or have positions in the securities mentioned herein or options with respect thereto. Any recommendation contained in this report may not be suitable for all investors and it is not to be deemed an offer or solicitation on our part with respect to the purchase or sale of any securities. |
|
 |
Tech and Commodity-Linked Groups Rose; Retail and Financials Fell
Kenneth J. Gruneisen - Passed the CAN SLIM® Master's Exam
The Broker/Dealer Index ($XBD -0.31%), Bank Index ($BKX -0.97%), and the Retail Index ($RLX -0.63%) suffered unanimous losses. The tech sector had a positive bias as the Semiconductor Index ($SOX +0.25%), Biotech Index ($BTK +0.47%) and the Networking Index ($NWX +0.82%) each posted small gains. The Oil Services Index ($OSX +0.17%), Integrated Oil Index ($XOI +0.23%), and the Gold & Silver Index ($XAU +0.63%) posted unanimous gains.
Charts courtesy of www.stockcharts.com
 PICTURED: The Semiconductor Index ($SOX +0.25%) rebounded from its low hit in December and has been making progress above its 200-day moving average (DMA) line.
| Oil Services |
$OSX |
96.07 |
+0.16 |
+0.17% |
+19.19% |
| Integrated Oil |
$XOI |
1,285.65 |
+2.97 |
+0.23% |
+10.92% |
| Semiconductor |
$SOX |
1,344.11 |
+3.40 |
+0.25% |
+16.36% |
| Networking |
$NWX |
565.81 |
+4.59 |
+0.82% |
+15.78% |
| Broker/Dealer |
$XBD |
262.18 |
-0.80 |
-0.31% |
+10.47% |
| Retail |
$RLX |
2,130.02 |
-13.53 |
-0.63% |
+9.15% |
| Gold & Silver |
$XAU |
74.50 |
+0.46 |
+0.62% |
+5.43% |
| Bank |
$BKX |
97.10 |
-0.95 |
-0.97% |
+13.18% |
| Biotech |
$BTK |
4,920.72 |
+22.93 |
+0.47% |
+16.58% |
|
|
|
 |
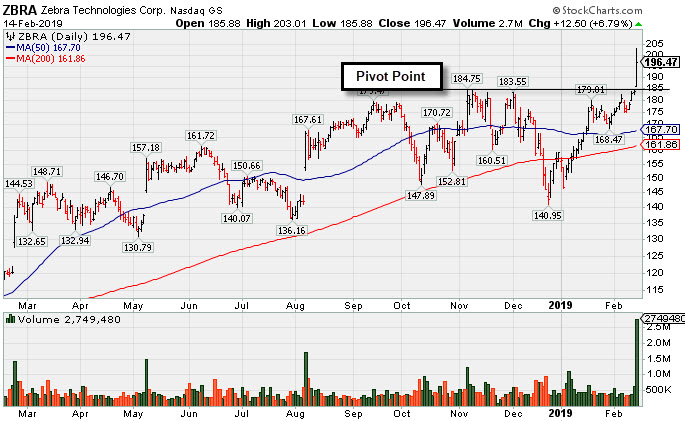
Big Volume-Driven Gain for New High
Kenneth J. Gruneisen - Passed the CAN SLIM® Master's Exam
Zebra Tech Corp Cl A (ZBRA +$12.50 or +6.79% to $196.47) was highlighted in yellow with new pivot point cited based on its 11/06/18 high plus 10 cents in the earlier mid-day report (read here). It hit a new all-time high with +480% above average volume behind its gain clinching a technical buy signal.
Fundamentals remain strong and the bullish action came after it reported earnings +33% on +11% sales revenues for the Dec '18 quarter, continuing its strong earnings track record. The past 4 quarters showed earnings increases above the +25% minimum guideline (C criteria). Annual earnings (A criteria) history has been strong since a downturn in FY '08 and '09.
It rebounded impressively after a slump below its 200-day moving average (DMA) line since dropped from the Featured Stocks list on 12/20/18. ZBRA was last shown in this FSU section on 12/18/18 with an annotated graph under the headline, "Consolidating Above 200-Day Moving Average".
The number of top-rated funds owning its shares from 553 in Sep '17 to 735 in Dec '18, a reassuring sign concerning the I criteria. Its current Up/Down Volume Ratio of 2.0 is an unbiased indication its shares have been under slight accumulation over the past 50 days. It has earned an A Timeliness Rating and a B Sponsorship Rating. There are 53.8 million shares outstanding (S criteria) which can contribute to greater price volatility in the event of institutional buying or selling.
|
|
|
Color Codes Explained :
Y - Better candidates highlighted by our
staff of experts.
G - Previously featured
in past reports as yellow but may no longer be buyable under the
guidelines.
***Last / Change / Volume data in this table is the closing quote data***
Symbol/Exchange
Company Name
Industry Group |
PRICE |
CHANGE
(%Change) |
Day High |
Volume
(% DAV)
(% 50 day avg vol) |
52 Wk Hi
% From Hi |
Featured
Date |
Price
Featured |
Pivot Featured |
|
Max Buy |
MLR
-
NYSE
Miller Industries Inc
AUTOMOTIVE - Auto Parts
|
$30.36
|
+0.13
0.43% |
$30.83
|
25,369
81.84% of 50 DAV
50 DAV is 31,000
|
$30.84
-1.56%
|
11/30/2018
|
$28.35
|
PP = $29.50
|
|
MB = $30.98
|
Most Recent Note - 2/12/2019 6:28:21 PM
Y - Volume totals have been cooling while still holding its ground near its all-time high. Subsequent gains above the pivot point backed by at least +40% above average volume may help clinch a proper technical buy signal. Its 50 DMA line ($28.28) defines near-term support to watch on pullbacks.
>>> FEATURED STOCK ARTICLE : Traded Above Pivot Point Recently Without Great Volume - 1/29/2019 |
View all notes |
Set NEW NOTE alert |
Company Profile |
SEC
News |
Chart |
Request a new note
C
A
S
I |
NSP
-
NYSE
Insperity Inc
Comml Svcs-Outsourcing
|
$125.10
|
+2.84
2.32% |
$126.47
|
601,154
174.25% of 50 DAV
50 DAV is 345,000
|
$132.50
-5.58%
|
2/11/2019
|
$127.91
|
PP = $121.25
|
|
MB = $127.31
|
 Most Recent Note - 2/14/2019 6:09:01 PM
Y - Posted a gain today with above average volume. Prior highs in the $119-121 area define initial support to watch on pullbacks. See the latest FSU analysis for more details and an annotated graph.
>>> FEATURED STOCK ARTICLE : Big Breakaway Gap Triggered Technical Buy Signal - 2/11/2019 |
View all notes |
Set NEW NOTE alert |
Company Profile |
SEC
News |
Chart |
Request a new note
C
A
S
I |
ZBRA
-
NASDAQ
Zebra Tech Corp Cl A
COMPUTER HARDWARE - Computer Peripherals
|
$196.47
|
+12.50
6.79% |
$203.01
|
2,749,479
581.29% of 50 DAV
50 DAV is 473,000
|
$184.75
6.34%
|
2/14/2019
|
$198.10
|
PP = $184.85
|
|
MB = $194.09
|
Most Recent Note - 2/14/2019 6:02:18 PM
Y - Finished strong after highlighted in yellow in the earlier mid-day report with new pivot point cited based on its 11/06/18 high plus 10 cents. Hit a new all-time high with today's big gain backed by +480% above average volume triggering a technical buy signal. Reported earnings +33% on +11% sales revenues for the Dec '18 quarter. See the latest FSU analysis for more details and a new annotated graph.
>>> FEATURED STOCK ARTICLE : Big Volume-Driven Gain for New High - 2/14/2019 |
View all notes |
Set NEW NOTE alert |
Company Profile |
SEC
News |
Chart |
Request a new note
C
A
S
I |
SPSC
-
NASDAQ
S P S Commerce Inc
COMPUTER SOFTWARE and SERVICES - Application Software
|
$105.55
|
-0.73
-0.69% |
$108.79
|
444,540
251.15% of 50 DAV
50 DAV is 177,000
|
$113.31
-6.85%
|
2/13/2019
|
$104.30
|
PP = $100.78
|
|
MB = $105.82
|
Most Recent Note - 2/14/2019 11:38:18 AM
Y - Holding its ground today. Finished in the middle of its intra-day range with a big gain on the prior session after highlighted in yellow with pivot point cited based on its 9/14/18 high plus 10 cents in the mid-day report. Hit new all-time highs with a gap up and big gain backed by +430% above average volume triggering a technical buy signal. Reported earnings +89% on +12% sales revenues for the quarter ended December 31, 2018. The past 5 quarterly earnings comparisons were above the +25% minimum guideline (C criteria). Small downturn in FY '16 earnings was previously noted as a flaw in its annual earnings (A criteria) history. Completed new Public Offerings on 11/20/13 and 9/06/12. See the latest FSU analysis for more details and an annotated graph.
>>> FEATURED STOCK ARTICLE : Gap Up and Big Volume Driven Gain for New High - 2/13/2019 |
View all notes |
Set NEW NOTE alert |
Company Profile |
SEC
News |
Chart |
Request a new note
C
A
S
I |
IRBT
-
NASDAQ
Irobot Corp
CONSUMER DURABLES - Electronic Equipment
|
$115.28
|
+0.19
0.17% |
$115.87
|
913,345
115.76% of 50 DAV
50 DAV is 789,000
|
$118.75
-2.92%
|
2/8/2019
|
$104.92
|
PP = $103.63
|
|
MB = $108.81
|
Most Recent Note - 2/13/2019 12:46:07 PM
G - Challenging its all-time high with today's 6th consecutive volume-driven gain. Color code was changed to green after rallying above its "max buy" level. Prior high ($103) defines initial support to watch on pullbacks.
>>> FEATURED STOCK ARTICLE : Volume-Driven Gains Cleared Prior High After Double Bottom - 2/8/2019 |
View all notes |
Set NEW NOTE alert |
Company Profile |
SEC
News |
Chart |
Request a new note
C
A
S
I |
Symbol/Exchange
Company Name
Industry Group |
PRICE |
CHANGE
(%Change) |
Day High |
Volume
(% DAV)
(% 50 day avg vol) |
52 Wk Hi
% From Hi |
Featured
Date |
Price
Featured |
Pivot Featured |
|
Max Buy |
LHCG
-
NASDAQ
L H C Group Inc
HEALTH SERVICES - Home Health Care
|
$112.64
|
+1.74
1.57% |
$113.14
|
189,687
71.58% of 50 DAV
50 DAV is 265,000
|
$112.22
0.37%
|
1/23/2019
|
$107.29
|
PP = $107.61
|
|
MB = $112.99
|
Most Recent Note - 2/13/2019 5:32:41 PM
Y - Posted a 3rd consecutive gain with below average volume. Subsequent gains above the pivot point backed by at least +40% above average volume may help clinch a convincing technical buy signal.
>>> FEATURED STOCK ARTICLE : Healthcare Services Firm Reached a New High - 1/23/2019 |
View all notes |
Set NEW NOTE alert |
Company Profile |
SEC
News |
Chart |
Request a new note
C
A
S
I |
ENSG
-
NASDAQ
Ensign Group Inc
HEALTH SERVICES - Long-Term Care Facilities
|
$50.42
|
+0.01
0.02% |
$50.55
|
398,003
106.70% of 50 DAV
50 DAV is 373,000
|
$51.21
-1.54%
|
2/7/2019
|
$48.71
|
PP = $49.06
|
|
MB = $51.51
|
Most Recent Note - 2/12/2019 1:47:31 PM
Y - Posting another big gain today and hitting a new 52-week high with volume running at an above average pace. Color code was changed to yellow with pivot point cited based on its 12/12/18 high plus 10 cents.
>>> FEATURED STOCK ARTICLE : Closed Near Pivot Point After Gap Up and Big Volume-Driven Gain - 2/7/2019 |
View all notes |
Set NEW NOTE alert |
Company Profile |
SEC
News |
Chart |
Request a new note
C
A
S
I |
BSTC
-
NASDAQ
Biospecifics Technologie
Medical-Biomed/Biotech
|
$67.98
|
+0.04
0.06% |
$68.57
|
28,625
66.57% of 50 DAV
50 DAV is 43,000
|
$70.25
-3.23%
|
1/18/2019
|
$67.40
|
PP = $66.31
|
|
MB = $69.63
|
Most Recent Note - 2/11/2019 5:24:02 PM
Y - Hovering near its 52-week high. Thinly-traded Biomed/Biotech firm held its ground after a gain above its pivot point on 2/04/19 backed by +148% above average volume triggered a technical buy signal.
>>> FEATURED STOCK ARTICLE : Reversed Into Red After Hitting a New High - 2/5/2019 |
View all notes |
Set NEW NOTE alert |
Company Profile |
SEC
News |
Chart |
Request a new note
C
A
S
I |
UBNT
-
NASDAQ
Ubiquiti Networks
TELECOMMUNICATIONS - Diversified Communication Serv
|
$136.19
|
+2.93
2.20% |
$136.89
|
568,071
144.18% of 50 DAV
50 DAV is 394,000
|
$133.88
1.73%
|
2/8/2019
|
$121.97
|
PP = $115.54
|
|
MB = $121.32
|
Most Recent Note - 2/14/2019 6:11:59 PM
G - Rallied further above its "max buy" level with today's 5th consecutive gain. Bullish action came after it reported earnings +75% on +23% sales revenues for the Dec '18 quarter. Prior high ($115) defines initial support to watch on pullbacks.
>>> FEATURED STOCK ARTICLE : Consolidating Above 50-Day Moving Average - 1/31/2019 |
View all notes |
Set NEW NOTE alert |
Company Profile |
SEC
News |
Chart |
Request a new note
C
A
S
I |
NOW
-
NYSE
Servicenow Inc
Computer Sftwr-Enterprse
|
$234.03
|
+2.06
0.89% |
$235.84
|
1,292,560
56.00% of 50 DAV
50 DAV is 2,308,000
|
$237.49
-1.46%
|
1/31/2019
|
$218.14
|
PP = $206.40
|
|
MB = $216.72
|
Most Recent Note - 2/12/2019 6:27:03 PM
G - Stubbornly held its ground and rallied further above its "max buy" level for yet another new all-time high. Prior high ($206) defines initial support to watch on pullbacks.
>>> FEATURED STOCK ARTICLE : Breakaway Gap Followed Strong Earnings Report - 2/1/2019 |
View all notes |
Set NEW NOTE alert |
Company Profile |
SEC
News |
Chart |
Request a new note
C
A
S
I |
Symbol/Exchange
Company Name
Industry Group |
PRICE |
CHANGE
(%Change) |
Day High |
Volume
(% DAV)
(% 50 day avg vol) |
52 Wk Hi
% From Hi |
Featured
Date |
Price
Featured |
Pivot Featured |
|
Max Buy |
PAYC
-
NYSE
Paycom Software Inc
COMPUTER SOFTWARE and SERVICES - Application Software
|
$178.38
|
+5.32
3.07% |
$178.68
|
1,182,581
183.35% of 50 DAV
50 DAV is 645,000
|
$179.22
-0.47%
|
2/6/2019
|
$171.66
|
PP = $164.18
|
|
MB = $172.39
|
Most Recent Note - 2/14/2019 6:04:56 PM
G - Posted a gain with above average volume for a best-ever close. Color code was changed to green after rising above its "max buy" level. Prior high ($164) defines initial support to watch on pullbacks.
>>> FEATURED STOCK ARTICLE : Breakaway Gap Backed by Volume +388% Above Average - 2/6/2019 |
View all notes |
Set NEW NOTE alert |
Company Profile |
SEC
News |
Chart |
Request a new note
C
A
S
I |
PYPL
-
NASDAQ
Paypal Holdings Inc
Finance-CrdtCard/PmtPr
|
$94.42
|
+0.41
0.44% |
$94.99
|
6,456,060
69.83% of 50 DAV
50 DAV is 9,246,000
|
$96.04
-1.69%
|
1/24/2019
|
$92.56
|
PP = $93.80
|
|
MB = $98.49
|
Most Recent Note - 2/11/2019 5:19:53 PM
Y - Posted a small gain today on light volume. Reported +25% earnings on +13% sales revenues for the Dec '18 quarter. Disciplined investors note that the recent gains above the pivot point lacked the +40% above average volume needed to trigger a proper technical buy signal.
>>> FEATURED STOCK ARTICLE : Perched Within Striking Distance of High Ahead of Earnings News - 1/24/2019 |
View all notes |
Set NEW NOTE alert |
Company Profile |
SEC
News |
Chart |
Request a new note
C
A
S
I |
ALRM
-
NASDAQ
Alarm.com Holdings Inc
Security/Sfty
|
$65.01
|
+0.27
0.42% |
$65.34
|
283,786
53.04% of 50 DAV
50 DAV is 535,000
|
$65.58
-0.87%
|
1/22/2019
|
$60.52
|
PP = $60.30
|
|
MB = $63.32
|
Most Recent Note - 2/13/2019 5:31:27 PM
G - Volume totals have been cooling while stubbornly holding its ground perched near its all-time high. Prior highs in the $60 area define initial support to watch on pullbacks.
>>> FEATURED STOCK ARTICLE : Pullback Broke Steak of Gains and Reversed From New High - 1/22/2019 |
View all notes |
Set NEW NOTE alert |
Company Profile |
SEC
News |
Chart |
Request a new note
C
A
S
I |
PLNT
-
NYSE
Planet Fitness Inc Cl A
Leisure-Services
|
$58.64
|
+0.21
0.36% |
$58.90
|
434,276
34.52% of 50 DAV
50 DAV is 1,258,000
|
$59.91
-2.12%
|
11/7/2018
|
$57.10
|
PP = $55.45
|
|
MB = $58.22
|
Most Recent Note - 2/11/2019 5:18:54 PM
Y - Color code is changed to yellow while quietly consolidating just below its "max buy" level. Its 50 DMA line ($55.85) defines important near-term support to watch above the recent low ($48).
>>> FEATURED STOCK ARTICLE : Hovering in a Tight Range Near All-Time High - 1/25/2019 |
View all notes |
Set NEW NOTE alert |
Company Profile |
SEC
News |
Chart |
Request a new note
C
A
S
I |
TEAM
-
NASDAQ
Atlassian Corp Plc Cl A
Comp Sftwr-Spec Enterprs
|
$104.81
|
-0.44
-0.42% |
$105.78
|
1,193,415
68.00% of 50 DAV
50 DAV is 1,755,000
|
$107.20
-2.23%
|
1/7/2019
|
$94.68
|
PP = $98.31
|
|
MB = $103.23
|
Most Recent Note - 2/11/2019 5:21:47 PM
G - Quiet gain today hit another new all-time high. Recent gains have lacked great volume conviction. Gains and a strong close above the pivot point backed by at least +40% above average volume are needed to clinch a proper technical buy signal. Its 50 DMA line ($90.34) and prior low define near-term support to watch on pullbacks. Fundamentals remain strong.
>>> FEATURED STOCK ARTICLE : Volume Light While Hovering Near High - 1/28/2019 |
View all notes |
Set NEW NOTE alert |
Company Profile |
SEC
News |
Chart |
Request a new note
C
A
S
I |
Symbol/Exchange
Company Name
Industry Group |
PRICE |
CHANGE
(%Change) |
Day High |
Volume
(% DAV)
(% 50 day avg vol) |
52 Wk Hi
% From Hi |
Featured
Date |
Price
Featured |
Pivot Featured |
|
Max Buy |
TTD
-
NASDAQ
The Trade Desk Inc Cl A
Comml Svcs-Advertising
|
$153.43
|
+2.09
1.38% |
$154.94
|
957,500
89.32% of 50 DAV
50 DAV is 1,072,000
|
$161.50
-5.00%
|
2/6/2019
|
$148.65
|
PP = $149.00
|
|
MB = $156.45
|
Most Recent Note - 2/12/2019 6:30:15 PM
Y - Posted a 3rd consecutive gain today with lighter than average volume. Faces little resistance due to overhead supply up to the $161 level. Gain on 2/04/19 was backed by +48% above average volume while clearing a "double bottom" base. Reported earnings +86% on +50% sales revenues for the Sep '18 quarter. Three of the past 4 quarterly comparisons were well above the +25% minimum guideline (C criteria). See the latest FSU analysis for more details and a new annotated graph.
>>> FEATURED STOCK ARTICLE : Near High After Third Consecutive Gain with Light Volume - 2/12/2019 |
View all notes |
Set NEW NOTE alert |
Company Profile |
SEC
News |
Chart |
Request a new note
C
A
S
I |
MEDP
-
NASDAQ
Medpace Holdings Inc
Medical-Research Eqp/Svc
|
$68.36
|
+1.27
1.89% |
$68.83
|
538,824
68.29% of 50 DAV
50 DAV is 789,000
|
$69.71
-1.94%
|
1/30/2019
|
$64.10
|
PP = $65.19
|
|
MB = $68.45
|
Most Recent Note - 2/13/2019 5:34:49 PM
Y - Posted a 2nd big gain today with below average volume for its second-best close ever. Subsequent gains above the pivot point backed by at least +40% above average volume may trigger a technical buy signal. Fundamentals remain strong. The 200 DMA line acted as support above the prior low and it has rebounded since dropped from the Featured Stocks list on 12/19/18.
>>> FEATURED STOCK ARTICLE : Rallied Near 52-Week High With a Volume-Driven Gain - 1/30/2019 |
View all notes |
Set NEW NOTE alert |
Company Profile |
SEC
News |
Chart |
Request a new note
C
A
S
I |
|
|
|
THESE ARE NOT BUY RECOMMENDATIONS!
Comments contained in the body of this report are technical
opinions only. The material herein has been obtained
from sources believed to be reliable and accurate, however,
its accuracy and completeness cannot be guaranteed.
This site is not an investment advisor, hence it does
not endorse or recommend any securities or other investments.
Any recommendation contained in this report may not
be suitable for all investors and it is not to be deemed
an offer or solicitation on our part with respect to
the purchase or sale of any securities. All trademarks,
service marks and trade names appearing in this report
are the property of their respective owners, and are
likewise used for identification purposes only.
This report is a service available
only to active Paid Premium Members.
You may opt-out of receiving report notifications
at any time. Questions or comments may be submitted
by writing to Premium Membership Services 665 S.E. 10 Street, Suite 201 Deerfield Beach, FL 33441-5634 or by calling 1-800-965-8307
or 954-785-1121.
|
|
|