You are not logged in.
This means you
CAN ONLY VIEW reports that were published prior to Monday, February 19, 2024.
You
MUST UPGRADE YOUR MEMBERSHIP if you want to see any current reports.
AFTER MARKET UPDATE - TUESDAY, FEBRUARY 11TH, 2020
Previous After Market Report Next After Market Report >>>
|
|
|
|
DOW |
-0.48 |
29,276.34 |
-0.00% |
|
Volume |
835,348,830 |
-1% |
|
Volume |
2,428,097,170 |
+11% |
|
NASDAQ |
+10.55 |
9,638.94 |
+0.11% |
|
Advancers |
1,987 |
69% |
|
Advancers |
1,966 |
62% |
|
S&P 500 |
+5.66 |
3,357.75 |
+0.17% |
|
Decliners |
906 |
31% |
|
Decliners |
1,190 |
38% |
|
Russell 2000 |
+9.85 |
1,677.51 |
+0.59% |
|
52 Wk Highs |
345 |
|
|
52 Wk Highs |
256 |
|
|
S&P 600 |
+7.37 |
1,012.97 |
+0.73% |
|
52 Wk Lows |
45 |
|
|
52 Wk Lows |
57 |
|
|
 |
Leadership Improved and Breadth Was Positive
Kenneth J. Gruneisen - Passed the CAN SLIM® Master's Exam
The S&P 500 and Nasdaq Composite both closed at fresh record highs, adding 0.2% and 0.1%, respectively. The Dow dipped less than one point, erasing an early session gain. Advancers led decliners by more than a 2-1 margin on the NYSE and 5-3 on the Nasdaq exchange. The reported volume totals were mixed, lighter than the prior session total on the NYSE and higher on the Nasdaq exchange. Leadership improved as there were 114 high-ranked companies from the Leaders List that hit a new 52-week high and were listed on the BreakOuts Page, versus 57 on the prior session. New 52-week highs totals again expanded and easily outnumbered shrinking new 52-week lows on the NYSE and on the Nasdaq exchange. The major indices' (M criteria) remain in a confirmed uptrend. Disciplined investors buy individual stocks on a case-by-case basis only if all key criteria are met. The Featured Stocks Page provides the most timely analysis on high-ranked leaders. Charts used courtesy of www.stockcharts.com
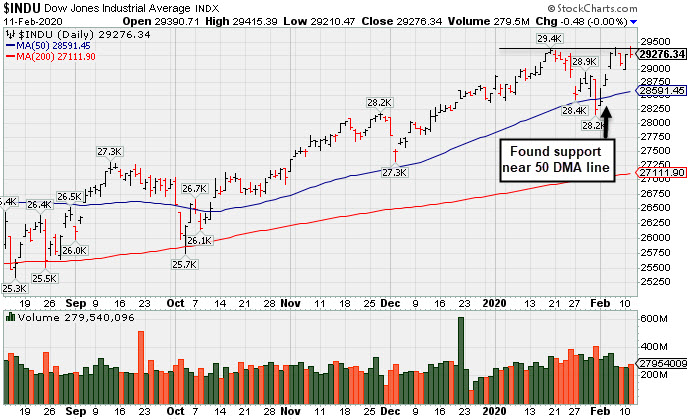
PICTURED: The Dow Jones Industrial Average remains perched at an all-time high.
Stocks finished mostly higher on Tuesday. Investor sentiment was supported amid reports the coronavirus outbreak could be contained by April, avoiding a potential economic fallout.
Eight of 11 S&P 500 sectors closed in positive territory, with Energy shares pacing gains amid a rebound in oil prices. WTI crude rose 0.8% to $49.94/barrel. The Communication Services group lagged, with Facebook (FB -2.76%) down following an analyst downgrade. The social media company was also pressured on news of an FTC investigation concerning past acquisitions of major U.S. Technology companies including Microsoft (MSFT -2.26%). In earnings, Under Armour (UA -16.69%) fell after providing disappointing forward guidance. In M&A news, T-Mobile (TMUS +11.78%) and Sprint (S +77.50%) rose after a federal judge approved a merger between the two wireless providers. Cell tower operators advanced on hopes the announcement would increase demand.
Market participants also tuned into the first day of Fed Chair Jerome Powell’s Congressional testimony. Powell noted that the central bank is monitoring the coronavirus outbreak and reiterated the U.S. economy remains in a good position. Treasuries weakened, with the yield on the 10-year note up four basis points to 1.60%.
On the data front, the NFIB revealed small business optimism improved more than anticipated in January. Separately, the Jobs Openings and Labor Turnover Survey (JOLTS) showed job openings unexpectedly declined to a two-year low in December. |
 Kenneth J. Gruneisen started out as a licensed stockbroker in August 1987, a couple of months prior to the historic stock market crash that took the Dow Jones Industrial Average down -22.6% in a single day. He has published daily fact-based fundamental and technical analysis on high-ranked stocks online for two decades. Through FACTBASEDINVESTING.COM, Kenneth provides educational articles, news, market commentary, and other information regarding proven investment systems that work in good times and bad.
Comments contained in the body of this report are technical opinions only and are not necessarily those of Gruneisen Growth Corp. The material herein has been obtained from sources believed to be reliable and accurate, however, its accuracy and completeness cannot be guaranteed. Our firm, employees, and customers may effect transactions, including transactions contrary to any recommendation herein, or have positions in the securities mentioned herein or options with respect thereto. Any recommendation contained in this report may not be suitable for all investors and it is not to be deemed an offer or solicitation on our part with respect to the purchase or sale of any securities. |
|
 |
Retail, Financial, Tech, and Energy-Linked Groups Rose
Kenneth J. Gruneisen - Passed the CAN SLIM® Master's Exam
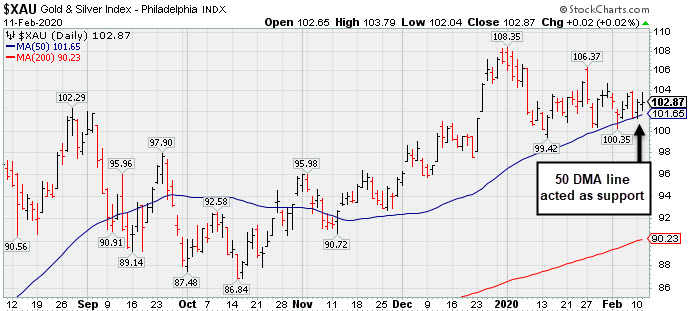
The Retail Index ($RLX +0.75%), Bank Index ($BKX +0.71%), and the Broker/Dealer Index ($XBD +1.66%) posted unanimous gains. The tech sector had a positive bias as the Biotech Index ($BTK +0.58%), Semiconductor Index ($SOX +2.02%), and the Networking Index ($NWX +1.10%) each rose. Energy-linked groups also posted gains as the Oil Services Index ($OSX +1.03%) and Integrated Oil Index ($XOI +1.19%) both rose. The Gold & Silver Index ($XAU +0.02%) was a laggard as it ended the session unchanged.
PICTURED: The Gold & Silver Index ($XAU +0.02%) recently found support above its 50-day moving average (DMA) line.
| Oil Services |
$OSX |
63.99 |
+0.65 |
+1.03% |
-18.27% |
| Integrated Oil |
$XOI |
1,120.84 |
+13.17 |
+1.19% |
-11.78% |
| Semiconductor |
$SOX |
1,931.08 |
+38.28 |
+2.02% |
+4.40% |
| Networking |
$NWX |
567.37 |
+6.18 |
+1.10% |
-2.75% |
| Broker/Dealer |
$XBD |
302.49 |
+4.93 |
+1.66% |
+4.17% |
| Retail |
$RLX |
2,651.82 |
+19.74 |
+0.75% |
+8.27% |
| Gold & Silver |
$XAU |
102.87 |
+0.02 |
+0.02% |
-3.79% |
| Bank |
$BKX |
109.36 |
+0.77 |
+0.71% |
-3.53% |
| Biotech |
$BTK |
5,198.99 |
+29.76 |
+0.58% |
+2.60% |
|
|
|
 |
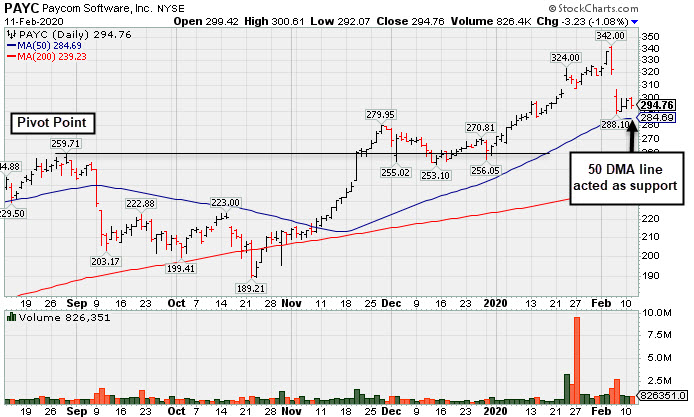
Pulled Back Near 50-Day Average Following Strong Earnings Report
Kenneth J. Gruneisen - Passed the CAN SLIM® Master's Exam
Paycom Software Inc (PAYC -$3.23 or -1.08% to $294.76) halted its slide after a "negative reversal" at its all-time high followed by a gap down. Fundamentals remain strong after its latest earnings report. Earnings rose +41% on +29% for the Dec '19 quarter versus the year ago period. It is very extended from any sound base. Its 50-day moving average (DMA) line ($284.69) and prior high ($279.95 on 11/27/19) define important near-term support levels to watch on pullbacks.
PAYC finished strong after highlighted in yellow with new pivot point cited based on its 8/29/19 high plus 10 cents in the 11/20/19 mid-day report (read here). The gain for a new high was backed by +167% above average volume and triggered a new technical buy signal. It was last shown in this FSU section on 1/23/20 under the headline, "Gapped Up for New High But Ended Near Session Low".
It has the highest possible Earnings Per Share Rating of 99, well above the 80+ minimum guideline for buy candidates. The 4 latest quarterly comparisons were above the +25% minimum earnings guideline (C criteria). Its annual earnings (A criteria) history has been strong and steady.
The Computer Software - Enterprise firm's current Up/Down Volume Ratio of 0.9 is an unbiased indication its shares have been under some distributional pressure over the past 50 days. Its small supply of only 58.4 million shares outstanding (S criteria) can contribute to greater price volatility in the event of institutional buying or selling. The number of top-rated funds owning its shares rose from 384 in Jun '17 to 931 in Dec '19, a reassuring sign concerning the I criteria. It has a Timeliness rating of A and Sponsorship rating of B. It completed Secondary Offerings on 11/13/15, 9/16/15, 5/15/15 and 1/14/15 since its $15 IPO on 4/15/14. |
|
|
Color Codes Explained :
Y - Better candidates highlighted by our
staff of experts.
G - Previously featured
in past reports as yellow but may no longer be buyable under the
guidelines.
***Last / Change / Volume data in this table is the closing quote data***
Symbol/Exchange
Company Name
Industry Group |
PRICE |
CHANGE
(%Change) |
Day High |
Volume
(% DAV)
(% 50 day avg vol) |
52 Wk Hi
% From Hi |
Featured
Date |
Price
Featured |
Pivot Featured |
|
Max Buy |
 FTNT
-
NASDAQ
FTNT
-
NASDAQ
Fortinet Inc
Computer Sftwr-Security
|
$117.32
|
-1.41
-1.19% |
$120.18
|
959,465
85.82% of 50 DAV
50 DAV is 1,118,000
|
$121.82
-3.69%
|
12/9/2019
|
$103.85
|
PP = $106.10
|
|
MB = $111.41
|
Most Recent Note - 2/7/2020 12:38:08 PM
G - Pulling back today with higher volume following earnings news. Reported earnings +29% on +21% sales revenues for the Dec '19 quarter, continuing its strong earnings track record above the +25% minimum guideline (C criteria). Its prior low ($112.06) and 50 DMA line ($111.28) define important near-term support to watch.
>>> FEATURED STOCK ARTICLE : Fortinet Posted Gain for Best-Ever Close - 2/4/2020 |
View all notes |
Set NEW NOTE alert |
Company Profile |
SEC
News |
Chart |
Request a new note
C
A
S
I |
SPSC
-
NASDAQ
S P S Commerce Inc
COMPUTER SOFTWARE and SERVICES - Application Software
|
$57.80
|
-1.17
-1.98% |
$59.62
|
111,741
65.16% of 50 DAV
50 DAV is 171,500
|
$59.98
-3.63%
|
11/29/2019
|
$56.59
|
PP = $59.24
|
|
MB = $62.20
|
Most Recent Note - 2/7/2020 5:04:10 PM
Y - Found support near its 50 DMA line ($56.88). Still perched near its all-time high. Subsequent gains above its pivot point backed by at least +40% above average volume are needed to trigger a new technical buy signal. Fundamentals remain strong. Its current Relative Strength Rating of 75 is below the 80+ minimum guideline for buy candidates.
>>> FEATURED STOCK ARTICLE : Perched Near High Finding Support at 50-Day Average - 2/3/2020 |
View all notes |
Set NEW NOTE alert |
Company Profile |
SEC
News |
Chart |
Request a new note
C
A
S
I |
AUDC
-
NASDAQ
Audiocodes Ltd
ELECTRONICS - Scientific and Technical Instrum
|
$22.79
|
+0.74
3.36% |
$23.02
|
371,769
109.34% of 50 DAV
50 DAV is 340,000
|
$28.73
-20.68%
|
9/13/2019
|
$19.68
|
PP = $19.84
|
|
MB = $20.83
|
Most Recent Note - 2/10/2020 6:28:15 PM
G - A rebound above its 50 DMA line ($25.00) is needed for its outlook to improve after damaging volume-driven losses triggered technical sell signals. Fundamentals remain strong after it reported earnings +30% on +15% sales revenues for the Dec '19 quarter.
>>> FEATURED STOCK ARTICLE : Showed Resilience With Close in Upper Third of Intra-day Range - 1/27/2020 |
View all notes |
Set NEW NOTE alert |
Company Profile |
SEC
News |
Chart |
Request a new note
C
A
S
I |
CHDN
-
NASDAQ
Churchill Downs Inc
LEISURE - Gaming Activities
|
$159.84
|
+1.87
1.18% |
$160.80
|
263,945
134.67% of 50 DAV
50 DAV is 196,000
|
$159.21
0.40%
|
10/8/2019
|
$129.77
|
PP = $132.83
|
|
MB = $139.47
|
Most Recent Note - 2/7/2020 5:05:37 PM
G - Stubbornly held its ground and hit yet another new 52-week high with today's gain on near average volume. Its 50 DMA line ($138) defines near-term support above the prior low ($132.55 on 1/03/19) The Jun and Sep '19 quarterly earnings versus the year ago periods were both below the +25% minimum guideline (C criteria) and raised fundamental concerns. See the latest FSU analysis for more details and a new annotated graph.
>>> FEATURED STOCK ARTICLE : Perched at New Record High After Recent Gains on Average Volume - 2/7/2020 |
View all notes |
Set NEW NOTE alert |
Company Profile |
SEC
News |
Chart |
Request a new note
C
A
S
I |
LULU
-
NASDAQ
Lululemon Athletica
MANUFACTURING - Textile Manufacturing
|
$251.58
|
+3.04
1.22% |
$252.39
|
1,005,443
53.23% of 50 DAV
50 DAV is 1,889,000
|
$250.10
0.59%
|
9/6/2019
|
$201.25
|
PP = $194.35
|
|
MB = $204.07
|
Most Recent Note - 2/10/2020 6:34:03 PM
G - Extended from any sound base and still hovering near its all-time high with volume totals cooling. Its 50 DMA line ($235) and prior low ($231.84 on 1/27/20) define important near-term support to watch. Fundamentals remain strong.
>>> FEATURED STOCK ARTICLE : Volume Totals Cooling While Hovering Near All-Time High - 1/30/2020 |
View all notes |
Set NEW NOTE alert |
Company Profile |
SEC
News |
Chart |
Request a new note
C
A
S
I |
Symbol/Exchange
Company Name
Industry Group |
PRICE |
CHANGE
(%Change) |
Day High |
Volume
(% DAV)
(% 50 day avg vol) |
52 Wk Hi
% From Hi |
Featured
Date |
Price
Featured |
Pivot Featured |
|
Max Buy |
CPRT
-
NASDAQ
Copart Inc
SPECIALTY RETAIL - Auto Dealerships
|
$102.31
|
-0.22
-0.21% |
$103.25
|
889,701
55.85% of 50 DAV
50 DAV is 1,593,000
|
$104.10
-1.72%
|
1/2/2020
|
$92.80
|
PP = $92.51
|
|
MB = $97.14
|
Most Recent Note - 2/7/2020 5:07:27 PM
G - Near its all-time high with volume totals cooling while stubbornly holding its ground, extended from any sound base. Its 50 DMA line ($94) defines near-term support above prior highs in the $91-92 area. Fundamentals remain strong.
>>> FEATURED STOCK ARTICLE : New High With Yet Another Gain Backed by Light Volume - 1/28/2020 |
View all notes |
Set NEW NOTE alert |
Company Profile |
SEC
News |
Chart |
Request a new note
C
A
S
I |
NMIH
-
NASDAQ
N M I Holdings Inc Cl A
Finance-MrtgandRel Svc
|
$35.57
|
+1.37
4.01% |
$35.66
|
1,025,925
211.10% of 50 DAV
50 DAV is 486,000
|
$35.79
-0.61%
|
2/6/2020
|
$33.53
|
PP = $35.89
|
|
MB = $37.68
|
 Most Recent Note - 2/11/2020 5:50:22 PM
Y - Reported earnings +63% on +38% sales revenues for the Dec '19 quarter. Volume and volatility often increase near earnings news. Today's 7th consecutive gain was backed by higher volume. New pivot point cited was based on its 12/19/19 high plus 10 cents. Subsequent volume-driven gains above the pivot point may trigger a new (or add-on) technical buy signal.
>>> FEATURED STOCK ARTICLE : Sputtering Below 50-Day Moving Average Line Hurts Outlook - 1/31/2020 |
View all notes |
Set NEW NOTE alert |
Company Profile |
SEC
News |
Chart |
Request a new note
C
A
S
I |
SPLK
-
NASDAQ
Splunk Inc
Computer Sftwr-Database
|
$168.10
|
+0.94
0.56% |
$171.17
|
1,600,531
102.40% of 50 DAV
50 DAV is 1,563,000
|
$170.74
-1.55%
|
11/25/2019
|
$147.79
|
PP = $142.16
|
|
MB = $149.27
|
Most Recent Note - 2/10/2020 6:29:56 PM
G - Posted a solid gain on light volume today for its second-best close. It is extended from the previously noted base. Its 50 DMA line ($153) and prior highs in the $142-143 area define important support to watch on pullbacks.
>>> FEATURED STOCK ARTICLE : Volume Totals Cooling While Hovering Near All-Time High - 1/29/2020 |
View all notes |
Set NEW NOTE alert |
Company Profile |
SEC
News |
Chart |
Request a new note
C
A
S
I |
PAYC
-
NYSE
Paycom Software Inc
COMPUTER SOFTWARE and SERVICES - Application Software
|
$294.76
|
-3.23
-1.08% |
$300.61
|
826,351
95.86% of 50 DAV
50 DAV is 862,000
|
$342.00
-13.81%
|
11/20/2019
|
$252.97
|
PP = $259.81
|
|
MB = $272.80
|
Most Recent Note - 2/11/2020 5:47:25 PM
G - Reported earnings +41% on +29% for the Dec '19 quarter. Very extended from any sound base. Halted its slide above its 50 DMA line ($284.69) and prior high ($279.95 on 11/27/19) after abruptly retreating from its high. More damaging losses would raise concerns and trigger a technical sell signal. See the latest FSU analysis for more details and a new annotated graph.
>>> FEATURED STOCK ARTICLE : Pulled Back Near 50-Day Average Following Strong Earnings Report - 2/11/2020 |
View all notes |
Set NEW NOTE alert |
Company Profile |
SEC
News |
Chart |
Request a new note
C
A
S
I |
BLD
-
NYSE
Topbuild Corp
Bldg-Constr Prds/Misc
|
$117.21
|
-1.86
-1.56% |
$120.62
|
213,074
76.65% of 50 DAV
50 DAV is 278,000
|
$120.06
-2.37%
|
12/9/2019
|
$109.71
|
PP = $113.84
|
|
MB = $119.53
|
Most Recent Note - 2/10/2020 12:32:40 PM
Y - Touched a new 52-week high and trading near its "max buy" level with today's 4th consecutive gain. Prior high ($113.74) defines near-term support above its 50 DMA line ($108.91). See the latest FSU analysis for more details and an annotated graph.
>>> FEATURED STOCK ARTICLE : Volume Totals Cooling While Consolidating Near All-Time High - 2/6/2020 |
View all notes |
Set NEW NOTE alert |
Company Profile |
SEC
News |
Chart |
Request a new note
C
A
S
I |
Symbol/Exchange
Company Name
Industry Group |
PRICE |
CHANGE
(%Change) |
Day High |
Volume
(% DAV)
(% 50 day avg vol) |
52 Wk Hi
% From Hi |
Featured
Date |
Price
Featured |
Pivot Featured |
|
Max Buy |
TEAM
-
NASDAQ
Atlassian Corp Plc Cl A
Comp Sftwr-Spec Enterprs
|
$149.00
|
-2.28
-1.51% |
$153.00
|
940,121
61.49% of 50 DAV
50 DAV is 1,529,000
|
$153.70
-3.06%
|
1/24/2020
|
$144.66
|
PP = $140.49
|
|
MB = $147.51
|
Most Recent Note - 2/10/2020 6:31:20 PM
G - Color code is changed to green after rising above its "max buy" level with today's 3rd consecutive gain. Rallied from a cup-with-handle base pattern with volume +514% above average behind the considerable gain on 1/24/20 triggering a technical buy signal. Bullish action came after it reported earnings +48% on +37% sales revenues for the Dec '19 quarter.
>>> FEATURED STOCK ARTICLE : Gapped Up Today Following Another Strong Earnings Report - 1/24/2020 |
View all notes |
Set NEW NOTE alert |
Company Profile |
SEC
News |
Chart |
Request a new note
C
A
S
I |
GLOB
-
NYSE
Globant SA
Computer-Tech Services
|
$122.55
|
-1.05
-0.85% |
$125.07
|
273,491
108.53% of 50 DAV
50 DAV is 252,000
|
$131.00
-6.45%
|
11/14/2019
|
$106.87
|
PP = $112.43
|
|
MB = $118.05
|
Most Recent Note - 2/10/2020 6:32:47 PM
G - Recent action has been indicative of distributional pressure after wedging to new highs with gains lacking great volume conviction. Its prior high ($112.33) and 50 DMA line ($112) define important near-term support to watch.
>>> FEATURED STOCK ARTICLE : Encountering Distributional Pressure After Wedging to New Highs - 2/5/2020 |
View all notes |
Set NEW NOTE alert |
Company Profile |
SEC
News |
Chart |
Request a new note
C
A
S
I |
STNE
-
NASDAQ
Stoneco Ltd Cl A
Finance-CrdtCard/PmtPr
|
$40.19
|
+0.14
0.35% |
$40.91
|
1,975,031
113.90% of 50 DAV
50 DAV is 1,734,000
|
$45.72
-12.10%
|
1/22/2020
|
$43.94
|
PP = $45.72
|
|
MB = $48.01
|
Most Recent Note - 2/10/2020 6:26:40 PM
G - Violated its 50 DMA line ($40.77) with a streak of 5 consecutive losses and its color code was changed to green. A subsequent rebound and gains above the pivot point backed by at least +40% above average volume are needed to trigger a technical buy signal. See the latest FSU analysis for more details and a new annotated graph.
>>> FEATURED STOCK ARTICLE : 50-Day Moving Average Line Violation Hurts Outlook - 2/10/2020 |
View all notes |
Set NEW NOTE alert |
Company Profile |
SEC
News |
Chart |
Request a new note
C
A
S
I |
|
|
|
THESE ARE NOT BUY RECOMMENDATIONS!
Comments contained in the body of this report are technical
opinions only. The material herein has been obtained
from sources believed to be reliable and accurate, however,
its accuracy and completeness cannot be guaranteed.
This site is not an investment advisor, hence it does
not endorse or recommend any securities or other investments.
Any recommendation contained in this report may not
be suitable for all investors and it is not to be deemed
an offer or solicitation on our part with respect to
the purchase or sale of any securities. All trademarks,
service marks and trade names appearing in this report
are the property of their respective owners, and are
likewise used for identification purposes only.
This report is a service available
only to active Paid Premium Members.
You may opt-out of receiving report notifications
at any time. Questions or comments may be submitted
by writing to Premium Membership Services 665 S.E. 10 Street, Suite 201 Deerfield Beach, FL 33441-5634 or by calling 1-800-965-8307
or 954-785-1121.
|
|
|