You are not logged in.
This means you
CAN ONLY VIEW reports that were published prior to Sunday, February 18, 2024.
You
MUST UPGRADE YOUR MEMBERSHIP if you want to see any current reports.
AFTER MARKET UPDATE - THURSDAY, FEBRUARY 10TH, 2022
Previous After Market Report Next After Market Report >>>
|
|
|
|
DOW |
-526.47 |
35,241.59 |
-1.47% |
|
Volume |
1,026,040,535 |
+14% |
|
Volume |
5,127,096,100 |
+10% |
|
NASDAQ |
-304.73 |
14,185.64 |
-2.10% |
|
Advancers |
810 |
25% |
|
Advancers |
1,460 |
33% |
|
S&P 500 |
-83.10 |
4,504.08 |
-1.81% |
|
Decliners |
2,435 |
75% |
|
Decliners |
2,963 |
67% |
|
Russell 2000 |
-32.34 |
2,051.16 |
-1.55% |
|
52 Wk Highs |
86 |
|
|
52 Wk Highs |
61 |
|
|
S&P 600 |
-18.32 |
1,304.02 |
-1.39% |
|
52 Wk Lows |
349 |
|
|
52 Wk Lows |
267 |
|
|
 |
Major Indices Fell, Encountering Distributional Pressure
Kenneth J. Gruneisen - Passed the CAN SLIM® Master's Exam
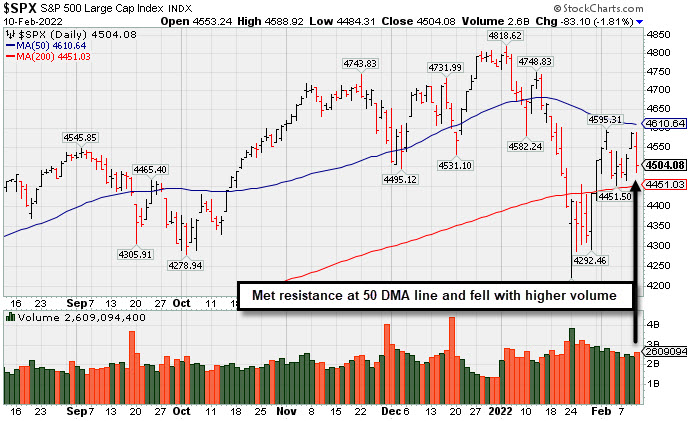
The Dow slid 526 points, while the S&P 500 lost 1.8%. The Nasdaq Composite slumped 2.1%, dipping back into correction territory (defined as a 10% drawdown from a recent high) as growth-oriented stocks came under pressure amid rising yields. Volume totals reported were higher than the prior session on the NYSE and on the Nasdaq exchange, indicative of an increase in institutional selling pressure. Breadth was clearly negative as decliners led advancers by a 3-1 margin on the NYSE and 2-1 on the Nasdaq exchange. There were 33 high-ranked companies from the Leaders List that hit new 52-week highs and were listed on the BreakOuts Page, versus 49 on the prior session. New 52-week lows solidly outnumbered new highs on the NYSE and on the Nasdaq exchange. A follow-through day on Monday, January 31st confirmed a new uptrend for the market averages (M criteria). PICTURED: The S&P 500 Index met resistance at its 50-day moving average (DMA) line and fell on Thursday with higher volume, indicative of an increase in selling from the institutional crowd.
U.S. stocks finished broadly lower on Thursday as another hotter-than-expected inflation reading further fueled expectations for aggressive monetary policy tightening from the Federal Reserve (Fed). Additionally, St. Louis Fed President James Bullard said he supported raising rates by a full percentage point by July, and noted he would consider an inter-meeting rate hike.
Treasuries resumed their rout, with the yield on the 10-year note jumping 10 basis points (0.10%) to 2.05%, its highest level since July 2019. The more Fed-sensitive two-year note yield spiked 25 basis points (0.25%) to 1.61%, notching a peak not seen since December 2019 on its biggest one-day jump since 2009. On the data front, the Consumer Price Index (CPI) rose 0.6% in January, topping estimates of a 0.4% gain. Headline CPI climbed 7.5% year-over-year, accelerating from the previous 7% reading and still the fastest pace since February 1982. Core CPI (excluding food and energy), increased at a 6% annual clip last month, the highest since August 1982.
All 11 S&P 500 sectors closed in negative territory, with eight groups falling more than 1%. Earnings were a bright spot, with Walt Disney Co. (DIS +3.35%%) as the number of new subscribers to its streaming service surprised on the upside, while revenue from its theme parks division rebounded. Software maker Twilio Inc. (TWLO +1.93%) after issuing forward guidance that surpassed analyst expectations. |
 Kenneth J. Gruneisen started out as a licensed stockbroker in August 1987, a couple of months prior to the historic stock market crash that took the Dow Jones Industrial Average down -22.6% in a single day. He has published daily fact-based fundamental and technical analysis on high-ranked stocks online for two decades. Through FACTBASEDINVESTING.COM, Kenneth provides educational articles, news, market commentary, and other information regarding proven investment systems that work in good times and bad.
Comments contained in the body of this report are technical opinions only and are not necessarily those of Gruneisen Growth Corp. The material herein has been obtained from sources believed to be reliable and accurate, however, its accuracy and completeness cannot be guaranteed. Our firm, employees, and customers may effect transactions, including transactions contrary to any recommendation herein, or have positions in the securities mentioned herein or options with respect thereto. Any recommendation contained in this report may not be suitable for all investors and it is not to be deemed an offer or solicitation on our part with respect to the purchase or sale of any securities. |
|
 |
Retail, Financial, Tech, and Commodity-Linked Groups Fell
Kenneth J. Gruneisen - Passed the CAN SLIM® Master's Exam
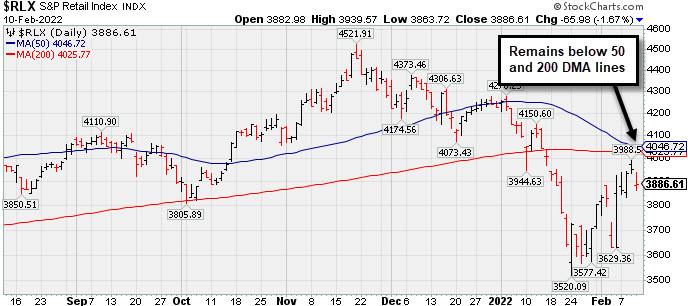
The Retail Index ($RLX -1.67%) and Broker/Dealer Index ($XBD -1.50%) both outpaced the Bank Index ($BKX -0.32%) to the downside. The Semiconductor Index ($SOX -3.22%), Biotech Index ($BTK -2.37%), and Networking Index ($NWX -2.03%) suffered unanimous losses. The Gold & Silver Index ($XAU -2.55%) also suffered a large loss while the Oil Services Index ($OSX -0.73%) and Integrated Oil Index ($XOI -0.24%) both edged lower. PICTURED: The Retail Index ($RLX -1.67%) remains below its 50-day and 200-day moving average (DMA) lines.
| Oil Services |
$OSX |
66.35 |
-0.49 |
-0.73% |
+25.86% |
| Integrated Oil |
$XOI |
1,446.85 |
-3.51 |
-0.24% |
+22.80% |
| Semiconductor |
$SOX |
3,536.10 |
-117.62 |
-3.22% |
-10.39% |
| Networking |
$NWX |
855.95 |
-17.73 |
-2.03% |
-11.86% |
| Broker/Dealer |
$XBD |
504.25 |
-7.66 |
-1.50% |
+3.57% |
| Retail |
$RLX |
3,886.61 |
-65.98 |
-1.67% |
-8.04% |
| Gold & Silver |
$XAU |
128.24 |
-3.36 |
-2.55% |
-3.18% |
| Bank |
$BKX |
143.44 |
-0.46 |
-0.32% |
+8.48% |
| Biotech |
$BTK |
5,143.89 |
-124.98 |
-2.37% |
-6.79% |
|
|
|
 |
Featured Stocks
Kenneth J. Gruneisen - Passed the CAN SLIM® Master's Exam
|
|
|
Color Codes Explained :
Y - Better candidates highlighted by our
staff of experts.
G - Previously featured
in past reports as yellow but may no longer be buyable under the
guidelines.
***Last / Change / Volume data in this table is the closing quote data***
Symbol/Exchange
Company Name
Industry Group |
PRICE |
CHANGE
(%Change) |
Day High |
Volume
(% DAV)
(% 50 day avg vol) |
52 Wk Hi
% From Hi |
Featured
Date |
Price
Featured |
Pivot Featured |
|
Max Buy |
 REGN
-
NASDAQ
REGN
-
NASDAQ
Regeneron Pharmaceutical
DRUGS - Biotechnology
|
$618.36
|
-1.41
-0.23% |
$624.55
|
745,468
93.42% of 50 DAV
50 DAV is 798,000
|
$686.62
-9.94%
|
12/13/2021
|
$647.95
|
PP = $686.72
|
|
MB = $721.06
|
 Most Recent Note - 2/10/2022 4:42:53 PM
G - Still meeting resistance near its 50 DMA line ($625.67). Gains above that important short-term average are needed for its outlook to improve. Reported Dec '21 quarterly earnings +149% on +104% sales revenues versus the year ago period. Recently holding its ground in a tight range above prior lows and above its 200 DMA line ($595) which define the important near-term support.
>>> FEATURED STOCK ARTICLE : Earnings News Due While Consolidating Above 200 DMA Line - 2/1/2022 |
View all notes |
Set NEW NOTE alert |
Company Profile |
SEC
News |
Chart |
Request a new note
C
A
S
I |
SF
-
NYSE
Stifel Financial Corp
FINANCIAL SERVICES - Investment Brokerage - Regiona
|
$80.15
|
-0.74
-0.91% |
$83.08
|
783,007
132.94% of 50 DAV
50 DAV is 589,000
|
$83.28
-3.76%
|
1/27/2022
|
$74.17
|
PP = $76.23
|
|
MB = $80.04
|
Most Recent Note - 2/10/2022 4:44:48 PM
G - Hovering near its 52-week high following volume-driven gains. Prior highs in the $76-78 area define initial support to watch on pullbacks after rallying from the previously noted "double bottom" base.
>>> FEATURED STOCK ARTICLE : Formed Double Bottom Base and Faces Little Resistance - 1/27/2022 |
View all notes |
Set NEW NOTE alert |
Company Profile |
SEC
News |
Chart |
Request a new note
C
A
S
I |
TGH
-
NYSE
Textainer Group Holdings
TRANSPORTATION - Logistics
|
$41.57
|
+0.91
2.24% |
$41.89
|
685,388
185.24% of 50 DAV
50 DAV is 370,000
|
$41.37
0.48%
|
1/31/2022
|
$36.68
|
PP = $41.34
|
|
MB = $43.41
|
Most Recent Note - 2/10/2022 4:48:03 PM
Y - Due to report Dec '21 quarterly results today after the close. Volume and volatility often increase near earnings news. Hit a new 52-week high, adding to recent volume-driven gains. The gain backed by +85% above average volume and strong close above the pivot point triggered a technical buy signal. Found support at its 50 DMA line ($36.51) while recently consolidating.
>>> FEATURED STOCK ARTICLE : Consolidating Above 50-Day Moving Average - 1/31/2022 |
View all notes |
Set NEW NOTE alert |
Company Profile |
SEC
News |
Chart |
Request a new note
C
A
S
I |
HWKN
-
NASDAQ
Hawkins Inc
CHEMICALS - Basic Chemicals
|
$39.65
|
-0.58
-1.44% |
$41.23
|
58,441
106.26% of 50 DAV
50 DAV is 55,000
|
$41.94
-5.46%
|
2/3/2022
|
$39.81
|
PP = $41.07
|
|
MB = $43.12
|
Most Recent Note - 2/10/2022 4:42:01 PM
Y - Pulled back today for a 2nd consecutive loss with near average volume. Solid volume-driven gain hitting a new all-time high on 2/08/22 clinched a technical buy signal. It was highlighted in yellow with pivot point cited based on its 1/04/22 high plus 10 cents in the 2/03/22 mid-day report following a gap up, rebounding above its 50 DMA line ($38.18).
>>> FEATURED STOCK ARTICLE : Bullish Action Followed Another Strong Quarterly Report - 2/3/2022 |
View all notes |
Set NEW NOTE alert |
Company Profile |
SEC
News |
Chart |
Request a new note
C
A
S
I |
|
|
|
THESE ARE NOT BUY RECOMMENDATIONS!
Comments contained in the body of this report are technical
opinions only. The material herein has been obtained
from sources believed to be reliable and accurate, however,
its accuracy and completeness cannot be guaranteed.
This site is not an investment advisor, hence it does
not endorse or recommend any securities or other investments.
Any recommendation contained in this report may not
be suitable for all investors and it is not to be deemed
an offer or solicitation on our part with respect to
the purchase or sale of any securities. All trademarks,
service marks and trade names appearing in this report
are the property of their respective owners, and are
likewise used for identification purposes only.
This report is a service available
only to active Paid Premium Members.
You may opt-out of receiving report notifications
at any time. Questions or comments may be submitted
by writing to Premium Membership Services 665 S.E. 10 Street, Suite 201 Deerfield Beach, FL 33441-5634 or by calling 1-800-965-8307
or 954-785-1121.
|
|
|