You are not logged in.
This means you
CAN ONLY VIEW reports that were published prior to Tuesday, February 20, 2024.
You
MUST UPGRADE YOUR MEMBERSHIP if you want to see any current reports.
AFTER MARKET UPDATE - MONDAY, FEBRUARY 10TH, 2020
Previous After Market Report Next After Market Report >>>
|
|
|
|
DOW |
+174.31 |
29,276.82 |
+0.60% |
|
Volume |
846,624,830 |
-2% |
|
Volume |
2,178,570,440 |
-2% |
|
NASDAQ |
+107.88 |
9,628.39 |
+1.13% |
|
Advancers |
1,685 |
59% |
|
Advancers |
1,946 |
61% |
|
S&P 500 |
+24.38 |
3,352.09 |
+0.73% |
|
Decliners |
1,184 |
41% |
|
Decliners |
1,249 |
39% |
|
Russell 2000 |
+10.89 |
1,667.67 |
+0.66% |
|
52 Wk Highs |
248 |
|
|
52 Wk Highs |
167 |
|
|
S&P 600 |
+3.55 |
1,005.60 |
+0.35% |
|
52 Wk Lows |
86 |
|
|
52 Wk Lows |
92 |
|
|
 |
Major Indices Rallied Again for New Record Highs
Kenneth J. Gruneisen - Passed the CAN SLIM® Master's Exam
The Dow rose 174 points. The S&P 500 gained 0.7%, while the Nasdaq Composite jumped 1.1%, with both benchmark indexes closing at a fresh record highs. Advancers led decliners by a 4-3 margin on the NYSE and 5-3 on the Nasdaq exchange. The reported volume totals were lighter than the prior session totals on the NYSE and on the Nasdaq exchange, revealing lackluster institutional buying demand. There were 57 high-ranked companies from the Leaders List that hit a new 52-week high and were listed on the BreakOuts Page, versus 35 on the prior session. New 52-week highs totals expanded and easily outnumbered new 52-week lows on the NYSE and on the Nasdaq exchange. The major indices' (M criteria) remain in a confirmed uptrend. Disciplined investors buy individual stocks on a case-by-case basis only if all key criteria are met. The Featured Stocks Page provides the most timely analysis on high-ranked leaders. Charts used courtesy of www.stockcharts.com
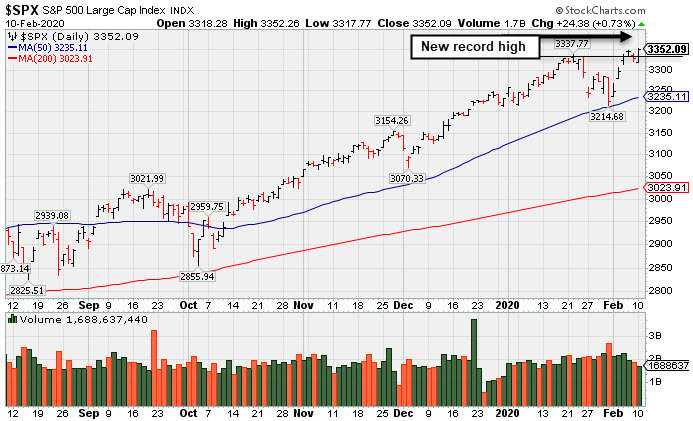
PICTURED: The S&P 500 Index posted a gain for a new record high.
Stocks advanced Monday as investors continued to assess the deadly coronavirus, which has now claimed more lives than the SARS outbreak from the 2000s. This follows last week’s rally in U.S. equities, in which the S&P 500 climbed 3.2%, its biggest weekly advance since last June.
Ten of 11 S&P 500 sectors finished in positive territory, with the Energy group the lone laggard. Technology shares paced the gains, with chipmaker NVIDIA (NVDA +4.52%) up ahead of its earnings report after market close Thursday. The Consumer Discretionary group also outperformed with Amazon (AMZN +2.63%) rallying up above the $2,100 mark for the first time. In earnings, Allergan (AGN +1.32%) up after the drug maker beat Wall Street estimates on the top and bottom line. Edgewell Personal Care (EPC +27.53%) rose after the maker of Schick razors nearly doubled consensus profit estimates. In M&A news, Taubman Centers (TCO +53.2) rose on news that Simon Property Group (SPG +1.45%) will acquire the company in an all-cash deal valued at $3.6 billion.
There were no notable economic updates today. Treasuries advanced with the yield on the 10-year note and two-year note both off two basis point to 1.56% and 1.38%, respectively. In commodities, WTI crude fell 1.4% to $49.62/barrel after capping a fifth consecutive weekly decline on Friday. COMEX gold gained 0.4% to $1,574.70/ounce. |
 Kenneth J. Gruneisen started out as a licensed stockbroker in August 1987, a couple of months prior to the historic stock market crash that took the Dow Jones Industrial Average down -22.6% in a single day. He has published daily fact-based fundamental and technical analysis on high-ranked stocks online for two decades. Through FACTBASEDINVESTING.COM, Kenneth provides educational articles, news, market commentary, and other information regarding proven investment systems that work in good times and bad.
Comments contained in the body of this report are technical opinions only and are not necessarily those of Gruneisen Growth Corp. The material herein has been obtained from sources believed to be reliable and accurate, however, its accuracy and completeness cannot be guaranteed. Our firm, employees, and customers may effect transactions, including transactions contrary to any recommendation herein, or have positions in the securities mentioned herein or options with respect thereto. Any recommendation contained in this report may not be suitable for all investors and it is not to be deemed an offer or solicitation on our part with respect to the purchase or sale of any securities. |
|
 |
Retail and Tech Groups Rose; Commodity-Linked Groups Fell
Kenneth J. Gruneisen - Passed the CAN SLIM® Master's Exam
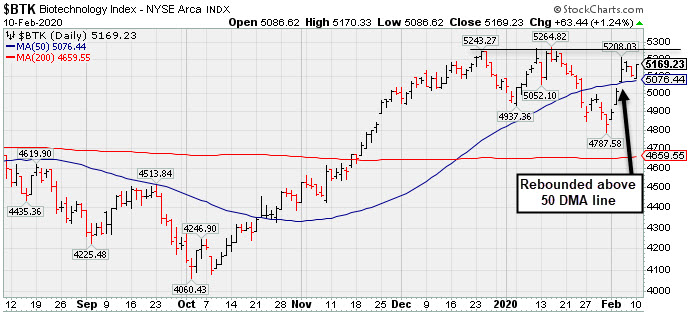
The Retail Index ($RLX +1.53%) was a standout gainer while the Bank Index ($BKX -0.08%) and the Broker/Dealer Index ($XBD +0.13%) both were little changed. The tech sector had a positive bias as the Biotech Index ($BTK +1.24%) and Semiconductor Index ($SOX +1.53%) both outpaced the Networking Index ($NWX +0.29%). Commodity-linked groups also had a negative bias as the Oil Services Index ($OSX -1.53%), Integrated Oil Index ($XOI -1.10%), and the Gold & Silver Index ($XAU -2.02%) each slumped.
PICTURED: The Biotech Index ($BTK +1.24%) recently rebounded above its 50-day moving average (DMA) line toward prior highs.
| Oil Services |
$OSX |
63.34 |
-1.14 |
-1.77% |
-19.10% |
| Integrated Oil |
$XOI |
1,107.67 |
-8.44 |
-0.76% |
-12.82% |
| Semiconductor |
$SOX |
1,892.80 |
+28.44 |
+1.53% |
+2.33% |
| Networking |
$NWX |
561.19 |
+1.64 |
+0.29% |
-3.81% |
| Broker/Dealer |
$XBD |
297.56 |
+0.38 |
+0.13% |
+2.47% |
| Retail |
$RLX |
2,632.08 |
+39.64 |
+1.53% |
+7.46% |
| Gold & Silver |
$XAU |
102.85 |
+1.52 |
+1.50% |
-3.81% |
| Bank |
$BKX |
108.59 |
-0.08 |
-0.07% |
-4.21% |
| Biotech |
$BTK |
5,169.23 |
+63.44 |
+1.24% |
+2.01% |
|
|
|
 |
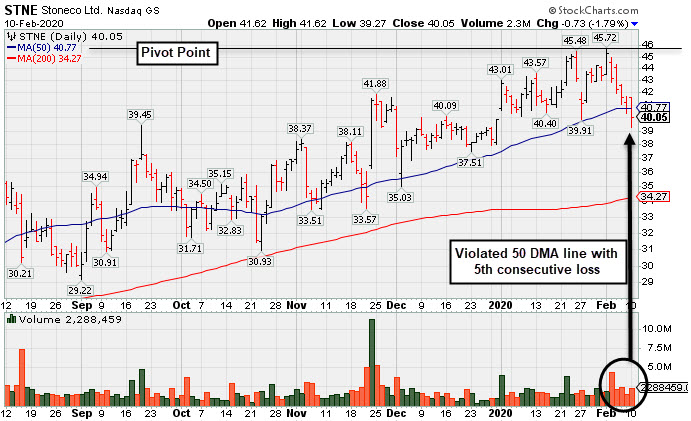
50-Day Moving Average Line Violation Hurts Outlook
Kenneth J. Gruneisen - Passed the CAN SLIM® Master's Exam
Stoneco Ltd Cl A (STNE -$0.73 or -1.79% to $40.05) after quietly touching a new all-time high last week it has pulled back below its 50-day moving average (DMA) line ($40.77) with a streak of 5 consecutive losses and its color code is changed to green. A prompt rebound above the 50 DMA line is needed for its outlook to improve. Subsequent gains above the pivot point backed by at least +40% above average volume are needed to trigger a technical buy signal. More damaging losses may raise concerns and trigger a worrisome technical sell signal.
STNE was highlighted in yellow with pivot point cited based on its 4/02/19 high plus 10 cents in the earlier mid-day report (read here). It faces little remaining resistance due to overhead supply. Subsequent gains above the pivot point backed by at least +40% above average volume are needed to trigger a proper technical buy signal.
This Brazil-based Finance - Credit Card/Payment Processing company was last shown in this FSU section on 1/22/20 with an annotated graph under the headline, "Perched Near High With Best-Ever Close After Volume-Driven Gain". It reported earnings +70% on +55% sales revenues for the Sep '19 quarter, and prior quarterly comparisons were strong. It has an 84 Earnings Per Share rating.
STNE completed a Secondary Offering on 4/03/18 and went through a deep consolidation Completed its $24 IPO on 10/25/18. The number of top-rated funds owning its shares rose from 175 in Mar '19 to 236 in Dec '19, a reassuring sign concerning the I criteria. Its current Up/Down Volume Ratio of 1.0 is an unbiased indication its shares have been neutral concerning accumulation/distribution over the past 50 days. It has a Timeliness Rating of A and Sponsorship Rating of A.
|
|
|
Color Codes Explained :
Y - Better candidates highlighted by our
staff of experts.
G - Previously featured
in past reports as yellow but may no longer be buyable under the
guidelines.
***Last / Change / Volume data in this table is the closing quote data***
Symbol/Exchange
Company Name
Industry Group |
PRICE |
CHANGE
(%Change) |
Day High |
Volume
(% DAV)
(% 50 day avg vol) |
52 Wk Hi
% From Hi |
Featured
Date |
Price
Featured |
Pivot Featured |
|
Max Buy |
 FTNT
-
NASDAQ
FTNT
-
NASDAQ
Fortinet Inc
Computer Sftwr-Security
|
$118.73
|
+1.62
1.38% |
$118.98
|
1,371,809
121.83% of 50 DAV
50 DAV is 1,126,000
|
$121.82
-2.54%
|
12/9/2019
|
$103.85
|
PP = $106.10
|
|
MB = $111.41
|
Most Recent Note - 2/7/2020 12:38:08 PM
G - Pulling back today with higher volume following earnings news. Reported earnings +29% on +21% sales revenues for the Dec '19 quarter, continuing its strong earnings track record above the +25% minimum guideline (C criteria). Its prior low ($112.06) and 50 DMA line ($111.28) define important near-term support to watch.
>>> FEATURED STOCK ARTICLE : Fortinet Posted Gain for Best-Ever Close - 2/4/2020 |
View all notes |
Set NEW NOTE alert |
Company Profile |
SEC
News |
Chart |
Request a new note
C
A
S
I |
SPSC
-
NASDAQ
S P S Commerce Inc
COMPUTER SOFTWARE and SERVICES - Application Software
|
$58.97
|
+0.91
1.57% |
$59.37
|
196,754
113.86% of 50 DAV
50 DAV is 172,800
|
$59.98
-1.68%
|
11/29/2019
|
$56.59
|
PP = $59.24
|
|
MB = $62.20
|
Most Recent Note - 2/7/2020 5:04:10 PM
Y - Found support near its 50 DMA line ($56.88). Still perched near its all-time high. Subsequent gains above its pivot point backed by at least +40% above average volume are needed to trigger a new technical buy signal. Fundamentals remain strong. Its current Relative Strength Rating of 75 is below the 80+ minimum guideline for buy candidates.
>>> FEATURED STOCK ARTICLE : Perched Near High Finding Support at 50-Day Average - 2/3/2020 |
View all notes |
Set NEW NOTE alert |
Company Profile |
SEC
News |
Chart |
Request a new note
C
A
S
I |
AUDC
-
NASDAQ
Audiocodes Ltd
ELECTRONICS - Scientific and Technical Instrum
|
$22.05
|
-0.60
-2.65% |
$22.47
|
306,859
90.79% of 50 DAV
50 DAV is 338,000
|
$28.73
-23.25%
|
9/13/2019
|
$19.68
|
PP = $19.84
|
|
MB = $20.83
|
 Most Recent Note - 2/10/2020 6:28:15 PM
G - A rebound above its 50 DMA line ($25.00) is needed for its outlook to improve after damaging volume-driven losses triggered technical sell signals. Fundamentals remain strong after it reported earnings +30% on +15% sales revenues for the Dec '19 quarter.
>>> FEATURED STOCK ARTICLE : Showed Resilience With Close in Upper Third of Intra-day Range - 1/27/2020 |
View all notes |
Set NEW NOTE alert |
Company Profile |
SEC
News |
Chart |
Request a new note
C
A
S
I |
CHDN
-
NASDAQ
Churchill Downs Inc
LEISURE - Gaming Activities
|
$157.97
|
+3.22
2.08% |
$159.21
|
239,388
119.10% of 50 DAV
50 DAV is 201,000
|
$154.84
2.02%
|
10/8/2019
|
$129.77
|
PP = $132.83
|
|
MB = $139.47
|
Most Recent Note - 2/7/2020 5:05:37 PM
G - Stubbornly held its ground and hit yet another new 52-week high with today's gain on near average volume. Its 50 DMA line ($138) defines near-term support above the prior low ($132.55 on 1/03/19) The Jun and Sep '19 quarterly earnings versus the year ago periods were both below the +25% minimum guideline (C criteria) and raised fundamental concerns. See the latest FSU analysis for more details and a new annotated graph.
>>> FEATURED STOCK ARTICLE : Perched at New Record High After Recent Gains on Average Volume - 2/7/2020 |
View all notes |
Set NEW NOTE alert |
Company Profile |
SEC
News |
Chart |
Request a new note
C
A
S
I |
LULU
-
NASDAQ
Lululemon Athletica
MANUFACTURING - Textile Manufacturing
|
$248.54
|
+5.03
2.07% |
$249.74
|
1,161,947
61.28% of 50 DAV
50 DAV is 1,896,000
|
$250.10
-0.62%
|
9/6/2019
|
$201.25
|
PP = $194.35
|
|
MB = $204.07
|
Most Recent Note - 2/10/2020 6:34:03 PM
G - Extended from any sound base and still hovering near its all-time high with volume totals cooling. Its 50 DMA line ($235) and prior low ($231.84 on 1/27/20) define important near-term support to watch. Fundamentals remain strong.
>>> FEATURED STOCK ARTICLE : Volume Totals Cooling While Hovering Near All-Time High - 1/30/2020 |
View all notes |
Set NEW NOTE alert |
Company Profile |
SEC
News |
Chart |
Request a new note
C
A
S
I |
Symbol/Exchange
Company Name
Industry Group |
PRICE |
CHANGE
(%Change) |
Day High |
Volume
(% DAV)
(% 50 day avg vol) |
52 Wk Hi
% From Hi |
Featured
Date |
Price
Featured |
Pivot Featured |
|
Max Buy |
CPRT
-
NASDAQ
Copart Inc
SPECIALTY RETAIL - Auto Dealerships
|
$102.53
|
-0.05
-0.05% |
$103.86
|
2,045,329
128.15% of 50 DAV
50 DAV is 1,596,000
|
$104.10
-1.51%
|
1/2/2020
|
$92.80
|
PP = $92.51
|
|
MB = $97.14
|
Most Recent Note - 2/7/2020 5:07:27 PM
G - Near its all-time high with volume totals cooling while stubbornly holding its ground, extended from any sound base. Its 50 DMA line ($94) defines near-term support above prior highs in the $91-92 area. Fundamentals remain strong.
>>> FEATURED STOCK ARTICLE : New High With Yet Another Gain Backed by Light Volume - 1/28/2020 |
View all notes |
Set NEW NOTE alert |
Company Profile |
SEC
News |
Chart |
Request a new note
C
A
S
I |
NMIH
-
NASDAQ
N M I Holdings Inc Cl A
Finance-MrtgandRel Svc
|
$34.20
|
+0.40
1.18% |
$34.27
|
454,768
93.77% of 50 DAV
50 DAV is 485,000
|
$35.79
-4.44%
|
2/6/2020
|
$33.53
|
PP = $35.89
|
|
MB = $37.68
|
Most Recent Note - 2/6/2020 5:49:55 PM
Y - Color code is changed to yellow while consolidating above its 50 DMA line ($33.08). New pivot point cited is based on its 12/19/19 high plus 10 cents. Subsequent volume-driven gains above the pivot point may trigger a new (or add-on) technical buy signal. Tested prior highs in the $31 area. Due to report earnings news on 2/11/20. Volume and volatility often increase near earnings news.
>>> FEATURED STOCK ARTICLE : Sputtering Below 50-Day Moving Average Line Hurts Outlook - 1/31/2020 |
View all notes |
Set NEW NOTE alert |
Company Profile |
SEC
News |
Chart |
Request a new note
C
A
S
I |
SPLK
-
NASDAQ
Splunk Inc
Computer Sftwr-Database
|
$167.16
|
+4.61
2.84% |
$167.76
|
1,140,091
71.03% of 50 DAV
50 DAV is 1,605,000
|
$170.74
-2.10%
|
11/25/2019
|
$147.79
|
PP = $142.16
|
|
MB = $149.27
|
Most Recent Note - 2/10/2020 6:29:56 PM
G - Posted a solid gain on light volume today for its second-best close. It is extended from the previously noted base. Its 50 DMA line ($153) and prior highs in the $142-143 area define important support to watch on pullbacks.
>>> FEATURED STOCK ARTICLE : Volume Totals Cooling While Hovering Near All-Time High - 1/29/2020 |
View all notes |
Set NEW NOTE alert |
Company Profile |
SEC
News |
Chart |
Request a new note
C
A
S
I |
PAYC
-
NYSE
Paycom Software Inc
COMPUTER SOFTWARE and SERVICES - Application Software
|
$297.99
|
+4.46
1.52% |
$300.00
|
815,683
94.41% of 50 DAV
50 DAV is 864,000
|
$342.00
-12.87%
|
11/20/2019
|
$252.97
|
PP = $259.81
|
|
MB = $272.80
|
Most Recent Note - 2/6/2020 12:46:09 PM
G - Gapped down today after a "negative reversal" on the prior session at its all-time high. Reported earnings +41% on +29% for the Dec '19 quarter. It is very extended from any sound base. Its 50 DMA line ($283) and prior high ($279.95 on 11/27/19) define important near-term support levels to watch on pullbacks. Fundamentals remain strong.
>>> FEATURED STOCK ARTICLE : Gapped Up for New High But Ended Near Session Low - 1/23/2020 |
View all notes |
Set NEW NOTE alert |
Company Profile |
SEC
News |
Chart |
Request a new note
C
A
S
I |
BLD
-
NYSE
Topbuild Corp
Bldg-Constr Prds/Misc
|
$119.07
|
+3.17
2.74% |
$120.06
|
397,080
143.87% of 50 DAV
50 DAV is 276,000
|
$119.99
-0.77%
|
12/9/2019
|
$109.71
|
PP = $113.84
|
|
MB = $119.53
|
Most Recent Note - 2/10/2020 12:32:40 PM
Y - Touched a new 52-week high and trading near its "max buy" level with today's 4th consecutive gain. Prior high ($113.74) defines near-term support above its 50 DMA line ($108.91). See the latest FSU analysis for more details and an annotated graph.
>>> FEATURED STOCK ARTICLE : Volume Totals Cooling While Consolidating Near All-Time High - 2/6/2020 |
View all notes |
Set NEW NOTE alert |
Company Profile |
SEC
News |
Chart |
Request a new note
C
A
S
I |
Symbol/Exchange
Company Name
Industry Group |
PRICE |
CHANGE
(%Change) |
Day High |
Volume
(% DAV)
(% 50 day avg vol) |
52 Wk Hi
% From Hi |
Featured
Date |
Price
Featured |
Pivot Featured |
|
Max Buy |
TEAM
-
NASDAQ
Atlassian Corp Plc Cl A
Comp Sftwr-Spec Enterprs
|
$151.28
|
+3.28
2.22% |
$152.38
|
1,403,344
91.84% of 50 DAV
50 DAV is 1,528,000
|
$153.70
-1.57%
|
1/24/2020
|
$144.66
|
PP = $140.49
|
|
MB = $147.51
|
Most Recent Note - 2/10/2020 6:31:20 PM
G - Color code is changed to green after rising above its "max buy" level with today's 3rd consecutive gain. Rallied from a cup-with-handle base pattern with volume +514% above average behind the considerable gain on 1/24/20 triggering a technical buy signal. Bullish action came after it reported earnings +48% on +37% sales revenues for the Dec '19 quarter.
>>> FEATURED STOCK ARTICLE : Gapped Up Today Following Another Strong Earnings Report - 1/24/2020 |
View all notes |
Set NEW NOTE alert |
Company Profile |
SEC
News |
Chart |
Request a new note
C
A
S
I |
GLOB
-
NYSE
Globant SA
Computer-Tech Services
|
$123.60
|
+2.04
1.68% |
$124.99
|
277,314
105.85% of 50 DAV
50 DAV is 262,000
|
$131.00
-5.65%
|
11/14/2019
|
$106.87
|
PP = $112.43
|
|
MB = $118.05
|
Most Recent Note - 2/10/2020 6:32:47 PM
G - Recent action has been indicative of distributional pressure after wedging to new highs with gains lacking great volume conviction. Its prior high ($112.33) and 50 DMA line ($112) define important near-term support to watch.
>>> FEATURED STOCK ARTICLE : Encountering Distributional Pressure After Wedging to New Highs - 2/5/2020 |
View all notes |
Set NEW NOTE alert |
Company Profile |
SEC
News |
Chart |
Request a new note
C
A
S
I |
STNE
-
NASDAQ
Stoneco Ltd Cl A
Finance-CrdtCard/PmtPr
|
$40.05
|
-0.73
-1.79% |
$41.62
|
2,288,029
131.42% of 50 DAV
50 DAV is 1,741,000
|
$45.72
-12.40%
|
1/22/2020
|
$43.94
|
PP = $45.72
|
|
MB = $48.01
|
Most Recent Note - 2/10/2020 6:26:40 PM
G - Violated its 50 DMA line ($40.77) with a streak of 5 consecutive losses and its color code was changed to green. A subsequent rebound and gains above the pivot point backed by at least +40% above average volume are needed to trigger a technical buy signal. See the latest FSU analysis for more details and a new annotated graph.
>>> FEATURED STOCK ARTICLE : 50-Day Moving Average Line Violation Hurts Outlook - 2/10/2020 |
View all notes |
Set NEW NOTE alert |
Company Profile |
SEC
News |
Chart |
Request a new note
C
A
S
I |
|
|
|
THESE ARE NOT BUY RECOMMENDATIONS!
Comments contained in the body of this report are technical
opinions only. The material herein has been obtained
from sources believed to be reliable and accurate, however,
its accuracy and completeness cannot be guaranteed.
This site is not an investment advisor, hence it does
not endorse or recommend any securities or other investments.
Any recommendation contained in this report may not
be suitable for all investors and it is not to be deemed
an offer or solicitation on our part with respect to
the purchase or sale of any securities. All trademarks,
service marks and trade names appearing in this report
are the property of their respective owners, and are
likewise used for identification purposes only.
This report is a service available
only to active Paid Premium Members.
You may opt-out of receiving report notifications
at any time. Questions or comments may be submitted
by writing to Premium Membership Services 665 S.E. 10 Street, Suite 201 Deerfield Beach, FL 33441-5634 or by calling 1-800-965-8307
or 954-785-1121.
|
|
|