You are not logged in.
This means you
CAN ONLY VIEW reports that were published prior to Saturday, February 24, 2024.
You
MUST UPGRADE YOUR MEMBERSHIP if you want to see any current reports.
AFTER MARKET UPDATE - FRIDAY, FEBRUARY 7TH, 2020
Previous After Market Report Next After Market Report >>>
|
|
|
|
DOW |
-277.26 |
29,102.51 |
-0.94% |
|
Volume |
859,879,030 |
-9% |
|
Volume |
2,231,353,850 |
-2% |
|
NASDAQ |
-51.64 |
9,520.51 |
-0.54% |
|
Advancers |
1,009 |
36% |
|
Advancers |
981 |
31% |
|
S&P 500 |
-18.07 |
3,327.71 |
-0.54% |
|
Decliners |
1,829 |
64% |
|
Decliners |
2,202 |
69% |
|
Russell 2000 |
-20.68 |
1,656.78 |
-1.23% |
|
52 Wk Highs |
241 |
|
|
52 Wk Highs |
109 |
|
|
S&P 600 |
-14.61 |
1,002.05 |
-1.44% |
|
52 Wk Lows |
64 |
|
|
52 Wk Lows |
80 |
|
|
 |
Major Indices Pulled Back Yet Tallied Solid Weekly Gains
Kenneth J. Gruneisen - Passed the CAN SLIM® Master's Exam
The Dow lost 277 points, but finished the week 3.0% higher. The S&P 500 slipped 0.5% on the day, while adding 3.2% for its largest weekly advance since June. The Nasdaq Composite fell 0.5%, but added 4.0% for the week. Decliners led advancers by a 9-5 margin on the NYSE and 11-5 on the Nasdaq exchange. The reported volume totals were lighter than the prior session totals on the NYSE and on the Nasdaq exchange. There were 35 high-ranked companies from the Leaders List that hit a new 52-week high and were listed on the BreakOuts Page. New 52-week highs totals contracted yet still easily outnumbered new 52-week lows on the NYSE and on the Nasdaq exchange. The major indices' (M criteria) remain in a confirmed uptrend. Disciplined investors buy individual stocks on a case-by-case basis only if all key criteria are met. The Featured Stocks Page provides the most timely analysis on high-ranked leaders. Charts used courtesy of www.stockcharts.com
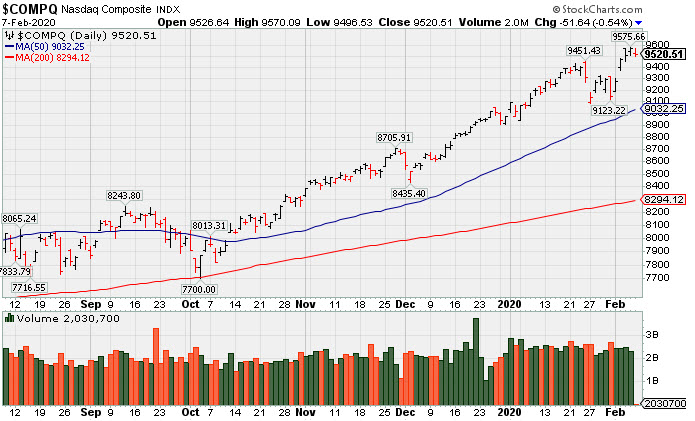
PICTURED: The Nasdaq Composite paused after 4 consecutive gains for new record highs.
Stocks ended the session lower Friday snapping a four day winning streak as investors weighed upbeat economic data against the impact of coronavirus on the Chinese economy. China’s National Health Commission reported that the number of confirmed cases have jumped above 30,000 within the country, showing little evidence of slowing down.
On the data front, non-farm payrolls increased by 225,000 in January easily surpassing expectations of 165,000 and the prior months upwardly revised 147,000 reading. The unemployment rate unexpectedly inched up from 3.5% to 3.6%. Meanwhile, average hourly earnings grew at a 3.1% annualized clip in January, up from 2.9% in December. An additional update revealed wholesale inventories declined more than expected in December. Treasuries advanced with the yield on the benchmark 10-year note ticking down six basis points to 1.58%. In commodities, crude oil declined 1.3% to $50.31/barrel, while copper lost 1.7%.
Eight of 11 S&P 500 sectors finished in negative territory with the defensive Real Estate and Consumer Staples stocks bucking the broader downtrend. In earnings news, AbbVie (ABBV +5.86%) after the drug maker topped consensus earnings estimates. Shares of Pinterest (PINS +9.52%) rose after the online scrap booking site bested analyst revenue projections. Elsewhere, Uber (UBER +9.54%) recorded its largest one-day gain after reporting better than expected growth. |
 Kenneth J. Gruneisen started out as a licensed stockbroker in August 1987, a couple of months prior to the historic stock market crash that took the Dow Jones Industrial Average down -22.6% in a single day. He has published daily fact-based fundamental and technical analysis on high-ranked stocks online for two decades. Through FACTBASEDINVESTING.COM, Kenneth provides educational articles, news, market commentary, and other information regarding proven investment systems that work in good times and bad.
Comments contained in the body of this report are technical opinions only and are not necessarily those of Gruneisen Growth Corp. The material herein has been obtained from sources believed to be reliable and accurate, however, its accuracy and completeness cannot be guaranteed. Our firm, employees, and customers may effect transactions, including transactions contrary to any recommendation herein, or have positions in the securities mentioned herein or options with respect thereto. Any recommendation contained in this report may not be suitable for all investors and it is not to be deemed an offer or solicitation on our part with respect to the purchase or sale of any securities. |
|
 |
Financial, Tech, and Commodity-Linked Groups Fell
Kenneth J. Gruneisen - Passed the CAN SLIM® Master's Exam
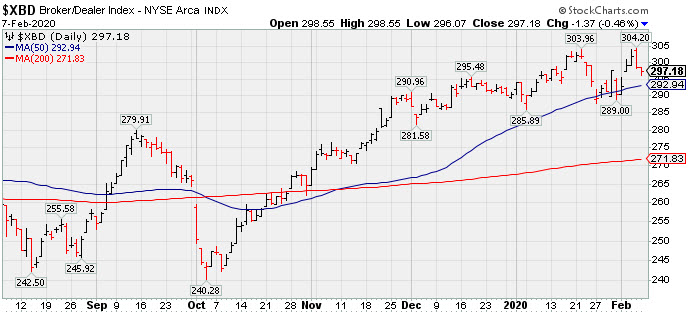
Again, like Thursday, the Bank Index ($BKX -0.60%) and the Broker/Dealer Index ($XBD -0.46%) both lost ground while the Retail Index ($RLX +0.20%) eked out a small gain. The tech sector had a negative bias as the Biotech Index ($BTK -1.00%), Semiconductor Index ($SOX -2.37%), and the Networking Index ($NWX -1.89%) ended unanimously in the red. Commodity-linked groups also had a negative bias as the Oil Services Index ($OSX -1.53%), Integrated Oil Index ($XOI -1.10%), and the Gold & Silver Index ($XAU -2.02%) each slumped.
PICTURED: The Broker/Dealer Index ($XBD -0.46%) recently found prompt support at its 50-day moving average (DMA) line.
| Oil Services |
$OSX |
64.48 |
-1.00 |
-1.53% |
-17.64% |
| Integrated Oil |
$XOI |
1,116.12 |
-12.45 |
-1.10% |
-12.15% |
| Semiconductor |
$SOX |
1,864.36 |
-45.28 |
-2.37% |
+0.80% |
| Networking |
$NWX |
559.55 |
-10.79 |
-1.89% |
-4.09% |
| Broker/Dealer |
$XBD |
297.18 |
-1.37 |
-0.46% |
+2.34% |
| Retail |
$RLX |
2,592.44 |
+5.13 |
+0.20% |
+5.85% |
| Gold & Silver |
$XAU |
101.33 |
-2.09 |
-2.02% |
-5.23% |
| Bank |
$BKX |
108.67 |
-0.66 |
-0.60% |
-4.14% |
| Biotech |
$BTK |
5,105.78 |
-51.66 |
-1.00% |
+0.76% |
|
|
|
 |
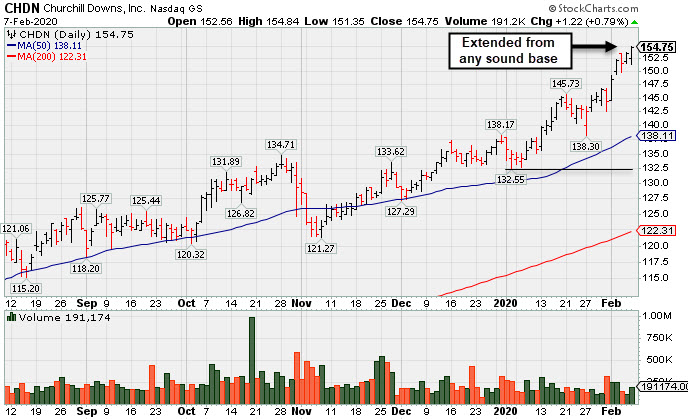
Perched at New Record High After Recent Gains on Average Volume
Kenneth J. Gruneisen - Passed the CAN SLIM® Master's Exam
Churchill Downs Inc (CHDN +$1.22 or +0.79% to $154.75) has stubbornly held its ground and hit yet another new 52-week high with today's big gain on near average volume. Its 50-day moving average (DMA) line ($138) defines near-term support above the recent low ($132.55 on 1/03/19). Bullish action has continued even after the Jun and Sep '19 quarterly earnings versus the year ago periods were both below the +25% minimum guideline (C criteria) and raised fundamental concerns.
Fundamental concerns have been noted, yet it still has an Earnings Per Share Rating of 87. Annual earnings (A criteria) growth has been strong since a downturn in FY '14.
The L criteria of the fact-based investment system guides investors toward buying leading stocks that are in leading industry groups. The Leisure - Gaming/Equipment industry group has a Group Relative Strength Rating of A+.
The number of top-rated funds owning its shares rose from 333 in Jun '17 to 486 in Dec '19, a reassuring sign concerning the I criteria. Its current Up/Down Volume Ratio of 1.1 is an unbiased indication its shares have been under slight accumulation over the past 50 days. It has a small supply of 39.8 million shares (S criteria) outstanding following a 3:1 split effective 1/28/19, and this small supply can contribute to greater price volatility in the event of institutional buying or selling.
|
|
|
Color Codes Explained :
Y - Better candidates highlighted by our
staff of experts.
G - Previously featured
in past reports as yellow but may no longer be buyable under the
guidelines.
***Last / Change / Volume data in this table is the closing quote data***
Symbol/Exchange
Company Name
Industry Group |
PRICE |
CHANGE
(%Change) |
Day High |
Volume
(% DAV)
(% 50 day avg vol) |
52 Wk Hi
% From Hi |
Featured
Date |
Price
Featured |
Pivot Featured |
|
Max Buy |
 FTNT
-
NASDAQ
FTNT
-
NASDAQ
Fortinet Inc
Computer Sftwr-Security
|
$117.11
|
-4.22
-3.48% |
$119.94
|
2,119,466
192.15% of 50 DAV
50 DAV is 1,103,000
|
$121.82
-3.87%
|
12/9/2019
|
$103.85
|
PP = $106.10
|
|
MB = $111.41
|
 Most Recent Note - 2/7/2020 12:38:08 PM
G - Pulling back today with higher volume following earnings news. Reported earnings +29% on +21% sales revenues for the Dec '19 quarter, continuing its strong earnings track record above the +25% minimum guideline (C criteria). Its prior low ($112.06) and 50 DMA line ($111.28) define important near-term support to watch.
>>> FEATURED STOCK ARTICLE : Fortinet Posted Gain for Best-Ever Close - 2/4/2020 |
View all notes |
Set NEW NOTE alert |
Company Profile |
SEC
News |
Chart |
Request a new note
C
A
S
I |
SPSC
-
NASDAQ
S P S Commerce Inc
COMPUTER SOFTWARE and SERVICES - Application Software
|
$58.06
|
-0.90
-1.53% |
$59.28
|
101,636
58.38% of 50 DAV
50 DAV is 174,100
|
$59.98
-3.20%
|
11/29/2019
|
$56.59
|
PP = $59.24
|
|
MB = $62.20
|
Most Recent Note - 2/7/2020 5:04:10 PM
Y - Found support near its 50 DMA line ($56.88). Still perched near its all-time high. Subsequent gains above its pivot point backed by at least +40% above average volume are needed to trigger a new technical buy signal. Fundamentals remain strong. Its current Relative Strength Rating of 75 is below the 80+ minimum guideline for buy candidates.
>>> FEATURED STOCK ARTICLE : Perched Near High Finding Support at 50-Day Average - 2/3/2020 |
View all notes |
Set NEW NOTE alert |
Company Profile |
SEC
News |
Chart |
Request a new note
C
A
S
I |
AUDC
-
NASDAQ
Audiocodes Ltd
ELECTRONICS - Scientific and Technical Instrum
|
$22.65
|
-0.04
-0.18% |
$22.69
|
259,670
76.37% of 50 DAV
50 DAV is 340,000
|
$28.73
-21.16%
|
9/13/2019
|
$19.68
|
PP = $19.84
|
|
MB = $20.83
|
Most Recent Note - 2/5/2020 6:03:34 PM
G - Posted a 2nd consecutive volume-driven gain. A subsequent rebound above its 50 DMA line ($25.00) is needed for its outlook to improve after damaging volume-driven losses last week triggered technical sell signals. Fundamentals remain strong after it reported earnings +30% on +15% sales revenues for the Dec '19 quarter.
>>> FEATURED STOCK ARTICLE : Showed Resilience With Close in Upper Third of Intra-day Range - 1/27/2020 |
View all notes |
Set NEW NOTE alert |
Company Profile |
SEC
News |
Chart |
Request a new note
C
A
S
I |
CHDN
-
NASDAQ
Churchill Downs Inc
LEISURE - Gaming Activities
|
$154.75
|
+1.22
0.79% |
$154.84
|
191,174
91.91% of 50 DAV
50 DAV is 208,000
|
$153.84
0.59%
|
10/8/2019
|
$129.77
|
PP = $132.83
|
|
MB = $139.47
|
Most Recent Note - 2/7/2020 5:05:37 PM
G - Stubbornly held its ground and hit yet another new 52-week high with today's gain on near average volume. Its 50 DMA line ($138) defines near-term support above the prior low ($132.55 on 1/03/19) The Jun and Sep '19 quarterly earnings versus the year ago periods were both below the +25% minimum guideline (C criteria) and raised fundamental concerns. See the latest FSU analysis for more details and a new annotated graph.
>>> FEATURED STOCK ARTICLE : Perched at New Record High After Recent Gains on Average Volume - 2/7/2020 |
View all notes |
Set NEW NOTE alert |
Company Profile |
SEC
News |
Chart |
Request a new note
C
A
S
I |
LULU
-
NASDAQ
Lululemon Athletica
MANUFACTURING - Textile Manufacturing
|
$243.51
|
-0.27
-0.11% |
$246.89
|
1,084,573
56.78% of 50 DAV
50 DAV is 1,910,000
|
$250.10
-2.63%
|
9/6/2019
|
$201.25
|
PP = $194.35
|
|
MB = $204.07
|
Most Recent Note - 2/5/2020 6:04:36 PM
G - Extended from any sound base and hovering near its all-time high with volume totals cooling. Its 50 DMA line ($233) and prior low ($218.18 on 12/12/19) define important near-term support to watch. Fundamentals remain strong.
>>> FEATURED STOCK ARTICLE : Volume Totals Cooling While Hovering Near All-Time High - 1/30/2020 |
View all notes |
Set NEW NOTE alert |
Company Profile |
SEC
News |
Chart |
Request a new note
C
A
S
I |
Symbol/Exchange
Company Name
Industry Group |
PRICE |
CHANGE
(%Change) |
Day High |
Volume
(% DAV)
(% 50 day avg vol) |
52 Wk Hi
% From Hi |
Featured
Date |
Price
Featured |
Pivot Featured |
|
Max Buy |
CPRT
-
NASDAQ
Copart Inc
SPECIALTY RETAIL - Auto Dealerships
|
$102.58
|
-0.37
-0.36% |
$103.65
|
972,756
59.53% of 50 DAV
50 DAV is 1,634,000
|
$104.10
-1.46%
|
1/2/2020
|
$92.80
|
PP = $92.51
|
|
MB = $97.14
|
Most Recent Note - 2/7/2020 5:07:27 PM
G - Near its all-time high with volume totals cooling while stubbornly holding its ground, extended from any sound base. Its 50 DMA line ($94) defines near-term support above prior highs in the $91-92 area. Fundamentals remain strong.
>>> FEATURED STOCK ARTICLE : New High With Yet Another Gain Backed by Light Volume - 1/28/2020 |
View all notes |
Set NEW NOTE alert |
Company Profile |
SEC
News |
Chart |
Request a new note
C
A
S
I |
NMIH
-
NASDAQ
N M I Holdings Inc Cl A
Finance-MrtgandRel Svc
|
$33.80
|
+0.27
0.81% |
$33.86
|
320,814
66.01% of 50 DAV
50 DAV is 486,000
|
$35.79
-5.56%
|
2/6/2020
|
$33.53
|
PP = $35.89
|
|
MB = $37.68
|
Most Recent Note - 2/6/2020 5:49:55 PM
Y - Color code is changed to yellow while consolidating above its 50 DMA line ($33.08). New pivot point cited is based on its 12/19/19 high plus 10 cents. Subsequent volume-driven gains above the pivot point may trigger a new (or add-on) technical buy signal. Tested prior highs in the $31 area. Due to report earnings news on 2/11/20. Volume and volatility often increase near earnings news.
>>> FEATURED STOCK ARTICLE : Sputtering Below 50-Day Moving Average Line Hurts Outlook - 1/31/2020 |
View all notes |
Set NEW NOTE alert |
Company Profile |
SEC
News |
Chart |
Request a new note
C
A
S
I |
SPLK
-
NASDAQ
Splunk Inc
Computer Sftwr-Database
|
$162.55
|
-0.12
-0.07% |
$165.44
|
967,454
56.54% of 50 DAV
50 DAV is 1,711,000
|
$170.74
-4.80%
|
11/25/2019
|
$147.79
|
PP = $142.16
|
|
MB = $149.27
|
Most Recent Note - 2/5/2020 5:59:13 PM
G - There was a "negative reversal" today for a loss on higher volume after hitting a new all-time high. It is extended from the previously noted base. Its 50 DMA line ($152.25) and prior highs in the $142-143 area define important support to watch on pullbacks.
>>> FEATURED STOCK ARTICLE : Volume Totals Cooling While Hovering Near All-Time High - 1/29/2020 |
View all notes |
Set NEW NOTE alert |
Company Profile |
SEC
News |
Chart |
Request a new note
C
A
S
I |
PAYC
-
NYSE
Paycom Software Inc
COMPUTER SOFTWARE and SERVICES - Application Software
|
$293.53
|
+2.82
0.97% |
$299.73
|
944,879
110.25% of 50 DAV
50 DAV is 857,000
|
$342.00
-14.17%
|
11/20/2019
|
$252.97
|
PP = $259.81
|
|
MB = $272.80
|
Most Recent Note - 2/6/2020 12:46:09 PM
G - Gapped down today after a "negative reversal" on the prior session at its all-time high. Reported earnings +41% on +29% for the Dec '19 quarter. It is very extended from any sound base. Its 50 DMA line ($283) and prior high ($279.95 on 11/27/19) define important near-term support levels to watch on pullbacks. Fundamentals remain strong.
>>> FEATURED STOCK ARTICLE : Gapped Up for New High But Ended Near Session Low - 1/23/2020 |
View all notes |
Set NEW NOTE alert |
Company Profile |
SEC
News |
Chart |
Request a new note
C
A
S
I |
BLD
-
NYSE
Topbuild Corp
Bldg-Constr Prds/Misc
|
$115.90
|
+0.35
0.30% |
$116.50
|
178,541
64.22% of 50 DAV
50 DAV is 278,000
|
$119.99
-3.41%
|
12/9/2019
|
$109.71
|
PP = $113.84
|
|
MB = $119.53
|
Most Recent Note - 2/6/2020 5:44:16 PM
Y - Volume totals have been cooling while consolidating near its 52-week high following an impressive streak of volume-driven gains. Prior high ($113.74) defines near-term support above its 50 DMA line ($108). See the latest FSU analysis for more details and a new annotated graph.
>>> FEATURED STOCK ARTICLE : Volume Totals Cooling While Consolidating Near All-Time High - 2/6/2020 |
View all notes |
Set NEW NOTE alert |
Company Profile |
SEC
News |
Chart |
Request a new note
C
A
S
I |
Symbol/Exchange
Company Name
Industry Group |
PRICE |
CHANGE
(%Change) |
Day High |
Volume
(% DAV)
(% 50 day avg vol) |
52 Wk Hi
% From Hi |
Featured
Date |
Price
Featured |
Pivot Featured |
|
Max Buy |
TEAM
-
NASDAQ
Atlassian Corp Plc Cl A
Comp Sftwr-Spec Enterprs
|
$148.00
|
+0.06
0.04% |
$150.66
|
1,018,978
66.56% of 50 DAV
50 DAV is 1,531,000
|
$153.70
-3.71%
|
1/24/2020
|
$144.66
|
PP = $140.49
|
|
MB = $147.51
|
Most Recent Note - 2/5/2020 6:00:32 PM
Y - Color code is changed to yellow after pulling back below its "max buy" level with today's big loss on near average volume. Rallied from a cup-with-handle base pattern with volume +514% above average behind the considerable gain on 1/24/20 triggering a technical buy signal. Bullish action came after it reported earnings +48% on +37% sales revenues for the Dec '19 quarter.
>>> FEATURED STOCK ARTICLE : Gapped Up Today Following Another Strong Earnings Report - 1/24/2020 |
View all notes |
Set NEW NOTE alert |
Company Profile |
SEC
News |
Chart |
Request a new note
C
A
S
I |
GLOB
-
NYSE
Globant SA
Computer-Tech Services
|
$121.56
|
-3.44
-2.75% |
$125.08
|
154,843
58.43% of 50 DAV
50 DAV is 265,000
|
$131.00
-7.21%
|
11/14/2019
|
$106.87
|
PP = $112.43
|
|
MB = $118.05
|
Most Recent Note - 2/5/2020 5:53:50 PM
G - Suffered another big loss today with higher volume, action indicative of distributional pressure. Pulled back last week after wedging to new highs with recent gains lacking great volume conviction. Its prior high ($112.33) and 50 DMA line ($110.91) define important near-term support to watch. See the latest FSU analysis for more details and a new annotated graph.
>>> FEATURED STOCK ARTICLE : Encountering Distributional Pressure After Wedging to New Highs - 2/5/2020 |
View all notes |
Set NEW NOTE alert |
Company Profile |
SEC
News |
Chart |
Request a new note
C
A
S
I |
STNE
-
NASDAQ
Stoneco Ltd Cl A
Finance-CrdtCard/PmtPr
|
$40.78
|
-0.81
-1.95% |
$41.66
|
1,469,103
80.85% of 50 DAV
50 DAV is 1,817,000
|
$45.72
-10.80%
|
1/22/2020
|
$43.94
|
PP = $45.72
|
|
MB = $48.01
|
Most Recent Note - 2/7/2020 5:10:07 PM
Y - After quietly touching a new all-time high this week it has pulled back near its 50 DMA line ($40.75) with a streak of 4 consecutive losses. Subsequent gains above the pivot point backed by at least +40% above average volume are needed to trigger a proper technical buy signal. More damaging losses would raise concerns and trigger a technical sell signal.
>>> FEATURED STOCK ARTICLE : Perched Near High With Best-Ever Close After Volume-Driven Gain - 1/22/2020 |
View all notes |
Set NEW NOTE alert |
Company Profile |
SEC
News |
Chart |
Request a new note
C
A
S
I |
|
|
|
THESE ARE NOT BUY RECOMMENDATIONS!
Comments contained in the body of this report are technical
opinions only. The material herein has been obtained
from sources believed to be reliable and accurate, however,
its accuracy and completeness cannot be guaranteed.
This site is not an investment advisor, hence it does
not endorse or recommend any securities or other investments.
Any recommendation contained in this report may not
be suitable for all investors and it is not to be deemed
an offer or solicitation on our part with respect to
the purchase or sale of any securities. All trademarks,
service marks and trade names appearing in this report
are the property of their respective owners, and are
likewise used for identification purposes only.
This report is a service available
only to active Paid Premium Members.
You may opt-out of receiving report notifications
at any time. Questions or comments may be submitted
by writing to Premium Membership Services 665 S.E. 10 Street, Suite 201 Deerfield Beach, FL 33441-5634 or by calling 1-800-965-8307
or 954-785-1121.
|
|
|