You are not logged in.
This means you
CAN ONLY VIEW reports that were published prior to Sunday, February 18, 2024.
You
MUST UPGRADE YOUR MEMBERSHIP if you want to see any current reports.
AFTER MARKET UPDATE - THURSDAY, FEBRUARY 6TH, 2020
Previous After Market Report Next After Market Report >>>
|
|
|
|
DOW |
+88.92 |
29,379.77 |
+0.30% |
|
Volume |
949,915,480 |
-4% |
|
Volume |
2,287,401,110 |
-7% |
|
NASDAQ |
+63.47 |
9,572.15 |
+0.67% |
|
Advancers |
1,359 |
47% |
|
Advancers |
1,457 |
46% |
|
S&P 500 |
+11.09 |
3,345.78 |
+0.33% |
|
Decliners |
1,502 |
52% |
|
Decliners |
1,704 |
54% |
|
Russell 2000 |
-4.46 |
1,677.46 |
-0.27% |
|
52 Wk Highs |
261 |
|
|
52 Wk Highs |
184 |
|
|
S&P 600 |
-3.54 |
1,016.66 |
-0.35% |
|
52 Wk Lows |
32 |
|
|
52 Wk Lows |
47 |
|
|
 |
Major Indices Rose With Less Leadership and Lighter Volume Totals
Kenneth J. Gruneisen - Passed the CAN SLIM® Master's Exam
The Dow added 88 points, while the S&P 500 gained 0.3%. The Nasdaq Composite climbed 0.7%. Additionally, all three major averages posted record highs while recording a four day winning streak. Decliners led advancers by a narrow margin on the NYSE and on the Nasdaq exchange. The reported volume totals were lighter than the prior session totals on the NYSE and on the Nasdaq exchange. There were 100 high-ranked companies from the Leaders List that hit a new 52-week high and were listed on the BreakOuts Page, versus the total of 100 on the prior session. New 52-week highs totals again easily outnumbered new 52-week lows on the NYSE and on the Nasdaq exchange. The major indices' (M criteria) remain in a confirmed uptrend. Disciplined investors buy individual stocks on a case-by-case basis only if all key criteria are met. The Featured Stocks Page provides the most timely analysis on high-ranked leaders. Charts used courtesy of www.stockcharts.com
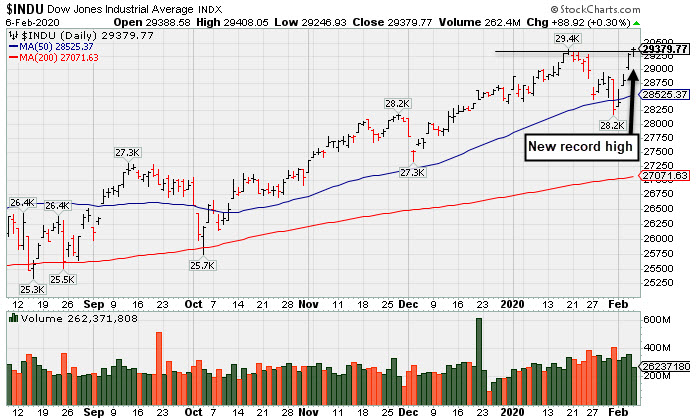
PICTURED: The Dow Jones Industrial Average rallied for a 4th consecutive gain and hit a new record high.
Stocks finished higher Thursday as investors assessed the latest developments on the trade front. This morning, China announced plans to cut tariffs in half on $75 billion of U.S. imports effective February 14 as part of the “phase one” trade deal.
Six of 11 S&P 500 sectors finished the day in positive territory with communication services pacing the gains. Twitter (TWTR +15.03%) after revenue topped projections and the social media company revealed a higher than anticipated number of daily users in the quarter. Consumer Staples also outperformed, with Philip Morris (PM +2.67%) following a positive quarterly report. Elsewhere, Qualcomm (QCOM -0.33%) ended the day slightly lower despite the chipmaker providing strong sales forecasts for the current quarter on expectations of 5G networks being expanded quicker than anticipated. In other corporate news, Boeing (BA +3.60%) rose following a report of a new software bug that the company believes won’t extend the delay the 737 MAX timeline.
Treasuries strengthened, with the yield on the 10-year note ticking down one basis point to 1.64%. On the data front, updates on the U.S. labor market garnered attention ahead of tomorrow’s all-important monthly jobs report. A report showed initial jobless claims fell by 15,000 to 202,000 in the most recent report, the lowest level in nine months. In commodities, WTI crude rebounded 0.5% to $51.01/barrel after an OPEC panel suggested a production cut of 600,000 barrels a day. |
 Kenneth J. Gruneisen started out as a licensed stockbroker in August 1987, a couple of months prior to the historic stock market crash that took the Dow Jones Industrial Average down -22.6% in a single day. He has published daily fact-based fundamental and technical analysis on high-ranked stocks online for two decades. Through FACTBASEDINVESTING.COM, Kenneth provides educational articles, news, market commentary, and other information regarding proven investment systems that work in good times and bad.
Comments contained in the body of this report are technical opinions only and are not necessarily those of Gruneisen Growth Corp. The material herein has been obtained from sources believed to be reliable and accurate, however, its accuracy and completeness cannot be guaranteed. Our firm, employees, and customers may effect transactions, including transactions contrary to any recommendation herein, or have positions in the securities mentioned herein or options with respect thereto. Any recommendation contained in this report may not be suitable for all investors and it is not to be deemed an offer or solicitation on our part with respect to the purchase or sale of any securities. |
|
 |
Financial and Energy-Linked Groups Fell
Kenneth J. Gruneisen - Passed the CAN SLIM® Master's Exam
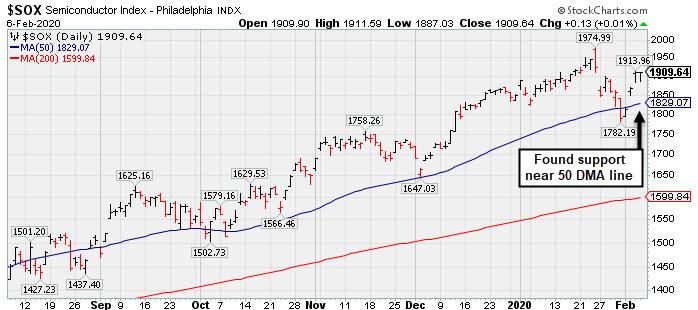
The Bank Index ($BKX -0.63%) and the Broker/Dealer Index ($XBD -1.12%) both lost ground while the Retail Index ($RLX +0.14%) eked out a small gain. The Biotech Index ($BTK +0.32%) inched higher and the Semiconductor Index ($SOX +0.01%) finished flat while the Networking Index ($NWX -0.11%) ended slightly in the red. Energy-linked groups had a negative bias as the Oil Services Index ($OSX -2.27%) and the Integrated Oil Index ($XOI -1.28%) both fell. The Gold & Silver Index ($XAU +1.20%) was a standout gainer.
PICTURED: The Semiconductor Index ($SOX +0.01%) found prompt support again at its 50-day moving average (DMA) line.
| Oil Services |
$OSX |
65.48 |
-1.52 |
-2.27% |
-16.36% |
| Integrated Oil |
$XOI |
1,128.57 |
-14.65 |
-1.28% |
-11.17% |
| Semiconductor |
$SOX |
1,909.64 |
+0.12 |
+0.01% |
+3.24% |
| Networking |
$NWX |
570.34 |
-0.65 |
-0.11% |
-2.24% |
| Broker/Dealer |
$XBD |
298.55 |
-3.38 |
-1.12% |
+2.81% |
| Retail |
$RLX |
2,587.31 |
+3.55 |
+0.14% |
+5.64% |
| Gold & Silver |
$XAU |
103.42 |
+1.23 |
+1.20% |
-3.27% |
| Bank |
$BKX |
109.33 |
-0.69 |
-0.63% |
-3.56% |
| Biotech |
$BTK |
5,157.44 |
+16.22 |
+0.32% |
+1.78% |
|
|
|
 |
Volume Totals Cooling While Consolidating Near All-Time High
Kenneth J. Gruneisen - Passed the CAN SLIM® Master's Exam
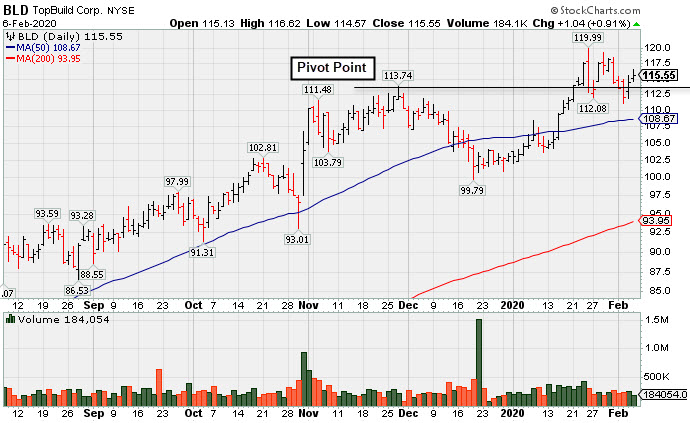
Topbuild Corp (BLD +$1.04 or +0.91% to $115.55) has been quietly consolidating near its all-time high with volume totals cooling following an impressive streak of volume-driven gains. The prior high ($113.74) defines near-term support above its 50-day moving average (DMA) line ($108.67).
It is not due to report earnings news until 12/25/20. Warnings were +24% on +5% sales revenues for the Sep '19 quarter versus the year ago period, just below the +25% minimum guideline (C criteria). Still, it has a 98 Earnings Per Share Rating. Its annual earnings (A criteria) history has also been strong and steady since turning profitable in FY '14.
BLD was last shown in this FSU section on 1/17/20 with an annotated graph under the headline, "Fifth Consecutive Gain Leaves TopBuild Near 52-Week High". It traded up as much as +45.9% since first highlighted in yellow with new pivot point cited based on its 8/12/18 high plus 10 cents in the 5/17/19 mid-day report (read here).
The number of top-rated funds owning its shares rose from 380 in Dec '18 to 498 in Dec '19. Its current Up/Down Volume Ratio of 1.5 is an unbiased indication its shares have been under accumulation over the past 50 days. It has a Timeliness Rating of A, but it still has a Sponsorship Rating of D.
|
|
|
Color Codes Explained :
Y - Better candidates highlighted by our
staff of experts.
G - Previously featured
in past reports as yellow but may no longer be buyable under the
guidelines.
***Last / Change / Volume data in this table is the closing quote data***
Symbol/Exchange
Company Name
Industry Group |
PRICE |
CHANGE
(%Change) |
Day High |
Volume
(% DAV)
(% 50 day avg vol) |
52 Wk Hi
% From Hi |
Featured
Date |
Price
Featured |
Pivot Featured |
|
Max Buy |
 FTNT
-
NASDAQ
FTNT
-
NASDAQ
Fortinet Inc
Computer Sftwr-Security
|
$121.33
|
+1.55
1.29% |
$121.82
|
1,848,546
168.66% of 50 DAV
50 DAV is 1,096,000
|
$121.48
-0.12%
|
12/9/2019
|
$103.85
|
PP = $106.10
|
|
MB = $111.41
|
Most Recent Note - 2/4/2020 5:22:55 PM
G -Posted a solid gain today with average volume for a best-ever close. Very extended from any sound base. Its 50 DMA line ($110) defines important near-term support to watch. See the latest FSU analysis for more details and a new annotated graph.
>>> FEATURED STOCK ARTICLE : Fortinet Posted Gain for Best-Ever Close - 2/4/2020 |
View all notes |
Set NEW NOTE alert |
Company Profile |
SEC
News |
Chart |
Request a new note
C
A
S
I |
SPSC
-
NASDAQ
S P S Commerce Inc
COMPUTER SOFTWARE and SERVICES - Application Software
|
$58.96
|
+0.77
1.32% |
$59.45
|
97,450
55.88% of 50 DAV
50 DAV is 174,400
|
$59.98
-1.70%
|
11/29/2019
|
$56.59
|
PP = $59.24
|
|
MB = $62.20
|
Most Recent Note - 2/3/2020 5:12:35 PM
Y - Found support near its 50 DMA line ($56.71) today after 6 consecutive small losses. Still perched near its all-time high. Subsequent gains above its pivot point backed by at least +40% above average volume are needed to trigger a new technical buy signal. Fundamentals remain strong. Its current Relative Strength Rating of 77 is below the 80+ minimum guideline for buy candidates. See the latest FSU analysis for more details and a new annotated graph.
>>> FEATURED STOCK ARTICLE : Perched Near High Finding Support at 50-Day Average - 2/3/2020 |
View all notes |
Set NEW NOTE alert |
Company Profile |
SEC
News |
Chart |
Request a new note
C
A
S
I |
AUDC
-
NASDAQ
Audiocodes Ltd
ELECTRONICS - Scientific and Technical Instrum
|
$22.69
|
-0.16
-0.70% |
$23.44
|
603,777
181.86% of 50 DAV
50 DAV is 332,000
|
$28.73
-21.02%
|
9/13/2019
|
$19.68
|
PP = $19.84
|
|
MB = $20.83
|
Most Recent Note - 2/5/2020 6:03:34 PM
G - Posted a 2nd consecutive volume-driven gain. A subsequent rebound above its 50 DMA line ($25.00) is needed for its outlook to improve after damaging volume-driven losses last week triggered technical sell signals. Fundamentals remain strong after it reported earnings +30% on +15% sales revenues for the Dec '19 quarter.
>>> FEATURED STOCK ARTICLE : Showed Resilience With Close in Upper Third of Intra-day Range - 1/27/2020 |
View all notes |
Set NEW NOTE alert |
Company Profile |
SEC
News |
Chart |
Request a new note
C
A
S
I |
CHDN
-
NASDAQ
Churchill Downs Inc
LEISURE - Gaming Activities
|
$153.53
|
+1.84
1.21% |
$153.84
|
112,369
52.26% of 50 DAV
50 DAV is 215,000
|
$153.54
-0.01%
|
10/8/2019
|
$129.77
|
PP = $132.83
|
|
MB = $139.47
|
Most Recent Note - 2/4/2020 5:28:15 PM
G - Stubbornly held its ground and hit a new 52-week high with today's 2nd consecutive gain on near average volume. Its 50 DMA line ($136.75) defines near-term support above the prior low ($132.55 on 1/03/19) The Jun and Sep '19 quarterly earnings versus the year ago periods were both below the +25% minimum guideline (C criteria) and raised fundamental concerns.
>>> FEATURED STOCK ARTICLE : Reversal From High Following 5 Gains With Light Volume - 1/21/2020 |
View all notes |
Set NEW NOTE alert |
Company Profile |
SEC
News |
Chart |
Request a new note
C
A
S
I |
LULU
-
NASDAQ
Lululemon Athletica
MANUFACTURING - Textile Manufacturing
|
$243.78
|
-0.12
-0.05% |
$244.53
|
1,152,947
59.83% of 50 DAV
50 DAV is 1,927,000
|
$250.10
-2.53%
|
9/6/2019
|
$201.25
|
PP = $194.35
|
|
MB = $204.07
|
Most Recent Note - 2/5/2020 6:04:36 PM
G - Extended from any sound base and hovering near its all-time high with volume totals cooling. Its 50 DMA line ($233) and prior low ($218.18 on 12/12/19) define important near-term support to watch. Fundamentals remain strong.
>>> FEATURED STOCK ARTICLE : Volume Totals Cooling While Hovering Near All-Time High - 1/30/2020 |
View all notes |
Set NEW NOTE alert |
Company Profile |
SEC
News |
Chart |
Request a new note
C
A
S
I |
Symbol/Exchange
Company Name
Industry Group |
PRICE |
CHANGE
(%Change) |
Day High |
Volume
(% DAV)
(% 50 day avg vol) |
52 Wk Hi
% From Hi |
Featured
Date |
Price
Featured |
Pivot Featured |
|
Max Buy |
CPRT
-
NASDAQ
Copart Inc
SPECIALTY RETAIL - Auto Dealerships
|
$102.95
|
+0.79
0.77% |
$103.01
|
942,911
56.53% of 50 DAV
50 DAV is 1,668,000
|
$104.10
-1.10%
|
1/2/2020
|
$92.80
|
PP = $92.51
|
|
MB = $97.14
|
Most Recent Note - 2/4/2020 5:30:26 PM
G - Perched near its all-time high after a gain today with light volume, extended from any sound base. Its 50 DMA line ($93.22) defines near-term support above prior highs in the $91-92 area. Fundamentals remain strong.
>>> FEATURED STOCK ARTICLE : New High With Yet Another Gain Backed by Light Volume - 1/28/2020 |
View all notes |
Set NEW NOTE alert |
Company Profile |
SEC
News |
Chart |
Request a new note
C
A
S
I |
NMIH
-
NASDAQ
N M I Holdings Inc Cl A
Finance-MrtgandRel Svc
|
$33.53
|
+0.19
0.57% |
$34.24
|
419,583
86.51% of 50 DAV
50 DAV is 485,000
|
$35.79
-6.31%
|
2/6/2020
|
$33.53
|
PP = $35.89
|
|
MB = $37.68
|
 Most Recent Note - 2/6/2020 5:49:55 PM
Y - Color code is changed to yellow while consolidating above its 50 DMA line ($33.08). New pivot point cited is based on its 12/19/19 high plus 10 cents. Subsequent volume-driven gains above the pivot point may trigger a new (or add-on) technical buy signal. Tested prior highs in the $31 area. Due to report earnings news on 2/11/20. Volume and volatility often increase near earnings news.
>>> FEATURED STOCK ARTICLE : Sputtering Below 50-Day Moving Average Line Hurts Outlook - 1/31/2020 |
View all notes |
Set NEW NOTE alert |
Company Profile |
SEC
News |
Chart |
Request a new note
C
A
S
I |
SPLK
-
NASDAQ
Splunk Inc
Computer Sftwr-Database
|
$162.67
|
-1.21
-0.74% |
$164.95
|
1,067,438
55.22% of 50 DAV
50 DAV is 1,933,000
|
$170.74
-4.73%
|
11/25/2019
|
$147.79
|
PP = $142.16
|
|
MB = $149.27
|
Most Recent Note - 2/5/2020 5:59:13 PM
G - There was a "negative reversal" today for a loss on higher volume after hitting a new all-time high. It is extended from the previously noted base. Its 50 DMA line ($152.25) and prior highs in the $142-143 area define important support to watch on pullbacks.
>>> FEATURED STOCK ARTICLE : Volume Totals Cooling While Hovering Near All-Time High - 1/29/2020 |
View all notes |
Set NEW NOTE alert |
Company Profile |
SEC
News |
Chart |
Request a new note
C
A
S
I |
PAYC
-
NYSE
Paycom Software Inc
COMPUTER SOFTWARE and SERVICES - Application Software
|
$290.71
|
-31.79
-9.86% |
$306.99
|
2,678,075
328.60% of 50 DAV
50 DAV is 815,000
|
$342.00
-15.00%
|
11/20/2019
|
$252.97
|
PP = $259.81
|
|
MB = $272.80
|
Most Recent Note - 2/6/2020 12:46:09 PM
G - Gapped down today after a "negative reversal" on the prior session at its all-time high. Reported earnings +41% on +29% for the Dec '19 quarter. It is very extended from any sound base. Its 50 DMA line ($283) and prior high ($279.95 on 11/27/19) define important near-term support levels to watch on pullbacks. Fundamentals remain strong.
>>> FEATURED STOCK ARTICLE : Gapped Up for New High But Ended Near Session Low - 1/23/2020 |
View all notes |
Set NEW NOTE alert |
Company Profile |
SEC
News |
Chart |
Request a new note
C
A
S
I |
BLD
-
NYSE
Topbuild Corp
Bldg-Constr Prds/Misc
|
$115.55
|
+1.04
0.91% |
$116.62
|
184,054
66.45% of 50 DAV
50 DAV is 277,000
|
$119.99
-3.70%
|
12/9/2019
|
$109.71
|
PP = $113.84
|
|
MB = $119.53
|
Most Recent Note - 2/6/2020 5:44:16 PM
Y - Volume totals have been cooling while consolidating near its 52-week high following an impressive streak of volume-driven gains. Prior high ($113.74) defines near-term support above its 50 DMA line ($108). See the latest FSU analysis for more details and a new annotated graph.
>>> FEATURED STOCK ARTICLE : Volume Totals Cooling While Consolidating Near All-Time High - 2/6/2020 |
View all notes |
Set NEW NOTE alert |
Company Profile |
SEC
News |
Chart |
Request a new note
C
A
S
I |
Symbol/Exchange
Company Name
Industry Group |
PRICE |
CHANGE
(%Change) |
Day High |
Volume
(% DAV)
(% 50 day avg vol) |
52 Wk Hi
% From Hi |
Featured
Date |
Price
Featured |
Pivot Featured |
|
Max Buy |
TEAM
-
NASDAQ
Atlassian Corp Plc Cl A
Comp Sftwr-Spec Enterprs
|
$147.94
|
+1.36
0.93% |
$149.12
|
1,351,272
88.84% of 50 DAV
50 DAV is 1,521,000
|
$153.70
-3.75%
|
1/24/2020
|
$144.66
|
PP = $140.49
|
|
MB = $147.51
|
Most Recent Note - 2/5/2020 6:00:32 PM
Y - Color code is changed to yellow after pulling back below its "max buy" level with today's big loss on near average volume. Rallied from a cup-with-handle base pattern with volume +514% above average behind the considerable gain on 1/24/20 triggering a technical buy signal. Bullish action came after it reported earnings +48% on +37% sales revenues for the Dec '19 quarter.
>>> FEATURED STOCK ARTICLE : Gapped Up Today Following Another Strong Earnings Report - 1/24/2020 |
View all notes |
Set NEW NOTE alert |
Company Profile |
SEC
News |
Chart |
Request a new note
C
A
S
I |
GLOB
-
NYSE
Globant SA
Computer-Tech Services
|
$125.00
|
+3.12
2.56% |
$127.13
|
313,951
118.47% of 50 DAV
50 DAV is 265,000
|
$131.00
-4.58%
|
11/14/2019
|
$106.87
|
PP = $112.43
|
|
MB = $118.05
|
Most Recent Note - 2/5/2020 5:53:50 PM
G - Suffered another big loss today with higher volume, action indicative of distributional pressure. Pulled back last week after wedging to new highs with recent gains lacking great volume conviction. Its prior high ($112.33) and 50 DMA line ($110.91) define important near-term support to watch. See the latest FSU analysis for more details and a new annotated graph.
>>> FEATURED STOCK ARTICLE : Encountering Distributional Pressure After Wedging to New Highs - 2/5/2020 |
View all notes |
Set NEW NOTE alert |
Company Profile |
SEC
News |
Chart |
Request a new note
C
A
S
I |
STNE
-
NASDAQ
Stoneco Ltd Cl A
Finance-CrdtCard/PmtPr
|
$41.59
|
-0.69
-1.63% |
$42.69
|
2,370,991
118.97% of 50 DAV
50 DAV is 1,993,000
|
$45.72
-9.03%
|
1/22/2020
|
$43.94
|
PP = $45.72
|
|
MB = $48.01
|
Most Recent Note - 2/4/2020 12:23:53 PM
Y - Touched a new all-time high with on the prior session with a big gain backed by near average volume. Its 50 DMA line ($40.62) defines near-term support. Subsequent gains above the pivot point backed by at least +40% above average volume are needed to trigger a proper technical buy signal.
>>> FEATURED STOCK ARTICLE : Perched Near High With Best-Ever Close After Volume-Driven Gain - 1/22/2020 |
View all notes |
Set NEW NOTE alert |
Company Profile |
SEC
News |
Chart |
Request a new note
C
A
S
I |
|
|
|
THESE ARE NOT BUY RECOMMENDATIONS!
Comments contained in the body of this report are technical
opinions only. The material herein has been obtained
from sources believed to be reliable and accurate, however,
its accuracy and completeness cannot be guaranteed.
This site is not an investment advisor, hence it does
not endorse or recommend any securities or other investments.
Any recommendation contained in this report may not
be suitable for all investors and it is not to be deemed
an offer or solicitation on our part with respect to
the purchase or sale of any securities. All trademarks,
service marks and trade names appearing in this report
are the property of their respective owners, and are
likewise used for identification purposes only.
This report is a service available
only to active Paid Premium Members.
You may opt-out of receiving report notifications
at any time. Questions or comments may be submitted
by writing to Premium Membership Services 665 S.E. 10 Street, Suite 201 Deerfield Beach, FL 33441-5634 or by calling 1-800-965-8307
or 954-785-1121.
|
|
|