You are not logged in.
This means you
CAN ONLY VIEW reports that were published prior to Saturday, February 24, 2024.
You
MUST UPGRADE YOUR MEMBERSHIP if you want to see any current reports.
AFTER MARKET UPDATE - WEDNESDAY, FEBRUARY 5TH, 2020
Previous After Market Report Next After Market Report >>>
|
|
|
|
DOW |
+483.22 |
29,290.85 |
+1.68% |
|
Volume |
994,261,940 |
+7% |
|
Volume |
2,456,479,780 |
+1% |
|
NASDAQ |
+40.71 |
9,508.68 |
+0.43% |
|
Advancers |
2,203 |
77% |
|
Advancers |
2,207 |
69% |
|
S&P 500 |
+37.10 |
3,334.69 |
+1.13% |
|
Decliners |
668 |
23% |
|
Decliners |
979 |
31% |
|
Russell 2000 |
+25.15 |
1,681.92 |
+1.52% |
|
52 Wk Highs |
250 |
|
|
52 Wk Highs |
181 |
|
|
S&P 600 |
+19.08 |
1,020.20 |
+1.91% |
|
52 Wk Lows |
16 |
|
|
52 Wk Lows |
34 |
|
|
 |
Healthy Leadership Underpins Record Stock Rally
Kenneth J. Gruneisen - Passed the CAN SLIM® Master's Exam
The S&P 500 and Nasdaq Composite both notched fresh all-time highs, advancing 1.1% and 0.4%, respectively. The Dow climbed 483 points. Advancers led decliners by more than a 3-1 margin on the NYSE and more than 2-1 on the Nasdaq exchange. The reported volume totals were higher than the prior session totals on the NYSE and on the Nasdaq exchange. There were 100 high-ranked companies from the Leaders List that hit a new 52-week high and were listed on the BreakOuts Page, versus the total of 96 on the prior session. New 52-week highs totals again expanded and easily outnumbered shrinking new 52-week lows on the NYSE and on the Nasdaq exchange. The major indices' (M criteria) uptrend recently came under pressure. Disciplined investors buy individual stocks on a case-by-case basis only if all key criteria are met. The Featured Stocks Page provides the most timely analysis on high-ranked leaders. Charts used courtesy of www.stockcharts.com
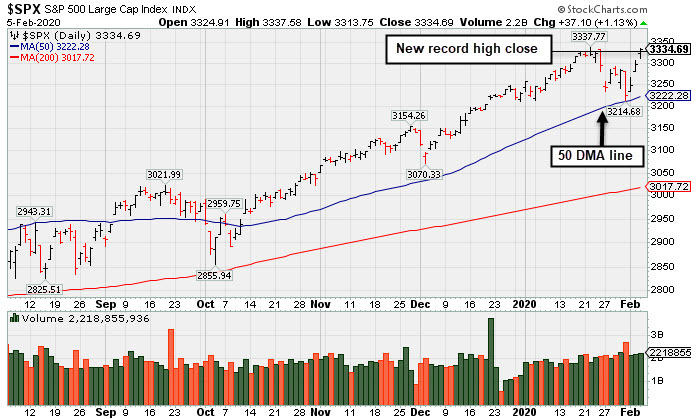
PICTURED: The S&P 500 Index rallied for a 3rd consecutive gain and its best-ever close.
Stocks extended their recent rally, as fears surrounding the coronavirus abated. Risk sentiment was boosted after reports out of China and the U.K. showed promise of a coronavirus treatment amid an accelerated pace of infections being reported by the World Health Organization.
The perceived “risk-on” mood sent Treasuries lower, with the yield on the 10-year note adding five basis points to 1.65%. On the data front, ADP revealed private payrolls jumped 291,000 in January, well above estimates of 157,000 and the highest figure since 2015. Another report showed the annual U.S. trade deficit narrowed in 2019, the first time in six years. Meanwhile, an update on the U.S. services sector from the Institute for Supply Management showed activity expanded at a faster pace in January compared to December.
Ten of 11 S&P 500 sectors finished in positive territory, with Real Estate the lone laggard. Energy stocks paced the gains, as WTI crude advanced for the first time in six sessions, adding 2.8% to $51.01/barrel. Disney (DIS -2.32%) weighed on the Communication Services group after the company topped earnings and revenue estimates but failed to update guidance for its streaming service Disney+. In other earnings, Microchip Technology (MCHP +6.69%) rose after the chipmaker beat on the top and bottom line. Ford Motor (F -9.48%) sank after falling short of earnings estimates, and providing disappointing full-year guidance. In other news, shares of Tesla (TSLA -17.18%) fell, paring its 2020 gain to +74.8%. |
 Kenneth J. Gruneisen started out as a licensed stockbroker in August 1987, a couple of months prior to the historic stock market crash that took the Dow Jones Industrial Average down -22.6% in a single day. He has published daily fact-based fundamental and technical analysis on high-ranked stocks online for two decades. Through FACTBASEDINVESTING.COM, Kenneth provides educational articles, news, market commentary, and other information regarding proven investment systems that work in good times and bad.
Comments contained in the body of this report are technical opinions only and are not necessarily those of Gruneisen Growth Corp. The material herein has been obtained from sources believed to be reliable and accurate, however, its accuracy and completeness cannot be guaranteed. Our firm, employees, and customers may effect transactions, including transactions contrary to any recommendation herein, or have positions in the securities mentioned herein or options with respect thereto. Any recommendation contained in this report may not be suitable for all investors and it is not to be deemed an offer or solicitation on our part with respect to the purchase or sale of any securities. |
|
 |
Energy, Bank and Tech Groups Led Widespread Gains
Kenneth J. Gruneisen - Passed the CAN SLIM® Master's Exam
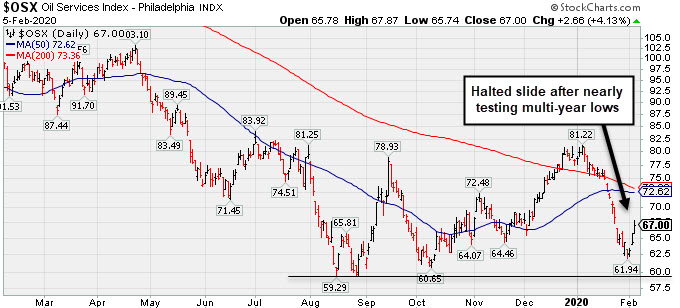
The Bank Index ($BKX +2.49%) outpaced the Broker/Dealer Index ($XBD +0.99%) and the Retail Index ($RLX +0.76%) on the widely positive session. The Biotech Index ($BTK +2.57%) and Semiconductor Index ($SOX +2.19%) outpaced the Networking Index ($NWX +1.04%) with unanimous tech sector gains. Energy-linked groups had a very positive bias as the Oil Services Index ($OSX +4.13%) and the Integrated Oil Index ($XOI +3.59%) rose considerably. The Gold & Silver Index ($XAU 0.47%) was a laggard as it also edged higher.
PICTURED: The Oil Services Index ($OSX +4.13%) has posted solid gains after slumping near multi-year lows.
| Oil Services |
$OSX |
67.00 |
+2.65 |
+4.12% |
-14.42% |
| Integrated Oil |
$XOI |
1,143.22 |
+39.57 |
+3.59% |
-10.02% |
| Semiconductor |
$SOX |
1,909.52 |
+40.87 |
+2.19% |
+3.24% |
| Networking |
$NWX |
570.99 |
+5.85 |
+1.04% |
-2.13% |
| Broker/Dealer |
$XBD |
301.93 |
+2.95 |
+0.99% |
+3.98% |
| Retail |
$RLX |
2,583.76 |
+19.41 |
+0.76% |
+5.49% |
| Gold & Silver |
$XAU |
102.19 |
+0.48 |
+0.47% |
-4.42% |
| Bank |
$BKX |
110.02 |
+2.63 |
+2.45% |
-2.95% |
| Biotech |
$BTK |
5,141.22 |
+128.58 |
+2.57% |
+1.46% |
|
|
|
 |
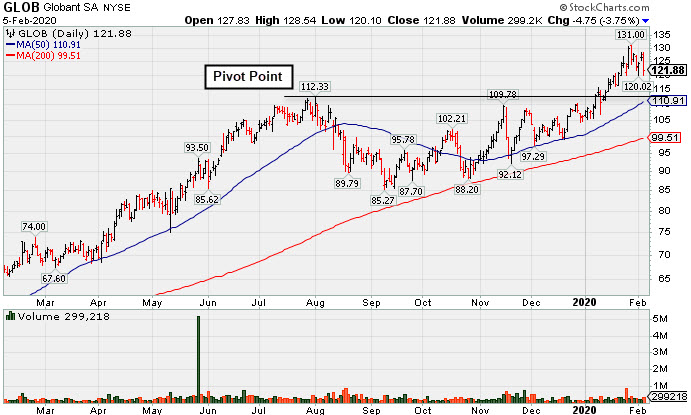
Encountering Distributional Pressure After Wedging to New Highs
Kenneth J. Gruneisen - Passed the CAN SLIM® Master's Exam
Globant SA (GLOB -$4.75 or -3.75% to $121.88) suffered another big loss with higher volume, action indicative of distributional pressure. It pulled back last week after wedging to new highs with recent gains lacking great volume conviction. Its prior high ($112.33) and 50-day moving average (DMA) line ($110.91) define important near-term support to watch. Keep in mind that it is due to report earnings news on 2/13/20. Volume and volatility often increase near earnings news.
GLOB made gradual progress since last shown in this FSU section on 1/15/20 with an annotated graph under the headline, "Gain for New High Today Backed by Only +12% Above Average Volume". It went through a choppy consolidation after highlighted in yellow with pivot point cited based on its 8/01/19 high plus 10 cents in the 11/14/19 mid-day report (read here).
It reported earnings +35% on +27% sales revenues for the Sep '19 quarter versus the year ago period, continuing its strong earning track record above the +25% minimum earnings guideline (C criteria). It has a strong annual earnings (A criteria) history and has a 97 Earnings Per Share Rating.
This Luxembourg-based Computer - Tech Services firm completed a Secondary Offering on 6/21/18. The number of top-rated funds owning its shares rose from 235 in Mar '18 to 555 in Dec '19, a reassuring sign concerning the I criteria. Its current Up/Down Volume Ratio of 1.5 is an unbiased indication its shares have been under accumulation over the past 50 days. It has a Timeliness rating of A and Sponsorship Rating of B. Its small supply of 36.8 million shares outstanding (S criteria) can contribute to greater volatility in the event of institutional buying or selling.
Charts courtesy of www.stockcharts.com
 |
|
|
Color Codes Explained :
Y - Better candidates highlighted by our
staff of experts.
G - Previously featured
in past reports as yellow but may no longer be buyable under the
guidelines.
***Last / Change / Volume data in this table is the closing quote data***
Symbol/Exchange
Company Name
Industry Group |
PRICE |
CHANGE
(%Change) |
Day High |
Volume
(% DAV)
(% 50 day avg vol) |
52 Wk Hi
% From Hi |
Featured
Date |
Price
Featured |
Pivot Featured |
|
Max Buy |
 FTNT
-
NASDAQ
FTNT
-
NASDAQ
Fortinet Inc
Computer Sftwr-Security
|
$119.78
|
-0.30
-0.25% |
$121.48
|
1,279,958
116.68% of 50 DAV
50 DAV is 1,097,000
|
$120.44
-0.55%
|
12/9/2019
|
$103.85
|
PP = $106.10
|
|
MB = $111.41
|
Most Recent Note - 2/4/2020 5:22:55 PM
G -Posted a solid gain today with average volume for a best-ever close. Very extended from any sound base. Its 50 DMA line ($110) defines important near-term support to watch. See the latest FSU analysis for more details and a new annotated graph.
>>> FEATURED STOCK ARTICLE : Fortinet Posted Gain for Best-Ever Close - 2/4/2020 |
View all notes |
Set NEW NOTE alert |
Company Profile |
SEC
News |
Chart |
Request a new note
C
A
S
I |
SPSC
-
NASDAQ
S P S Commerce Inc
COMPUTER SOFTWARE and SERVICES - Application Software
|
$58.19
|
-0.48
-0.82% |
$59.23
|
133,835
76.52% of 50 DAV
50 DAV is 174,900
|
$59.98
-2.98%
|
11/29/2019
|
$56.59
|
PP = $59.24
|
|
MB = $62.20
|
Most Recent Note - 2/3/2020 5:12:35 PM
Y - Found support near its 50 DMA line ($56.71) today after 6 consecutive small losses. Still perched near its all-time high. Subsequent gains above its pivot point backed by at least +40% above average volume are needed to trigger a new technical buy signal. Fundamentals remain strong. Its current Relative Strength Rating of 77 is below the 80+ minimum guideline for buy candidates. See the latest FSU analysis for more details and a new annotated graph.
>>> FEATURED STOCK ARTICLE : Perched Near High Finding Support at 50-Day Average - 2/3/2020 |
View all notes |
Set NEW NOTE alert |
Company Profile |
SEC
News |
Chart |
Request a new note
C
A
S
I |
AUDC
-
NASDAQ
Audiocodes Ltd
ELECTRONICS - Scientific and Technical Instrum
|
$22.85
|
+0.90
4.10% |
$23.50
|
598,053
184.58% of 50 DAV
50 DAV is 324,000
|
$28.73
-20.47%
|
9/13/2019
|
$19.68
|
PP = $19.84
|
|
MB = $20.83
|
 Most Recent Note - 2/5/2020 6:03:34 PM
G - Posted a 2nd consecutive volume-driven gain. A subsequent rebound above its 50 DMA line ($25.00) is needed for its outlook to improve after damaging volume-driven losses last week triggered technical sell signals. Fundamentals remain strong after it reported earnings +30% on +15% sales revenues for the Dec '19 quarter.
>>> FEATURED STOCK ARTICLE : Showed Resilience With Close in Upper Third of Intra-day Range - 1/27/2020 |
View all notes |
Set NEW NOTE alert |
Company Profile |
SEC
News |
Chart |
Request a new note
C
A
S
I |
CHDN
-
NASDAQ
Churchill Downs Inc
LEISURE - Gaming Activities
|
$151.69
|
-0.43
-0.28% |
$153.54
|
143,455
65.81% of 50 DAV
50 DAV is 218,000
|
$152.40
-0.47%
|
10/8/2019
|
$129.77
|
PP = $132.83
|
|
MB = $139.47
|
Most Recent Note - 2/4/2020 5:28:15 PM
G - Stubbornly held its ground and hit a new 52-week high with today's 2nd consecutive gain on near average volume. Its 50 DMA line ($136.75) defines near-term support above the prior low ($132.55 on 1/03/19) The Jun and Sep '19 quarterly earnings versus the year ago periods were both below the +25% minimum guideline (C criteria) and raised fundamental concerns.
>>> FEATURED STOCK ARTICLE : Reversal From High Following 5 Gains With Light Volume - 1/21/2020 |
View all notes |
Set NEW NOTE alert |
Company Profile |
SEC
News |
Chart |
Request a new note
C
A
S
I |
LULU
-
NASDAQ
Lululemon Athletica
MANUFACTURING - Textile Manufacturing
|
$243.90
|
-4.09
-1.65% |
$249.71
|
1,514,069
79.02% of 50 DAV
50 DAV is 1,916,000
|
$250.10
-2.48%
|
9/6/2019
|
$201.25
|
PP = $194.35
|
|
MB = $204.07
|
Most Recent Note - 2/5/2020 6:04:36 PM
G - Extended from any sound base and hovering near its all-time high with volume totals cooling. Its 50 DMA line ($233) and prior low ($218.18 on 12/12/19) define important near-term support to watch. Fundamentals remain strong.
>>> FEATURED STOCK ARTICLE : Volume Totals Cooling While Hovering Near All-Time High - 1/30/2020 |
View all notes |
Set NEW NOTE alert |
Company Profile |
SEC
News |
Chart |
Request a new note
C
A
S
I |
Symbol/Exchange
Company Name
Industry Group |
PRICE |
CHANGE
(%Change) |
Day High |
Volume
(% DAV)
(% 50 day avg vol) |
52 Wk Hi
% From Hi |
Featured
Date |
Price
Featured |
Pivot Featured |
|
Max Buy |
CPRT
-
NASDAQ
Copart Inc
SPECIALTY RETAIL - Auto Dealerships
|
$102.16
|
-0.49
-0.48% |
$104.10
|
1,006,015
57.59% of 50 DAV
50 DAV is 1,747,000
|
$104.00
-1.77%
|
1/2/2020
|
$92.80
|
PP = $92.51
|
|
MB = $97.14
|
Most Recent Note - 2/4/2020 5:30:26 PM
G - Perched near its all-time high after a gain today with light volume, extended from any sound base. Its 50 DMA line ($93.22) defines near-term support above prior highs in the $91-92 area. Fundamentals remain strong.
>>> FEATURED STOCK ARTICLE : New High With Yet Another Gain Backed by Light Volume - 1/28/2020 |
View all notes |
Set NEW NOTE alert |
Company Profile |
SEC
News |
Chart |
Request a new note
C
A
S
I |
NMIH
-
NASDAQ
N M I Holdings Inc Cl A
Finance-MrtgandRel Svc
|
$33.34
|
+0.17
0.51% |
$33.59
|
359,059
74.19% of 50 DAV
50 DAV is 484,000
|
$35.79
-6.85%
|
11/8/2019
|
$32.89
|
PP = $31.44
|
|
MB = $33.01
|
Most Recent Note - 1/31/2020 5:40:39 PM
G - Still sputtering and a rebound above the 50 DMA line ($33.07) is needed for its outlook to improve. Testing prior highs in the $31 area which are the next important near-term support line. Fundamentals remain strong. See the latest FSU analysis for more details and a new annotated graph.
>>> FEATURED STOCK ARTICLE : Sputtering Below 50-Day Moving Average Line Hurts Outlook - 1/31/2020 |
View all notes |
Set NEW NOTE alert |
Company Profile |
SEC
News |
Chart |
Request a new note
C
A
S
I |
SPLK
-
NASDAQ
Splunk Inc
Computer Sftwr-Database
|
$163.88
|
-3.93
-2.34% |
$170.74
|
2,452,021
125.10% of 50 DAV
50 DAV is 1,960,000
|
$168.42
-2.70%
|
11/25/2019
|
$147.79
|
PP = $142.16
|
|
MB = $149.27
|
Most Recent Note - 2/5/2020 5:59:13 PM
G - There was a "negative reversal" today for a loss on higher volume after hitting a new all-time high. It is extended from the previously noted base. Its 50 DMA line ($152.25) and prior highs in the $142-143 area define important support to watch on pullbacks.
>>> FEATURED STOCK ARTICLE : Volume Totals Cooling While Hovering Near All-Time High - 1/29/2020 |
View all notes |
Set NEW NOTE alert |
Company Profile |
SEC
News |
Chart |
Request a new note
C
A
S
I |
PAYC
-
NYSE
Paycom Software Inc
COMPUTER SOFTWARE and SERVICES - Application Software
|
$322.50
|
-15.24
-4.51% |
$342.00
|
1,691,851
210.95% of 50 DAV
50 DAV is 802,000
|
$337.99
-4.58%
|
11/20/2019
|
$252.97
|
PP = $259.81
|
|
MB = $272.80
|
Most Recent Note - 2/5/2020 5:56:48 PM
G - Reversed into the red today after hitting yet another new all-time high. Reported earnings +41% on +29% for the Dec '19 quarter after the close. It is very extended from any sound base. Its 50 DMA line ($283) and prior high ($279.95 on 11/27/19) define important near-term support levels to watch on pullbacks. Fundamentals remain strong.
>>> FEATURED STOCK ARTICLE : Gapped Up for New High But Ended Near Session Low - 1/23/2020 |
View all notes |
Set NEW NOTE alert |
Company Profile |
SEC
News |
Chart |
Request a new note
C
A
S
I |
BLD
-
NYSE
Topbuild Corp
Bldg-Constr Prds/Misc
|
$114.51
|
+2.51
2.24% |
$115.61
|
252,826
91.27% of 50 DAV
50 DAV is 277,000
|
$119.99
-4.57%
|
12/9/2019
|
$109.71
|
PP = $113.84
|
|
MB = $119.53
|
Most Recent Note - 1/31/2020 5:43:24 PM
Y - Consolidating near its 52-week high following volume-driven gains. Prior high ($113.74) defines near-term support above its 50 DMA line ($108.33).
>>> FEATURED STOCK ARTICLE : Fifth Consecutive Gain Leaves TopBuild Near 52-Week High - 1/17/2020 |
View all notes |
Set NEW NOTE alert |
Company Profile |
SEC
News |
Chart |
Request a new note
C
A
S
I |
Symbol/Exchange
Company Name
Industry Group |
PRICE |
CHANGE
(%Change) |
Day High |
Volume
(% DAV)
(% 50 day avg vol) |
52 Wk Hi
% From Hi |
Featured
Date |
Price
Featured |
Pivot Featured |
|
Max Buy |
TEAM
-
NASDAQ
Atlassian Corp Plc Cl A
Comp Sftwr-Spec Enterprs
|
$146.58
|
-5.51
-3.62% |
$153.70
|
1,643,537
108.34% of 50 DAV
50 DAV is 1,517,000
|
$152.69
-4.00%
|
1/24/2020
|
$144.66
|
PP = $140.49
|
|
MB = $147.51
|
Most Recent Note - 2/5/2020 6:00:32 PM
Y - Color code is changed to yellow after pulling back below its "max buy" level with today's big loss on near average volume. Rallied from a cup-with-handle base pattern with volume +514% above average behind the considerable gain on 1/24/20 triggering a technical buy signal. Bullish action came after it reported earnings +48% on +37% sales revenues for the Dec '19 quarter.
>>> FEATURED STOCK ARTICLE : Gapped Up Today Following Another Strong Earnings Report - 1/24/2020 |
View all notes |
Set NEW NOTE alert |
Company Profile |
SEC
News |
Chart |
Request a new note
C
A
S
I |
GLOB
-
NYSE
Globant SA
Computer-Tech Services
|
$121.88
|
-4.75
-3.75% |
$128.54
|
299,218
110.41% of 50 DAV
50 DAV is 271,000
|
$131.00
-6.96%
|
11/14/2019
|
$106.87
|
PP = $112.43
|
|
MB = $118.05
|
Most Recent Note - 2/5/2020 5:53:50 PM
G - Suffered another big loss today with higher volume, action indicative of distributional pressure. Pulled back last week after wedging to new highs with recent gains lacking great volume conviction. Its prior high ($112.33) and 50 DMA line ($110.91) define important near-term support to watch. See the latest FSU analysis for more details and a new annotated graph.
>>> FEATURED STOCK ARTICLE : Encountering Distributional Pressure After Wedging to New Highs - 2/5/2020 |
View all notes |
Set NEW NOTE alert |
Company Profile |
SEC
News |
Chart |
Request a new note
C
A
S
I |
STNE
-
NASDAQ
Stoneco Ltd Cl A
Finance-CrdtCard/PmtPr
|
$42.28
|
-0.86
-1.99% |
$44.39
|
2,112,094
102.93% of 50 DAV
50 DAV is 2,052,000
|
$45.72
-7.52%
|
1/22/2020
|
$43.94
|
PP = $45.72
|
|
MB = $48.01
|
Most Recent Note - 2/4/2020 12:23:53 PM
Y - Touched a new all-time high with on the prior session with a big gain backed by near average volume. Its 50 DMA line ($40.62) defines near-term support. Subsequent gains above the pivot point backed by at least +40% above average volume are needed to trigger a proper technical buy signal.
>>> FEATURED STOCK ARTICLE : Perched Near High With Best-Ever Close After Volume-Driven Gain - 1/22/2020 |
View all notes |
Set NEW NOTE alert |
Company Profile |
SEC
News |
Chart |
Request a new note
C
A
S
I |
|
|
|
THESE ARE NOT BUY RECOMMENDATIONS!
Comments contained in the body of this report are technical
opinions only. The material herein has been obtained
from sources believed to be reliable and accurate, however,
its accuracy and completeness cannot be guaranteed.
This site is not an investment advisor, hence it does
not endorse or recommend any securities or other investments.
Any recommendation contained in this report may not
be suitable for all investors and it is not to be deemed
an offer or solicitation on our part with respect to
the purchase or sale of any securities. All trademarks,
service marks and trade names appearing in this report
are the property of their respective owners, and are
likewise used for identification purposes only.
This report is a service available
only to active Paid Premium Members.
You may opt-out of receiving report notifications
at any time. Questions or comments may be submitted
by writing to Premium Membership Services 665 S.E. 10 Street, Suite 201 Deerfield Beach, FL 33441-5634 or by calling 1-800-965-8307
or 954-785-1121.
|
|
|