You are not logged in.
This means you
CAN ONLY VIEW reports that were published prior to Friday, February 23, 2024.
You
MUST UPGRADE YOUR MEMBERSHIP if you want to see any current reports.
AFTER MARKET UPDATE - TUESDAY, FEBRUARY 5TH, 2019
Previous After Market Report Next After Market Report >>>
|
|
|
|
DOW |
+172.15 |
25,411.52 |
+0.68% |
|
Volume |
842,347,690 |
+6% |
|
Volume |
2,244,780,150 |
+8% |
|
NASDAQ |
+54.54 |
7,402.08 |
+0.74% |
|
Advancers |
1,849 |
63% |
|
Advancers |
1,739 |
57% |
|
S&P 500 |
+12.83 |
2,737.70 |
+0.47% |
|
Decliners |
1,079 |
37% |
|
Decliners |
1,332 |
43% |
|
Russell 2000 |
+2.69 |
1,520.23 |
+0.18% |
|
52 Wk Highs |
94 |
|
|
52 Wk Highs |
75 |
|
|
S&P 600 |
+1.08 |
945.89 |
+0.11% |
|
52 Wk Lows |
4 |
|
|
52 Wk Lows |
18 |
|
|
 |
Indices Rally With More Leadership as Volume Increases
Kenneth J. Gruneisen - Passed the CAN SLIM® Master's Exam
Stocks finished higher Tuesday. The Dow climbed 172 points to 25,411 while the S&P 500 added 12 points to 2,737. The Nasdaq Composite rose 54 points to 7,402. The volume totals were higher than the prior session on both the NYSE and the Nasdaq exchange, a reassuring sign indicative of greater buying demand from the institutional crowd. Breadth was positive as advancers led decliners by almost a 2-1 margin on the NYSE and by almost a 3-2 margin on the Nasdaq exchange. There were 36 high-ranked companies from the Leaders List that made a new 52-week high and were listed on the BreakOuts Page, versus the total of 32 on the prior session. New 52-week highs totals expanded and solidly outnumbered new 52-week lows on the NYSE and on the Nasdaq exchange. The major indices are in a confirmed uptrend after recently noted improvements helped to signal a change in market direction (M criteria) back to a bullish stance. The Featured Stocks Page provides the most timely analysis on high-ranked leaders. Charts used courtesy of www.stockcharts.com
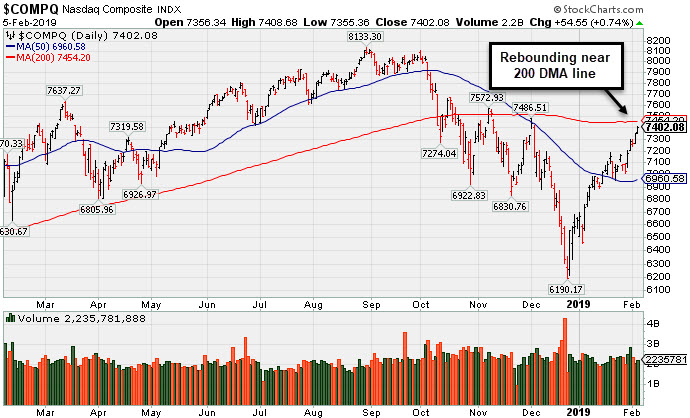
PICTURED: The Nasdaq Composite Index is rebounding toward its 200-day moving average (DMA) line.
The major averages extended gains as investors digested the latest corporate earnings updates. On the data front, a survey from ISM revealed service sector activity cooled to a reading of 56.7 in January, below the upwardly revised 58.0 figure from December. Market participants were also focused on the political landscape ahead of President Trump delivering his State of the Union address this evening.
Eight of 11 S&P 500 sectors ended in positive territory with Consumer Discretionary shares pacing gains. The Communications Services group also outperformed with Electronic Arts (EA +4.63%) rising. In earnings, Estee Lauder (EL +11.64%) rallied after the personal care product company raised its forward guidance as sales in Asia surged. BP (BP +3.45%) rose as the British energy giant doubled fourth quarter profits from the same period last year. Gilead Sciences (GILD -3.38%) was a notable decliner after the biotech company posted quarterly results short of Wall Street profit projections due to higher expense levels.
Treasuries strengthened with the yield on the benchmark 10-year note falling two basis points to 2.70%. In commodities, WTI crude is losing 1.6% to $53.67/barrel. COMEX gold finished flat at $1,314.20/ounce amid a stronger dollar. |
 Kenneth J. Gruneisen started out as a licensed stockbroker in August 1987, a couple of months prior to the historic stock market crash that took the Dow Jones Industrial Average down -22.6% in a single day. He has published daily fact-based fundamental and technical analysis on high-ranked stocks online for two decades. Through FACTBASEDINVESTING.COM, Kenneth provides educational articles, news, market commentary, and other information regarding proven investment systems that work in good times and bad.
Comments contained in the body of this report are technical opinions only and are not necessarily those of Gruneisen Growth Corp. The material herein has been obtained from sources believed to be reliable and accurate, however, its accuracy and completeness cannot be guaranteed. Our firm, employees, and customers may effect transactions, including transactions contrary to any recommendation herein, or have positions in the securities mentioned herein or options with respect thereto. Any recommendation contained in this report may not be suitable for all investors and it is not to be deemed an offer or solicitation on our part with respect to the purchase or sale of any securities. |
|
 |
Retail and Semiconductor Indexes Led Group Gainers
Kenneth J. Gruneisen - Passed the CAN SLIM® Master's Exam
The Retail Index ($RLX +1.02%) rose and outpaced the Broker/Dealer Index ($XBD +0.26%), but the Bank Index ($BKX -0.36%) edged lower. The tech sector was led higher by the Semiconductor Index ($SOX +0.48%) and the Biotech Index ($BTK +0.21%), but the Networking Index ($NWX -0.11%) ended the session slightly lower. The Gold & Silver Index ($XAU +0.65%) outpaced the Integrated Oil Index ($XOI +0.20%) with modest gains, meanwhile the Oil Services Index ($OSX -0.16%) ended slightly lower.
Charts courtesy of www.stockcharts.com
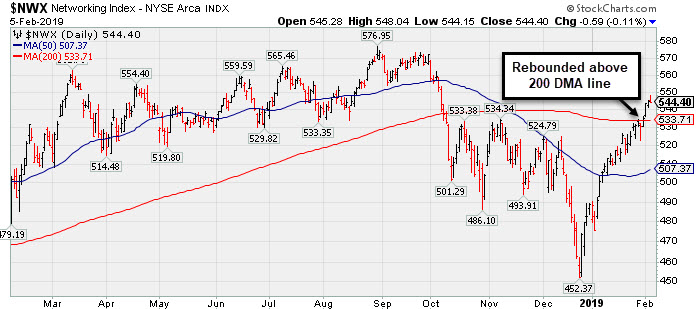 ,%20Broker/Dealer%20Index%20($XBD%20+0.98%),%20and%20the%20Bank%20Index%20($BKX%20+0.57%)%20posted%20unanimous%20gains%20which%20helped%20move%20the%20major%20averages%20higher.%20The%20tech%20sector%20had%20a%20positive%20bias%20as%20the%20Networking%20Index%20($NWX%20+0.24%),%20Semiconductor%20Index%20($SOX%20+0.50%),%20and%20the%20Biotech%20Index%20($BTK%20+0.10%)%20posted%20gains.%20The%20Integrated%20Oil%20Index%20($XOI%20+0.46%)%20and%20the%20Oil%20Services%20Index%20%20($OSX%20+1.40%)%20also%20rose,%20meanwhile%20the%20Gold%20&%20Silver%20Index%20($XAU%20-0.12%)%20ended%20slightly%20in%20the%20red.) PICTURED: The Networking Index ($NWX -0.11%) recently rebounded near its 200-day moving average (DMA) line.
| Oil Services |
$OSX |
98.91 |
-0.16 |
-0.16% |
+22.72% |
| Integrated Oil |
$XOI |
1,303.51 |
+2.63 |
+0.20% |
+12.46% |
| Semiconductor |
$SOX |
1,300.13 |
+6.25 |
+0.48% |
+12.55% |
| Networking |
$NWX |
544.40 |
-0.59 |
-0.11% |
+11.40% |
| Broker/Dealer |
$XBD |
263.45 |
+0.68 |
+0.26% |
+11.00% |
| Retail |
$RLX |
2,136.53 |
+21.61 |
+1.02% |
+9.49% |
| Gold & Silver |
$XAU |
76.31 |
+0.49 |
+0.65% |
+8.00% |
| Bank |
$BKX |
96.94 |
-0.34 |
-0.35% |
+13.00% |
| Biotech |
$BTK |
4,925.55 |
+10.24 |
+0.21% |
+16.70% |
|
|
|
 |
Reversed Into Red After Hitting a New High
Kenneth J. Gruneisen - Passed the CAN SLIM® Master's Exam
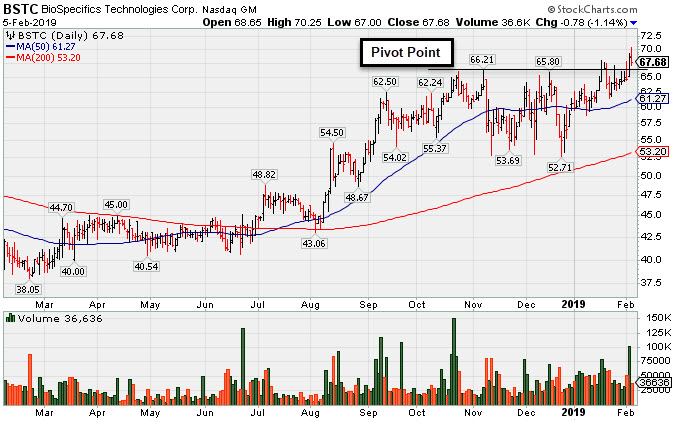
Biospecifics Technologies (BSTC -$0.78 or -1.14% to $67.68) reversed into the red today after briefly trading above its "max buy" level and hitting a new 52-week high. A big volume-driven gain on the prior session and new high close was a reassuring sign of institutional accumulation clinching a technical buy signal. It was first highlighted in yellow with pivot point cited based on its 11/07/18 high plus 10 cents in the 1/18/19 mid-day report (read here).
The thinly traded Biomed/Biotech firm has a small supply (S criteria) of only 5.2 million shares in the public float can contribute to greater price volatility in the event of institutional buying or selling. Disciplined investors avoid chasing stocks more than +5% above prior highs and always limit losses by selling if ever a stock falls more than -7% from their purchase price.
The number of top-rated funds owning its shares rose from 171 in Mar '18 to 221 in Dec '18, a reassuring sign concerning the I criteria. Its current up/Down Volume Ratio of 1.6 is an unbiased indication its shares have been under accumulation over the past 50 days. It has an A Timeliness Rating and a C Sponsorship rating.
Earnings increases have been above the +25% minimum guideline (C criteria) in the 4 latest quarterly comparisons through Sep '18. Its sales revenues growth rate has shown acceleration, but quarterly totals have been in the $7-8 million range, still rather minuscule in the context of all publicly traded companies.
Charts courtesy of www.stockcharts.com
 |
|
|
Color Codes Explained :
Y - Better candidates highlighted by our
staff of experts.
G - Previously featured
in past reports as yellow but may no longer be buyable under the
guidelines.
***Last / Change / Volume data in this table is the closing quote data***
Symbol/Exchange
Company Name
Industry Group |
PRICE |
CHANGE
(%Change) |
Day High |
Volume
(% DAV)
(% 50 day avg vol) |
52 Wk Hi
% From Hi |
Featured
Date |
Price
Featured |
Pivot Featured |
|
Max Buy |
MLR
-
NYSE
Miller Industries Inc
AUTOMOTIVE - Auto Parts
|
$30.47
|
+0.37
1.23% |
$30.51
|
9,814
28.86% of 50 DAV
50 DAV is 34,000
|
$30.84
-1.20%
|
11/30/2018
|
$28.35
|
PP = $29.50
|
|
MB = $30.98
|
Most Recent Note - 2/4/2019 5:30:07 PM
Y - Reversed early gains today after hitting new highs, ending near the session low with a loss on higher (near average) volume. Subsequent gains above the pivot point backed by at least +40% above average volume may help clinch a proper technical buy signal. Its 50 DMA line and recent low define near-term support to watch on pullbacks.
>>> FEATURED STOCK ARTICLE : Traded Above Pivot Point Recently Without Great Volume - 1/29/2019 |
View all notes |
Set NEW NOTE alert |
Company Profile |
SEC
News |
Chart |
Request a new note
C
A
S
I |
LHCG
-
NASDAQ
L H C Group Inc
HEALTH SERVICES - Home Health Care
|
$111.71
|
+0.79
0.71% |
$112.22
|
164,305
61.77% of 50 DAV
50 DAV is 266,000
|
$110.99
0.65%
|
1/23/2019
|
$107.29
|
PP = $107.61
|
|
MB = $112.99
|
Most Recent Note - 2/4/2019 5:33:58 PM
Y - Posted a big gain today with lighter (near average) volume. Subsequent gains above the pivot point backed by at least +40% above average volume may trigger a technical buy signal.
>>> FEATURED STOCK ARTICLE : Healthcare Services Firm Reached a New High - 1/23/2019 |
View all notes |
Set NEW NOTE alert |
Company Profile |
SEC
News |
Chart |
Request a new note
C
A
S
I |
BSTC
-
NASDAQ
Biospecifics Technologie
Medical-Biomed/Biotech
|
$67.68
|
-0.78
-1.14% |
$70.25
|
36,636
89.36% of 50 DAV
50 DAV is 41,000
|
$69.27
-2.30%
|
1/18/2019
|
$67.40
|
PP = $66.31
|
|
MB = $69.63
|
 Most Recent Note - 2/5/2019 5:10:32 PM
Y - There was a "negative reversal" today after hitting another new 52-week high. The thinly traded Biomed/Biotech firm rose above its pivot point on the prior session with a big gain backed by +148% above average volume, a reassuring sign of institutional accumulation clinching a technical buy signal. See the latest FSU analysis for more details and a new annotated graph.
>>> FEATURED STOCK ARTICLE : Reversed Into Red After Hitting a New High - 2/5/2019 |
View all notes |
Set NEW NOTE alert |
Company Profile |
SEC
News |
Chart |
Request a new note
C
A
S
I |
UBNT
-
NASDAQ
Ubiquiti Networks
TELECOMMUNICATIONS - Diversified Communication Serv
|
$108.71
|
-3.26
-2.91% |
$113.10
|
340,128
103.38% of 50 DAV
50 DAV is 329,000
|
$115.44
-5.83%
|
11/9/2018
|
$108.20
|
PP = $101.43
|
|
MB = $106.50
|
Most Recent Note - 2/5/2019 3:59:16 PM
G - Encountering mild distributional pressure today while reversing an early gain. Still quietly consolidating above its 50 DMA line ($105.18). Faces some resistance due to overhead supply up to the $115 level. Prior low ($92.08 on 12/24/18) defines the next important support.
>>> FEATURED STOCK ARTICLE : Consolidating Above 50-Day Moving Average - 1/31/2019 |
View all notes |
Set NEW NOTE alert |
Company Profile |
SEC
News |
Chart |
Request a new note
C
A
S
I |
NOW
-
NYSE
Servicenow Inc
Computer Sftwr-Enterprse
|
$228.35
|
+3.21
1.43% |
$229.40
|
1,827,925
77.88% of 50 DAV
50 DAV is 2,347,000
|
$228.41
-0.03%
|
1/31/2019
|
$218.14
|
PP = $206.40
|
|
MB = $216.72
|
Most Recent Note - 2/1/2019 5:06:59 PM
G - Color code is changed to green after rising above its "max buy" level. Highlighted in yellow with pivot point cited based on its 9/13/18 high plus 10 cents when highlighted in the 1/31/19 mid-day report as it triggered a technical buy signal with a big "breakaway gap". Bullish action came after it reported earnings +79% on +30% sales revenues for the Dec '18 quarter, continuing its strong earnings track record. Prior mid-day report noted - "Volume and volatility often increase near earnings news." See the latest FSU analysis for more details and a new annotated graph.
>>> FEATURED STOCK ARTICLE : Breakaway Gap Followed Strong Earnings Report - 2/1/2019 |
View all notes |
Set NEW NOTE alert |
Company Profile |
SEC
News |
Chart |
Request a new note
C
A
S
I |
Symbol/Exchange
Company Name
Industry Group |
PRICE |
CHANGE
(%Change) |
Day High |
Volume
(% DAV)
(% 50 day avg vol) |
52 Wk Hi
% From Hi |
Featured
Date |
Price
Featured |
Pivot Featured |
|
Max Buy |
PYPL
-
NASDAQ
Paypal Holdings Inc
Finance-CrdtCard/PmtPr
|
$92.27
|
+0.61
0.67% |
$92.35
|
5,498,952
58.55% of 50 DAV
50 DAV is 9,392,000
|
$94.58
-2.44%
|
1/24/2019
|
$92.56
|
PP = $93.80
|
|
MB = $98.49
|
Most Recent Note - 2/5/2019 3:55:30 PM
Y - Rebounding after a gap down on 1/31/19 following earnings news. Reported +25% earnings on +13% sales revenues for the Dec '18 quarter. Disciplined investors note that the recent gains above the pivot point lacked the +40% above average volume needed to trigger a proper technical buy signal.
>>> FEATURED STOCK ARTICLE : Perched Within Striking Distance of High Ahead of Earnings News - 1/24/2019 |
View all notes |
Set NEW NOTE alert |
Company Profile |
SEC
News |
Chart |
Request a new note
C
A
S
I |
ALRM
-
NASDAQ
Alarm.com Holdings Inc
Security/Sfty
|
$62.00
|
-0.15
-0.24% |
$62.74
|
681,223
137.90% of 50 DAV
50 DAV is 494,000
|
$63.72
-2.70%
|
1/22/2019
|
$60.52
|
PP = $60.30
|
|
MB = $63.32
|
Most Recent Note - 2/4/2019 5:25:42 PM
Y - Stubbornly holding its ground perched near its all-time high. Recent gains for new highs lacked great volume conviction. Prior highs in the $60 area define initial support to watch on pullbacks.
>>> FEATURED STOCK ARTICLE : Pullback Broke Steak of Gains and Reversed From New High - 1/22/2019 |
View all notes |
Set NEW NOTE alert |
Company Profile |
SEC
News |
Chart |
Request a new note
C
A
S
I |
PLNT
-
NYSE
Planet Fitness Inc Cl A
Leisure-Services
|
$58.40
|
+0.25
0.43% |
$59.91
|
2,085,032
168.28% of 50 DAV
50 DAV is 1,239,000
|
$59.52
-1.88%
|
11/7/2018
|
$57.10
|
PP = $55.45
|
|
MB = $58.22
|
Most Recent Note - 2/5/2019 12:30:22 PM
G - Color code is changed to green after rising above its "max buy" level with above average volume today, hitting a new all-time high. Its 50 DMA line ($55.53) defines important near-term support to watch above the recent low ($48).
>>> FEATURED STOCK ARTICLE : Hovering in a Tight Range Near All-Time High - 1/25/2019 |
View all notes |
Set NEW NOTE alert |
Company Profile |
SEC
News |
Chart |
Request a new note
C
A
S
I |
TEAM
-
NASDAQ
Atlassian Corp Plc Cl A
Comp Sftwr-Spec Enterprs
|
$102.77
|
+0.59
0.58% |
$103.78
|
1,348,796
77.79% of 50 DAV
50 DAV is 1,734,000
|
$102.85
-0.08%
|
1/7/2019
|
$94.68
|
PP = $98.31
|
|
MB = $103.23
|
Most Recent Note - 2/5/2019 3:58:03 PM
G - Color code is changed to green while posting a 5th consecutive gain today, rising above its "max buy" level and hitting new all-time highs, however gains have lacked great volume conviction. Gains and a strong close above the pivot point backed by at least +40% above average volume are needed to clinch a proper technical buy signal. Its 50 DMA line ($87.97) and prior low define near-term support to watch on pullbacks. Fundamentals remain strong.
>>> FEATURED STOCK ARTICLE : Volume Light While Hovering Near High - 1/28/2019 |
View all notes |
Set NEW NOTE alert |
Company Profile |
SEC
News |
Chart |
Request a new note
C
A
S
I |
MEDP
-
NASDAQ
Medpace Holdings Inc
Medical-Research Eqp/Svc
|
$66.51
|
-1.20
-1.77% |
$69.71
|
750,445
100.33% of 50 DAV
50 DAV is 748,000
|
$67.74
-1.82%
|
1/30/2019
|
$64.10
|
PP = $65.19
|
|
MB = $68.45
|
Most Recent Note - 2/1/2019 4:55:41 PM
Y - Wedged to a new 52-week high with +22% above average volume behind today's 3rd consecutive gain. Pivot point cited is based on its 9/17/18 high plus 10 cents. Subsequent gains above the pivot point backed by at least +40% above average volume may trigger a technical buy signal. Fundamentals remain strong. The 200 DMA line acted as support above the prior low and it has rebounded since dropped from the Featured Stocks list on 12/19/18. See the latest FSU analysis for more details and an annotated graph.
>>> FEATURED STOCK ARTICLE : Rallied Near 52-Week High With a Volume-Driven Gain - 1/30/2019 |
View all notes |
Set NEW NOTE alert |
Company Profile |
SEC
News |
Chart |
Request a new note
C
A
S
I |
Symbol/Exchange
Company Name
Industry Group |
PRICE |
CHANGE
(%Change) |
Day High |
Volume
(% DAV)
(% 50 day avg vol) |
52 Wk Hi
% From Hi |
Featured
Date |
Price
Featured |
Pivot Featured |
|
Max Buy |
INVA
-
NASDAQ
Innoviva Inc
Medical-Biomed/Biotech
|
$16.32
|
+0.08
0.49% |
$16.61
|
1,265,071
104.46% of 50 DAV
50 DAV is 1,211,000
|
$20.54
-20.55%
|
11/23/2018
|
$17.74
|
PP = $18.09
|
|
MB = $18.99
|
Most Recent Note - 2/4/2019 5:24:11 PM
G - Damaging volume-driven losses last week triggered technical sell signals. A rebound above the 50 DMA line is ($17.90) needed for its outlook to improve. Due to report earnings news on 2/06/19. See the latest FSU analysis for more details and a new annotated graph.
>>> FEATURED STOCK ARTICLE : Volume Heavy Behind Damaging Losses Negating Breakout - 2/4/2019 |
View all notes |
Set NEW NOTE alert |
Company Profile |
SEC
News |
Chart |
Request a new note
C
A
S
I |
|
|
|
THESE ARE NOT BUY RECOMMENDATIONS!
Comments contained in the body of this report are technical
opinions only. The material herein has been obtained
from sources believed to be reliable and accurate, however,
its accuracy and completeness cannot be guaranteed.
This site is not an investment advisor, hence it does
not endorse or recommend any securities or other investments.
Any recommendation contained in this report may not
be suitable for all investors and it is not to be deemed
an offer or solicitation on our part with respect to
the purchase or sale of any securities. All trademarks,
service marks and trade names appearing in this report
are the property of their respective owners, and are
likewise used for identification purposes only.
This report is a service available
only to active Paid Premium Members.
You may opt-out of receiving report notifications
at any time. Questions or comments may be submitted
by writing to Premium Membership Services 665 S.E. 10 Street, Suite 201 Deerfield Beach, FL 33441-5634 or by calling 1-800-965-8307
or 954-785-1121.
|
|
|

