You are not logged in.
This means you
CAN ONLY VIEW reports that were published prior to Friday, February 23, 2024.
You
MUST UPGRADE YOUR MEMBERSHIP if you want to see any current reports.
AFTER MARKET UPDATE - FRIDAY, FEBRUARY 4TH, 2022
Previous After Market Report Next After Market Report >>>
|
|
|
|
DOW |
-21.42 |
35,089.74 |
-0.06% |
|
Volume |
943,819,311 |
+4% |
|
Volume |
4,061,525,900 |
-5% |
|
NASDAQ |
+219.19 |
14,098.01 |
+1.58% |
|
Advancers |
1,446 |
45% |
|
Advancers |
2,747 |
63% |
|
S&P 500 |
+23.09 |
4,500.53 |
+0.52% |
|
Decliners |
1,761 |
55% |
|
Decliners |
1,608 |
37% |
|
Russell 2000 |
+11.33 |
2,002.36 |
+0.57% |
|
52 Wk Highs |
67 |
|
|
52 Wk Highs |
45 |
|
|
S&P 600 |
+0.13 |
1,283.62 |
+0.01% |
|
52 Wk Lows |
265 |
|
|
52 Wk Lows |
347 |
|
|
Since the Monday, January 31st follow-through day in the market (M criteria) confirmed a new uptrend, new buying efforts may be made in stocks fitting all key criteria of the fact-based investment system.
|
 |
Major Indices Ended Mixed With Nasdaq Leading its Peers
Kenneth J. Gruneisen - Passed the CAN SLIM® Master's Exam
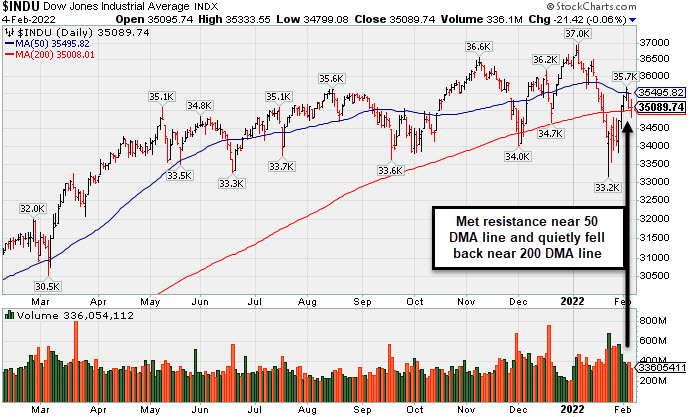
The Dow lost 21 points, trimming its weekly advance to 1.1%. The S&P 500 rose 0.5%, while the Nasdaq Composite rallied 1.6%, with both benchmarks logging a second straight weekly gain and best five-day advance of 2022 (+1.6% and +2.4%, respectively). Volume totals reported were mixed, higher than the prior session on the NYSE and lighter on the Nasdaq exchange. Decliners led advancers by a narrow 6-5 margin on the NYSE while advancers led decliners by about 7-4 on the Nasdaq exchange. There were 19 high-ranked companies from the Leaders List that hit new 52-week highs and were listed on the BreakOuts Page, versus 16 on the prior session. New 52-week lows solidly outnumbered new highs on the NYSE and on the Nasdaq exchange. A follow-through day on Monday, January 31st confirmed a new uptrend for the market averages (M criteria). PICTURED: The Dow Jones Industrial Average met resistance near its 50-day moving average (DMA) line and fell back near its 200 DMA line.
U.S. stocks finished mostly higher on Friday as strong earnings from Amazon.com supported risk sentiment. Meanwhile, Treasuries slumped as a stronger-than-expected monthly jobs report reignited concerns surrounding a faster pace of monetary policy tightening by the Federal Reserve.
Six of 11 S&P 500 sectors closed in negative territory, with growth-related groups bucking the downtrend. Consumer Discretionary outperformed, with Amazon.com Inc. (AMZN +13.5%) surging after nearly doubling analyst profit estimates. Meanwhile, Snap Inc. (SNAP +58.82%) soared as the social media company posted its first ever quarterly profit. Elsewhere, Clorox Co. (CLX -14.47%) gapped down as rising costs pressured its margins, and Ford Motor Co. (F -9.70%) fell following disappointing results.
On the data front, the Labor Department revealed non-farm payrolls increased by 467,000 in January, topping estimates of a 125,000 gain. The unemployment rate rose modestly to 4.0%, while wage inflation climbed 5.7% year-over-year, accelerating from December’s 4.7% annual increase. Following the report, the yield on the benchmark 10-year note jumped eight basis points (0.08%) to 1.91%, its highest level since December 2019. Meanwhile, the yield on the two-year note spiked 11 basis points (0.11%) to 1.31%, a peak not seen since February 2020. In commodities, West Texas Intermediate crude notched its seventh consecutive weekly advance, settling at $92.14/barrel, a new seven-year high. |
 Kenneth J. Gruneisen started out as a licensed stockbroker in August 1987, a couple of months prior to the historic stock market crash that took the Dow Jones Industrial Average down -22.6% in a single day. He has published daily fact-based fundamental and technical analysis on high-ranked stocks online for two decades. Through FACTBASEDINVESTING.COM, Kenneth provides educational articles, news, market commentary, and other information regarding proven investment systems that work in good times and bad.
Comments contained in the body of this report are technical opinions only and are not necessarily those of Gruneisen Growth Corp. The material herein has been obtained from sources believed to be reliable and accurate, however, its accuracy and completeness cannot be guaranteed. Our firm, employees, and customers may effect transactions, including transactions contrary to any recommendation herein, or have positions in the securities mentioned herein or options with respect thereto. Any recommendation contained in this report may not be suitable for all investors and it is not to be deemed an offer or solicitation on our part with respect to the purchase or sale of any securities. |
|
 |
Retail, Financial, and Energy-Linked Groups Led Gainers
Kenneth J. Gruneisen - Passed the CAN SLIM® Master's Exam
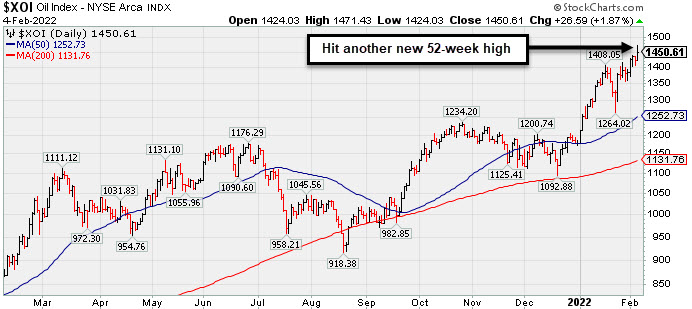
The Retail Index ($RLX +6.51%) posted a standout gain while the Broker/Dealer Index ($XBD +2.41%) and Bank Index ($BKX +2.00%) also had a positive influence on the major averages on Friday. The Oil Services Index ($OSX +2.35%) and Integrated Oil Index ($XOI +1.87%) both outpaced the Gold & Silver Index ($XAU +0.36%). The Biotech Index ($BTK +1.02%) led the tech sector higher while the Semiconductor Index ($SOX +0.60%) also edged higher but the Networking Index ($NWX +0.06%) finished flat.
PICTURED: The Integrated Oil Index ($XOI +1.87%) hit another new 52-week high. It has rallied +33% from the December 2021 low after finding support above its 200 DMA line.
| Oil Services |
$OSX |
67.06 |
+1.54 |
+2.35% |
+27.20% |
| Integrated Oil |
$XOI |
1,450.61 |
+26.59 |
+1.87% |
+23.12% |
| Semiconductor |
$SOX |
3,453.07 |
+20.53 |
+0.60% |
-12.50% |
| Networking |
$NWX |
849.74 |
+0.47 |
+0.06% |
-12.50% |
| Broker/Dealer |
$XBD |
494.63 |
+11.63 |
+2.41% |
+1.60% |
| Retail |
$RLX |
3,867.33 |
+236.28 |
+6.51% |
-8.50% |
| Gold & Silver |
$XAU |
124.58 |
+0.45 |
+0.36% |
-5.94% |
| Bank |
$BKX |
140.05 |
+2.75 |
+2.00% |
+5.92% |
| Biotech |
$BTK |
5,083.63 |
+51.40 |
+1.02% |
-7.88% |
|
|
|
 |
Featured Stocks
Kenneth J. Gruneisen - Passed the CAN SLIM® Master's Exam
|
|
|
Color Codes Explained :
Y - Better candidates highlighted by our
staff of experts.
G - Previously featured
in past reports as yellow but may no longer be buyable under the
guidelines.
***Last / Change / Volume data in this table is the closing quote data***
Symbol/Exchange
Company Name
Industry Group |
PRICE |
CHANGE
(%Change) |
Day High |
Volume
(% DAV)
(% 50 day avg vol) |
52 Wk Hi
% From Hi |
Featured
Date |
Price
Featured |
Pivot Featured |
|
Max Buy |
 REGN
-
NASDAQ
REGN
-
NASDAQ
Regeneron Pharmaceutical
DRUGS - Biotechnology
|
$622.96
|
+2.27
0.37% |
$635.00
|
1,201,500
155.84% of 50 DAV
50 DAV is 771,000
|
$686.62
-9.27%
|
12/13/2021
|
$647.95
|
PP = $686.72
|
|
MB = $721.06
|
 Most Recent Note - 2/4/2022 5:29:04 PM
G - Met resistance today near its 50 DMA line ($627.75) and sputtered after early gains above that important short-term average. Reported Dec '21 quarterly earnings +149% on +104% sales revenues versus the year ago period. Volume and volatility often increase near earnings news. Recently holding its ground in a tight range above prior lows and above its 200 DMA line ($592) which define the important near-term support.
>>> FEATURED STOCK ARTICLE : Earnings News Due While Consolidating Above 200 DMA Line - 2/1/2022 |
View all notes |
Set NEW NOTE alert |
Company Profile |
SEC
News |
Chart |
Request a new note
C
A
S
I |
SF
-
NYSE
Stifel Financial Corp
FINANCIAL SERVICES - Investment Brokerage - Regiona
|
$77.74
|
+1.65
2.17% |
$78.43
|
604,452
110.71% of 50 DAV
50 DAV is 546,000
|
$78.60
-1.09%
|
1/27/2022
|
$74.17
|
PP = $76.23
|
|
MB = $80.04
|
Most Recent Note - 2/4/2022 5:25:56 PM
Y - Posted a small gain today on lighter (near average) volume . Holding its ground after matching its 52-week high with 6 consecutive gains backed by above average volume. Rising from a noted "double bottom" base. Disciplined investors may note Monday's follow-through day in the market (M criteria) confirmed a new uptrend. Bullish action has come since it reported strong results for the Dec '21 quarter versus the year ago period, its 5th strong quarterly comparison. Annual earnings (A criteria) history has been good.
>>> FEATURED STOCK ARTICLE : Formed Double Bottom Base and Faces Little Resistance - 1/27/2022 |
View all notes |
Set NEW NOTE alert |
Company Profile |
SEC
News |
Chart |
Request a new note
C
A
S
I |
TGH
-
NYSE
Textainer Group Holdings
TRANSPORTATION - Logistics
|
$37.91
|
-0.16
-0.42% |
$38.06
|
354,719
103.12% of 50 DAV
50 DAV is 344,000
|
$41.24
-8.07%
|
1/31/2022
|
$36.68
|
PP = $41.34
|
|
MB = $43.41
|
Most Recent Note - 2/4/2022 5:30:20 PM
Y - Pulled back today for a 3rd consecutive small loss, still hovering above its 50 DMA line ($35.98) and perched within close striking distance of its 52-week high. Subsequent gains above the pivot point backed by at least +40% above average volume are needed to trigger a technical buy signal. Highlighted in yellow with pivot point cited based on its 11/05/21 high plus 10 cents in the 1/31/22 mid-day report. Disciplined investors may note a follow-through day in the market (M criteria) confirmed a new uptrend. Fundamentals remain strong.
>>> FEATURED STOCK ARTICLE : Consolidating Above 50-Day Moving Average - 1/31/2022 |
View all notes |
Set NEW NOTE alert |
Company Profile |
SEC
News |
Chart |
Request a new note
C
A
S
I |
HWKN
-
NASDAQ
Hawkins Inc
CHEMICALS - Basic Chemicals
|
$40.03
|
-0.95
-2.32% |
$41.32
|
86,108
165.59% of 50 DAV
50 DAV is 52,000
|
$41.38
-3.26%
|
2/3/2022
|
$39.81
|
PP = $41.07
|
|
MB = $43.12
|
Most Recent Note - 2/4/2022 5:27:56 PM
Y - Pulled back today with above average volume, retreating after it hit a new all-time high on the prior session. It was highlighted in yellow with pivot point cited based on its 1/04/22 high plus 10 cents in the 2/03/22 mid-day report following a gap up, rebounding above its 50 DMA line ($37.69). Subsequent gains and a strong close above the pivot point backed by at least +40% above average volume may trigger a technical buy signal. Bullish action came after it reported Dec '21 quarterly earnings +26% on +31% sales revenues versus the year ago period. Three of the 4 latest quarterly comparisons showed earnings increases above the +25% minimum guideline (C criteria) with a strong sales revenues growth rate. Annual earnings growth (A criteria) has been strong after a downturn in FY '18. See the latest FSU analysis for more details and an annotated graph.
>>> FEATURED STOCK ARTICLE : Bullish Action Followed Another Strong Quarterly Report - 2/3/2022 |
View all notes |
Set NEW NOTE alert |
Company Profile |
SEC
News |
Chart |
Request a new note
C
A
S
I |
|
|
|
THESE ARE NOT BUY RECOMMENDATIONS!
Comments contained in the body of this report are technical
opinions only. The material herein has been obtained
from sources believed to be reliable and accurate, however,
its accuracy and completeness cannot be guaranteed.
This site is not an investment advisor, hence it does
not endorse or recommend any securities or other investments.
Any recommendation contained in this report may not
be suitable for all investors and it is not to be deemed
an offer or solicitation on our part with respect to
the purchase or sale of any securities. All trademarks,
service marks and trade names appearing in this report
are the property of their respective owners, and are
likewise used for identification purposes only.
This report is a service available
only to active Paid Premium Members.
You may opt-out of receiving report notifications
at any time. Questions or comments may be submitted
by writing to Premium Membership Services 665 S.E. 10 Street, Suite 201 Deerfield Beach, FL 33441-5634 or by calling 1-800-965-8307
or 954-785-1121.
|
|
|