You are not logged in.
This means you
CAN ONLY VIEW reports that were published prior to Sunday, February 25, 2024.
You
MUST UPGRADE YOUR MEMBERSHIP if you want to see any current reports.
AFTER MARKET UPDATE - TUESDAY, FEBRUARY 4TH, 2020
Previous After Market Report Next After Market Report >>>
|
|
|
|
DOW |
+407.82 |
28,807.63 |
+1.44% |
|
Volume |
933,565,870 |
-4% |
|
Volume |
2,423,487,880 |
+1% |
|
NASDAQ |
+194.57 |
9,467.97 |
+2.10% |
|
Advancers |
2,058 |
71% |
|
Advancers |
2,231 |
70% |
|
S&P 500 |
+48.67 |
3,297.59 |
+1.50% |
|
Decliners |
822 |
29% |
|
Decliners |
954 |
30% |
|
Russell 2000 |
+24.56 |
1,656.76 |
+1.50% |
|
52 Wk Highs |
239 |
|
|
52 Wk Highs |
150 |
|
|
S&P 600 |
+12.29 |
1,001.12 |
+1.24% |
|
52 Wk Lows |
46 |
|
|
52 Wk Lows |
53 |
|
|
 |
Nasdaq Composite Index Rallied for New All-Time High
Kenneth J. Gruneisen - Passed the CAN SLIM® Master's Exam
The Dow climbed 407 points, while the S&P 500 rallied 1.5%, its best one-day performance since August. The Nasdaq Composite was up 2.1%, notching a new all-time closing high. Advancers led decliners by more than a 5-2 margin on the NYSE and 11-5 on the Nasdaq exchange. The reported volume totals were mixed, lighter than the prior session total on the NYSE and higher on the Nasdaq exchange. There were 96 high-ranked companies from the Leaders List that hit a new 52-week high and were listed on the BreakOuts Page, versus the total of 29 on the prior session. New 52-week highs totals expanded and easily outnumbered shrinking new 52-week lows on the NYSE and on the Nasdaq exchange. The major indices' (M criteria) uptrend recently came under pressure. Disciplined investors buy individual stocks on a case-by-case basis only if all key criteria are met. The Featured Stocks Page provides the most timely analysis on high-ranked leaders. Charts used courtesy of www.stockcharts.com
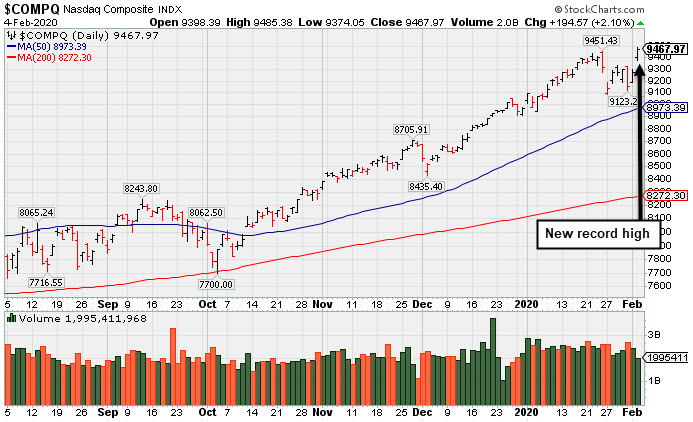
PICTURED: The Nasdaq Composite Index hit a new record high.
Stocks finished firmly higher on Tuesday, with all three major U.S. equity benchmarks recouping their year-to-date gains. This built on Monday’s upbeat session, during which U.S. equities rebounded from last week’s slump. Risk sentiment was boosted after a report from ISM showed U.S. manufacturing activity expanded last month for the first time since July. Also adding to optimism was reassurance that China’s central bank would provide monetary stimulus to support its economy amid the coronavirus outbreak.
Ten of 11 S&P 500 sectors closed in positive territory, with Utilities the sole laggard. Technology shares paced gains, with Apple (AAPL +3.30%) rose on reports its major Chinese suppliers would resume full-scale operations on February 10. Elsewhere, Tesla (TSLA +13.73%) added to Monday’s nearly 20% surge, its largest one-day advance since May 2013. Amazon (AMZN +2.27%) rose, closing above the coveted $1 trillion market cap for the first time. In earnings, Google parent Alphabet (GOOGL -2.51%) fell after its holiday-quarter revenue fell short of Wall Street expectations.
Treasuries declined amid the perceived “risk on” mood. The yield on the 10-year note was up eight basis points to 1.60%. In commodities, WTI crude fell 1% to $49.61/barrel. COMEX gold declined 1.5% to $1,553.30/ounce, while copper snapped a 14-day losing streak. On the data front, factory orders advanced 1.8% in December, the biggest jump since August 2018. |
 Kenneth J. Gruneisen started out as a licensed stockbroker in August 1987, a couple of months prior to the historic stock market crash that took the Dow Jones Industrial Average down -22.6% in a single day. He has published daily fact-based fundamental and technical analysis on high-ranked stocks online for two decades. Through FACTBASEDINVESTING.COM, Kenneth provides educational articles, news, market commentary, and other information regarding proven investment systems that work in good times and bad.
Comments contained in the body of this report are technical opinions only and are not necessarily those of Gruneisen Growth Corp. The material herein has been obtained from sources believed to be reliable and accurate, however, its accuracy and completeness cannot be guaranteed. Our firm, employees, and customers may effect transactions, including transactions contrary to any recommendation herein, or have positions in the securities mentioned herein or options with respect thereto. Any recommendation contained in this report may not be suitable for all investors and it is not to be deemed an offer or solicitation on our part with respect to the purchase or sale of any securities. |
|
 |
Tech, Energy, Retail, and Financial Groups Rose
Kenneth J. Gruneisen - Passed the CAN SLIM® Master's Exam
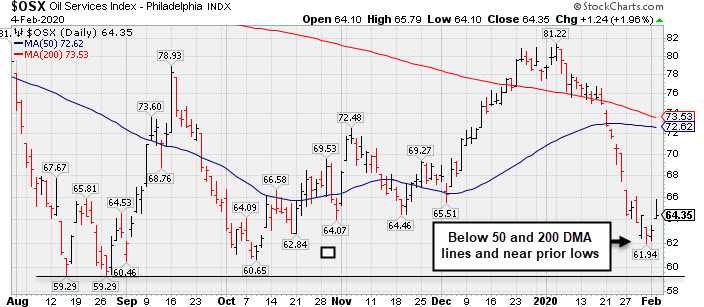
The Broker/Dealer Index ($XBD +2.16%), Bank Index ($BKX +1.61%), and the Retail Index ($RLX +1.88%) rose. The Semiconductor Index ($SOX +3.12%), Networking Index ($NWX +1.35%), and the Biotech Index ($BTK +2.42%) posted unanimous gains. Energy-linked groups had a positive bias as the Oil Services Index ($OSX +1.96%) and the Integrated Oil Index ($XOI +0.74%) rose. The Gold & Silver Index ($XAU -1.21%) was a standout decliner.
PICTURED: The Oil Services Index ($OSX +1.96%) posted a gain today after slumping well below its 50 and 200 DMA lines near the prior lows.
| Oil Services |
$OSX |
64.35 |
+1.24 |
+1.96% |
-17.81% |
| Integrated Oil |
$XOI |
1,103.64 |
+8.08 |
+0.74% |
-13.14% |
| Semiconductor |
$SOX |
1,868.65 |
+56.47 |
+3.12% |
+1.03% |
| Networking |
$NWX |
565.14 |
+7.52 |
+1.35% |
-3.13% |
| Broker/Dealer |
$XBD |
298.98 |
+6.32 |
+2.16% |
+2.96% |
| Retail |
$RLX |
2,564.35 |
+47.27 |
+1.88% |
+4.70% |
| Gold & Silver |
$XAU |
101.71 |
-1.25 |
-1.21% |
-4.87% |
| Bank |
$BKX |
107.39 |
+1.70 |
+1.61% |
-5.27% |
| Biotech |
$BTK |
5,012.64 |
+118.25 |
+2.42% |
-1.08% |
|
|
|
 |
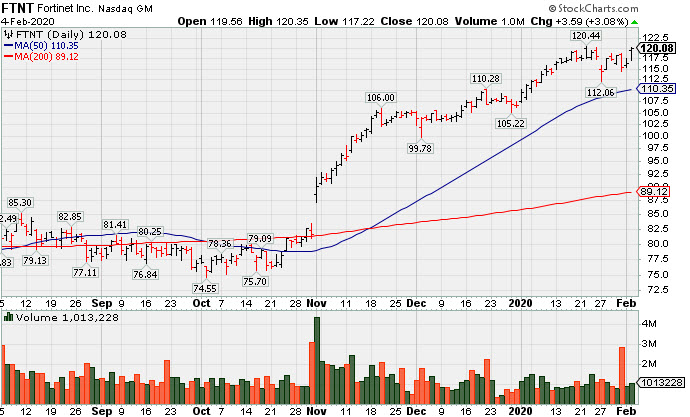
Fortinet Posted Gain for Best-Ever Close
Kenneth J. Gruneisen - Passed the CAN SLIM® Master's Exam
Fortinet Inc (FTNT+$3.59 or +3.08% to $120.08) posted a gain with near average volume today for a best-ever close. It is very extended from any sound base. Its 50-day moving average (DMA) line ($110.35) defines important near-term support to watch. It wedged higher with recent gains lacking great volume conviction.
Keep in mind it is due to report earnings news after the close on Thursday 2/06/20. Volume and volatility often increase near earnings news. It reported earnings +37% on +21% sales revenues for the Sep '19 quarter versus the year ago period, its 7th consecutive quarterly comparison with earnings above the +25% minimum guideline (C criteria). Annual earnings (A criteria) have been improving since FY '14, also helping it match with the fact-based investment system's guidelines.
FTNT was highlighted in yellow with new pivot point cited based on its 4/16/19 high plus 10 cents in the 11/11/19 mid-day report (read here). It was last shown in this FSU section on 1/14/20 with an annotated graph under the headline, "Extended From Base After Wedging Higher".
The number of top-rated funds owning its shares rose from 960 in Jun '18 to 1,541 in Dec '19, a reassuring sign concerning the I criteria. Its current Up/Down Volume ratio of 1.2 is an unbiased indication its shares have been under accumulation over the past 50 days. It has a Timeliness rating of A and Sponsorship rating of B.
Charts courtesy of www.stockcharts.com
 |
|
|
Color Codes Explained :
Y - Better candidates highlighted by our
staff of experts.
G - Previously featured
in past reports as yellow but may no longer be buyable under the
guidelines.
***Last / Change / Volume data in this table is the closing quote data***
Symbol/Exchange
Company Name
Industry Group |
PRICE |
CHANGE
(%Change) |
Day High |
Volume
(% DAV)
(% 50 day avg vol) |
52 Wk Hi
% From Hi |
Featured
Date |
Price
Featured |
Pivot Featured |
|
Max Buy |
 FTNT
-
NASDAQ
FTNT
-
NASDAQ
Fortinet Inc
Computer Sftwr-Security
|
$120.08
|
+3.59
3.08% |
$120.35
|
1,013,228
90.63% of 50 DAV
50 DAV is 1,118,000
|
$120.44
-0.30%
|
12/9/2019
|
$103.85
|
PP = $106.10
|
|
MB = $111.41
|
 Most Recent Note - 2/4/2020 5:22:55 PM
G -Posted a solid gain today with average volume for a best-ever close. Very extended from any sound base. Its 50 DMA line ($110) defines important near-term support to watch. See the latest FSU analysis for more details and a new annotated graph.
>>> FEATURED STOCK ARTICLE : Fortinet Posted Gain for Best-Ever Close - 2/4/2020 |
View all notes |
Set NEW NOTE alert |
Company Profile |
SEC
News |
Chart |
Request a new note
C
A
S
I |
SPSC
-
NASDAQ
S P S Commerce Inc
COMPUTER SOFTWARE and SERVICES - Application Software
|
$58.67
|
+1.10
1.91% |
$59.16
|
150,494
85.61% of 50 DAV
50 DAV is 175,800
|
$59.98
-2.18%
|
11/29/2019
|
$56.59
|
PP = $59.24
|
|
MB = $62.20
|
Most Recent Note - 2/3/2020 5:12:35 PM
Y - Found support near its 50 DMA line ($56.71) today after 6 consecutive small losses. Still perched near its all-time high. Subsequent gains above its pivot point backed by at least +40% above average volume are needed to trigger a new technical buy signal. Fundamentals remain strong. Its current Relative Strength Rating of 77 is below the 80+ minimum guideline for buy candidates. See the latest FSU analysis for more details and a new annotated graph.
>>> FEATURED STOCK ARTICLE : Perched Near High Finding Support at 50-Day Average - 2/3/2020 |
View all notes |
Set NEW NOTE alert |
Company Profile |
SEC
News |
Chart |
Request a new note
C
A
S
I |
AUDC
-
NASDAQ
Audiocodes Ltd
ELECTRONICS - Scientific and Technical Instrum
|
$21.95
|
+0.82
3.88% |
$22.64
|
512,976
160.31% of 50 DAV
50 DAV is 320,000
|
$28.73
-23.60%
|
9/13/2019
|
$19.68
|
PP = $19.84
|
|
MB = $20.83
|
Most Recent Note - 1/31/2020 5:42:20 PM
G - Suffered another volume-driven loss today. A subsequent rebound above its 50 DMA line ($25.07) is needed for its outlook to improve after damaging volume-driven losses triggered technical sell signals. Fundamentals remain strong.
>>> FEATURED STOCK ARTICLE : Showed Resilience With Close in Upper Third of Intra-day Range - 1/27/2020 |
View all notes |
Set NEW NOTE alert |
Company Profile |
SEC
News |
Chart |
Request a new note
C
A
S
I |
CHDN
-
NASDAQ
Churchill Downs Inc
LEISURE - Gaming Activities
|
$152.12
|
+3.56
2.40% |
$152.40
|
246,771
113.20% of 50 DAV
50 DAV is 218,000
|
$149.27
1.91%
|
10/8/2019
|
$129.77
|
PP = $132.83
|
|
MB = $139.47
|
Most Recent Note - 2/4/2020 5:28:15 PM
G - Stubbornly held its ground and hit a new 52-week high with today's 2nd consecutive gain on near average volume. Its 50 DMA line ($136.75) defines near-term support above the prior low ($132.55 on 1/03/19) The Jun and Sep '19 quarterly earnings versus the year ago periods were both below the +25% minimum guideline (C criteria) and raised fundamental concerns.
>>> FEATURED STOCK ARTICLE : Reversal From High Following 5 Gains With Light Volume - 1/21/2020 |
View all notes |
Set NEW NOTE alert |
Company Profile |
SEC
News |
Chart |
Request a new note
C
A
S
I |
LULU
-
NASDAQ
Lululemon Athletica
MANUFACTURING - Textile Manufacturing
|
$247.99
|
+1.62
0.66% |
$250.10
|
1,353,845
70.51% of 50 DAV
50 DAV is 1,920,000
|
$247.70
0.12%
|
9/6/2019
|
$201.25
|
PP = $194.35
|
|
MB = $204.07
|
Most Recent Note - 1/30/2020 5:36:36 PM
G - Extended from any sound base and hovering near its all-time high with volume totals cooling. Its 50 DMA line ($231) and prior low ($218.18 on 12/12/19) define important near-term support to watch. Fundamentals remain strong. See the latest FSU analysis for more details and a new annotated graph.
>>> FEATURED STOCK ARTICLE : Volume Totals Cooling While Hovering Near All-Time High - 1/30/2020 |
View all notes |
Set NEW NOTE alert |
Company Profile |
SEC
News |
Chart |
Request a new note
C
A
S
I |
Symbol/Exchange
Company Name
Industry Group |
PRICE |
CHANGE
(%Change) |
Day High |
Volume
(% DAV)
(% 50 day avg vol) |
52 Wk Hi
% From Hi |
Featured
Date |
Price
Featured |
Pivot Featured |
|
Max Buy |
CPRT
-
NASDAQ
Copart Inc
SPECIALTY RETAIL - Auto Dealerships
|
$102.65
|
+1.85
1.84% |
$103.17
|
1,061,012
59.01% of 50 DAV
50 DAV is 1,798,000
|
$104.00
-1.30%
|
1/2/2020
|
$92.80
|
PP = $92.51
|
|
MB = $97.14
|
Most Recent Note - 2/4/2020 5:30:26 PM
G - Perched near its all-time high after a gain today with light volume, extended from any sound base. Its 50 DMA line ($93.22) defines near-term support above prior highs in the $91-92 area. Fundamentals remain strong.
>>> FEATURED STOCK ARTICLE : New High With Yet Another Gain Backed by Light Volume - 1/28/2020 |
View all notes |
Set NEW NOTE alert |
Company Profile |
SEC
News |
Chart |
Request a new note
C
A
S
I |
NMIH
-
NASDAQ
N M I Holdings Inc Cl A
Finance-MrtgandRel Svc
|
$33.17
|
+0.38
1.16% |
$33.73
|
469,714
96.45% of 50 DAV
50 DAV is 487,000
|
$35.79
-7.32%
|
11/8/2019
|
$32.89
|
PP = $31.44
|
|
MB = $33.01
|
Most Recent Note - 1/31/2020 5:40:39 PM
G - Still sputtering and a rebound above the 50 DMA line ($33.07) is needed for its outlook to improve. Testing prior highs in the $31 area which are the next important near-term support line. Fundamentals remain strong. See the latest FSU analysis for more details and a new annotated graph.
>>> FEATURED STOCK ARTICLE : Sputtering Below 50-Day Moving Average Line Hurts Outlook - 1/31/2020 |
View all notes |
Set NEW NOTE alert |
Company Profile |
SEC
News |
Chart |
Request a new note
C
A
S
I |
SPLK
-
NASDAQ
Splunk Inc
Computer Sftwr-Database
|
$167.81
|
+7.93
4.96% |
$168.42
|
1,875,306
95.34% of 50 DAV
50 DAV is 1,967,000
|
$161.49
3.91%
|
11/25/2019
|
$147.79
|
PP = $142.16
|
|
MB = $149.27
|
Most Recent Note - 2/3/2020 5:11:13 PM
G - Posted a solid gain today with light volume for its second best ever close. Volume totals have been cooling while consolidating and it is extended from the previously noted base. Its 50 DMA line ($150.68) and prior highs in the $142-143 area define important support to watch on pullbacks.
>>> FEATURED STOCK ARTICLE : Volume Totals Cooling While Hovering Near All-Time High - 1/29/2020 |
View all notes |
Set NEW NOTE alert |
Company Profile |
SEC
News |
Chart |
Request a new note
C
A
S
I |
PAYC
-
NYSE
Paycom Software Inc
COMPUTER SOFTWARE and SERVICES - Application Software
|
$337.74
|
+14.27
4.41% |
$337.99
|
1,034,906
127.45% of 50 DAV
50 DAV is 812,000
|
$325.76
3.68%
|
11/20/2019
|
$252.97
|
PP = $259.81
|
|
MB = $272.80
|
Most Recent Note - 2/4/2020 5:26:04 PM
G - Due to report earnings news after the close on Wednesday, 2/05/20. Hit another new all-time high today. It has been stubbornly holding its ground after getting extended from any sound base. Its prior high ($279.95 on 11/27/19) and its 50 DMA line ($281) define important near-term support levels to watch on pullbacks. Fundamentals remain strong.
>>> FEATURED STOCK ARTICLE : Gapped Up for New High But Ended Near Session Low - 1/23/2020 |
View all notes |
Set NEW NOTE alert |
Company Profile |
SEC
News |
Chart |
Request a new note
C
A
S
I |
BLD
-
NYSE
Topbuild Corp
Bldg-Constr Prds/Misc
|
$112.00
|
-1.52
-1.34% |
$114.87
|
243,617
87.95% of 50 DAV
50 DAV is 277,000
|
$119.99
-6.66%
|
12/9/2019
|
$109.71
|
PP = $113.84
|
|
MB = $119.53
|
Most Recent Note - 1/31/2020 5:43:24 PM
Y - Consolidating near its 52-week high following volume-driven gains. Prior high ($113.74) defines near-term support above its 50 DMA line ($108.33).
>>> FEATURED STOCK ARTICLE : Fifth Consecutive Gain Leaves TopBuild Near 52-Week High - 1/17/2020 |
View all notes |
Set NEW NOTE alert |
Company Profile |
SEC
News |
Chart |
Request a new note
C
A
S
I |
Symbol/Exchange
Company Name
Industry Group |
PRICE |
CHANGE
(%Change) |
Day High |
Volume
(% DAV)
(% 50 day avg vol) |
52 Wk Hi
% From Hi |
Featured
Date |
Price
Featured |
Pivot Featured |
|
Max Buy |
TEAM
-
NASDAQ
Atlassian Corp Plc Cl A
Comp Sftwr-Spec Enterprs
|
$152.09
|
+2.69
1.80% |
$152.69
|
1,521,440
99.90% of 50 DAV
50 DAV is 1,523,000
|
$151.87
0.14%
|
1/24/2020
|
$144.66
|
PP = $140.49
|
|
MB = $147.51
|
Most Recent Note - 2/4/2020 5:33:49 PM
G - Color code is changed to green after it posted a gain with average volume today for a new all-time high above its "max buy" level. Rallied from a cup-with-handle base pattern with volume +514% above average behind the considerable gain on 1/24/20 triggering a technical buy signal. Bullish action came after it reported earnings +48% on +37% sales revenues for the Dec '19 quarter.
>>> FEATURED STOCK ARTICLE : Gapped Up Today Following Another Strong Earnings Report - 1/24/2020 |
View all notes |
Set NEW NOTE alert |
Company Profile |
SEC
News |
Chart |
Request a new note
C
A
S
I |
GLOB
-
NYSE
Globant SA
Computer-Tech Services
|
$126.63
|
+2.15
1.73% |
$128.36
|
204,335
74.85% of 50 DAV
50 DAV is 273,000
|
$131.00
-3.34%
|
11/14/2019
|
$106.87
|
PP = $112.43
|
|
MB = $118.05
|
Most Recent Note - 1/31/2020 5:46:09 PM
G - Pulling back this week after wedging to new highs with recent gains lacking great volume conviction. Its prior high ($112.33) and 50 DMA line ($109.36) define important near-term support to watch. Fundamentals remain strong.
>>> FEATURED STOCK ARTICLE : Gain for New High Today Backed by Only +12% Above Average Volume - 1/15/2020 |
View all notes |
Set NEW NOTE alert |
Company Profile |
SEC
News |
Chart |
Request a new note
C
A
S
I |
STNE
-
NASDAQ
Stoneco Ltd Cl A
Finance-CrdtCard/PmtPr
|
$43.14
|
-2.16
-4.77% |
$44.99
|
4,359,806
216.47% of 50 DAV
50 DAV is 2,014,000
|
$45.72
-5.64%
|
1/22/2020
|
$43.94
|
PP = $45.72
|
|
MB = $48.01
|
Most Recent Note - 2/4/2020 12:23:53 PM
Y - Touched a new all-time high with on the prior session with a big gain backed by near average volume. Its 50 DMA line ($40.62) defines near-term support. Subsequent gains above the pivot point backed by at least +40% above average volume are needed to trigger a proper technical buy signal.
>>> FEATURED STOCK ARTICLE : Perched Near High With Best-Ever Close After Volume-Driven Gain - 1/22/2020 |
View all notes |
Set NEW NOTE alert |
Company Profile |
SEC
News |
Chart |
Request a new note
C
A
S
I |
|
|
|
THESE ARE NOT BUY RECOMMENDATIONS!
Comments contained in the body of this report are technical
opinions only. The material herein has been obtained
from sources believed to be reliable and accurate, however,
its accuracy and completeness cannot be guaranteed.
This site is not an investment advisor, hence it does
not endorse or recommend any securities or other investments.
Any recommendation contained in this report may not
be suitable for all investors and it is not to be deemed
an offer or solicitation on our part with respect to
the purchase or sale of any securities. All trademarks,
service marks and trade names appearing in this report
are the property of their respective owners, and are
likewise used for identification purposes only.
This report is a service available
only to active Paid Premium Members.
You may opt-out of receiving report notifications
at any time. Questions or comments may be submitted
by writing to Premium Membership Services 665 S.E. 10 Street, Suite 201 Deerfield Beach, FL 33441-5634 or by calling 1-800-965-8307
or 954-785-1121.
|
|
|