You are not logged in.
This means you
CAN ONLY VIEW reports that were published prior to Monday, February 19, 2024.
You
MUST UPGRADE YOUR MEMBERSHIP if you want to see any current reports.
AFTER MARKET UPDATE - THURSDAY, FEBRUARY 3RD, 2022
Previous After Market Report Next After Market Report >>>
|
|
|
|
DOW |
-518.17 |
35,111.16 |
-1.45% |
|
Volume |
906,387,092 |
-8% |
|
Volume |
4,258,671,200 |
-7% |
|
NASDAQ |
-538.73 |
13,878.82 |
-3.74% |
|
Advancers |
586 |
18% |
|
Advancers |
995 |
23% |
|
S&P 500 |
-111.94 |
4,477.44 |
-2.44% |
|
Decliners |
2,658 |
82% |
|
Decliners |
3,254 |
77% |
|
Russell 2000 |
-38.48 |
1,991.03 |
-1.90% |
|
52 Wk Highs |
56 |
|
|
52 Wk Highs |
38 |
|
|
S&P 600 |
-18.88 |
1,283.49 |
-1.45% |
|
52 Wk Lows |
150 |
|
|
52 Wk Lows |
237 |
|
|
Disciplined investors will note Monday's follow-through day in the market (M criteria) confirmed a new uptrend. New buying efforts may be made in stocks fitting all key criteria of the fact-based investment system.
|
 |
Breadth Negative as Major Indices Fell With Lighter Volume Totals
Kenneth J. Gruneisen - Passed the CAN SLIM® Master's Exam
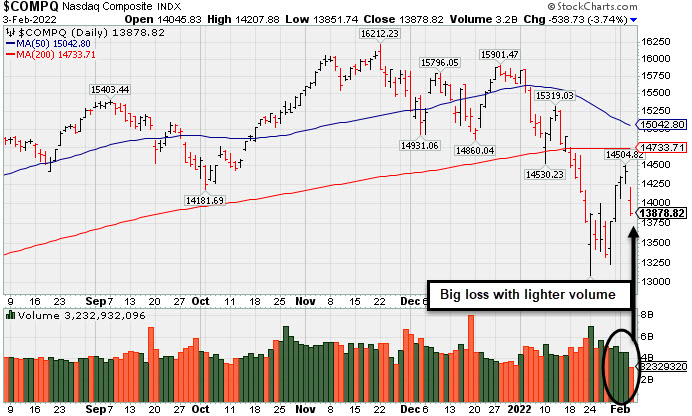
The Nasdaq Composite dropped 3.7%, while the mega-cap Nasdaq 100 suffered its worst session since September 2020 (-4.2%). The S&P 500 lost 2.4%, but remains in positive territory for the week as the broad benchmark notched a four-session advance of nearly 6% through Wednesday—its strongest such rally since November 2020. The Dow lost 518 points. Volume totals reported were lighter than the prior session on the NYSE and on the Nasdaq exchange, indicative of less distributional selling pressure from the institutional crowd. Decliners led advancers by more than a 4-1 margin on the NYSE and more than 3-1 on the Nasdaq exchange. There were 16 high-ranked companies from the Leaders List that hit new 52-week highs and were listed on the BreakOuts Page, versus 21 on the prior session. New 52-week lows outnumbered new highs on the NYSE and on the Nasdaq exchange. A follow-through day on Monday, January 31st confirmed a new uptrend for the market averages (M criteria). PICTURED: The Nasdaq Composite Index pulled back with lighter volume after 4 consecutive gains on higher volume while rebounding toward its 200-day moving average (DMA) line.
U.S. stocks finished lower on Thursday as disappointing quarterly results from tech-related companies dampened demand for growth-related shares. Ten of 11 S&P 500 sectors closed in negative territory, with Communication Services leading the decline. Facebook parent Meta Platforms Inc. (FB -26.4%) gapped down - shedding more than $250 billion in market value - on soft guidance and a drop user engagement. Spotify Technology (SPOT -16.76%) fell following lower-than-expected subscriber growth, while semiconductor manufacturer Qualcomm Inc.’s (QCOM -4.84%) results also underwhelmed. Meanwhile, T-Mobile Inc. (TMUS +10.22%) gapped up after reporting a profit tally that doubled analyst expectations.
On the data front, weekly initial jobless claims came in at 238,000, easing from the previous 261,000 figure. Separately, the Institute for Supply Management (ISM) revealed that U.S. services sector growth slowed to its lowest level in 11 months in January, with the purchasing managers’ index (PMI) slipping to 59.9 from December’s 62.3 print.
Treasuries weakened following perceived hawkish tilts from global central banks, with the yield on the 10-year note up six basis points (0.06%) to 1.83%. Across the pond, the Bank of England announced back-to-back rate increases for the first time since 2004, while the European Central Bank left rates unchanged but opened the door for future hikes throughout 2022, highlighting inflation concerns. |
 Kenneth J. Gruneisen started out as a licensed stockbroker in August 1987, a couple of months prior to the historic stock market crash that took the Dow Jones Industrial Average down -22.6% in a single day. He has published daily fact-based fundamental and technical analysis on high-ranked stocks online for two decades. Through FACTBASEDINVESTING.COM, Kenneth provides educational articles, news, market commentary, and other information regarding proven investment systems that work in good times and bad.
Comments contained in the body of this report are technical opinions only and are not necessarily those of Gruneisen Growth Corp. The material herein has been obtained from sources believed to be reliable and accurate, however, its accuracy and completeness cannot be guaranteed. Our firm, employees, and customers may effect transactions, including transactions contrary to any recommendation herein, or have positions in the securities mentioned herein or options with respect thereto. Any recommendation contained in this report may not be suitable for all investors and it is not to be deemed an offer or solicitation on our part with respect to the purchase or sale of any securities. |
|
 |
Retail and Semiconductor Indexes Led Broader Losses
Kenneth J. Gruneisen - Passed the CAN SLIM® Master's Exam
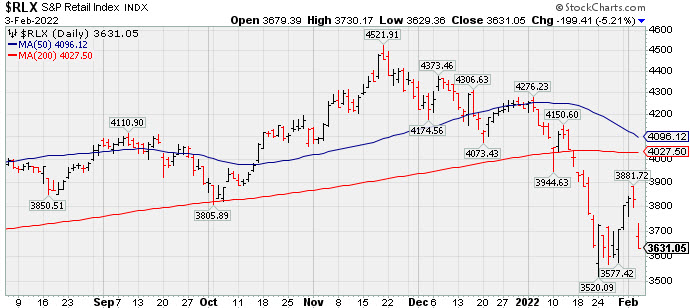
The Retail Index ($RLX -5.21%) suffered a big loss that weighed on the major averages. The Broker/Dealer Index ($XBD -1.22%) and Bank Index ($BKX -1.04%) both fell. The Semiconductor Index ($SOX -4.58%) led the tech sector lower while the Networking Index ($NWX -2.56%) and Biotech Index ($BTK -1.83%) also slumped. Commodity-linked groups also had a negative bias as the Gold & Silver Index ($XAU -1.67%) outpaced the Oil Services Index ($OSX -1.17%) and Integrated Oil Index ($XOI -0.87%) to the downside.
PICTURED: The Retail Index ($RLX -5.21%) suffered a big loss after recently rebounding toward its 200-day moving average (DMA) line.
| Oil Services |
$OSX |
65.52 |
-0.78 |
-1.17% |
+24.28% |
| Integrated Oil |
$XOI |
1,424.03 |
-12.53 |
-0.87% |
+20.86% |
| Semiconductor |
$SOX |
3,432.55 |
-164.62 |
-4.58% |
-13.02% |
| Networking |
$NWX |
849.27 |
-22.29 |
-2.56% |
-12.54% |
| Broker/Dealer |
$XBD |
483.00 |
-5.96 |
-1.22% |
-0.79% |
| Retail |
$RLX |
3,631.05 |
-199.41 |
-5.21% |
-14.09% |
| Gold & Silver |
$XAU |
124.13 |
-2.11 |
-1.67% |
-6.28% |
| Bank |
$BKX |
137.30 |
-1.45 |
-1.04% |
+3.84% |
| Biotech |
$BTK |
5,032.23 |
-93.94 |
-1.83% |
-8.81% |
|
|
|
 |
Bullish Action Followed Another Strong Quarterly Report
Kenneth J. Gruneisen - Passed the CAN SLIM® Master's Exam
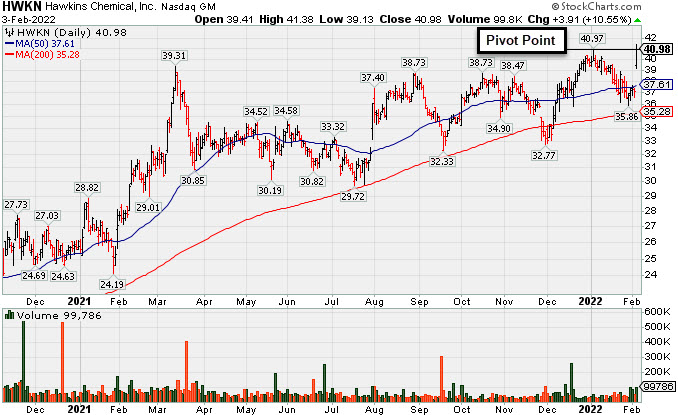
Hawkins Inc (HWKN +$3.91 or +10.55% to $40.98) was highlighted in yellow with pivot point cited based on its 1/04/22 high plus 10 cents in the earlier mid-day report (read here). It gapped up today rebounding above its 50-day moving average (DMA) line ($37.59) and hitting a new all-time high. Subsequent gains and a strong close above the pivot point backed by at least +40% above average volume may trigger a convincing technical buy signal.
Bullish action came after it reported Dec '21 quarterly earnings +26% on +31% sales revenues versus the year ago period. Three of the 4 latest quarterly comparisons showed earnings increases above the +25% minimum guideline (C criteria) with a strong sales revenues growth rate. Annual earnings growth (A criteria) has been strong after a downturn in FY '18. It has an Earnings Per Share Rating of 89.
There are only 21.1 million shares outstanding (S criteria) which contribute to greater price volatility in the event of institutional buying or selling. The number of top-rated funds owning its shares rose from 326 in Mar '21 to 340 in Dec '21, a reassuring sign concerning the I criteria. The current Up/Down Volume Ratio of 1.7 is an unbiased indication its shares have been under accumulation over the past 50 days. The company hails from the CHEMICALS - Basic Chemicals industry group which is currently ranked 59th on the 187 Industry Groups list (L criteria). It has a Timeliness Rating of B and Sponsorship Rating of C.
|
|
|
Color Codes Explained :
Y - Better candidates highlighted by our
staff of experts.
G - Previously featured
in past reports as yellow but may no longer be buyable under the
guidelines.
***Last / Change / Volume data in this table is the closing quote data***
Symbol/Exchange
Company Name
Industry Group |
PRICE |
CHANGE
(%Change) |
Day High |
Volume
(% DAV)
(% 50 day avg vol) |
52 Wk Hi
% From Hi |
Featured
Date |
Price
Featured |
Pivot Featured |
|
Max Buy |
 REGN
-
NASDAQ
REGN
-
NASDAQ
Regeneron Pharmaceutical
DRUGS - Biotechnology
|
$620.69
|
-2.16
-0.35% |
$625.00
|
947,859
123.90% of 50 DAV
50 DAV is 765,000
|
$686.62
-9.60%
|
12/13/2021
|
$647.95
|
PP = $686.72
|
|
MB = $721.06
|
 Most Recent Note - 2/3/2022 5:31:49 PM
G - A rebound above the 50 DMA line ($628) still is needed for its outlook to improve. Due to report Dec '21 quarterly results before the open on Friday, 2/04/22. Volume and volatility often increase near earnings news. Recently holding its ground in a tight range above prior lows and above its 200 DMA line ($591) which define the important near-term support.
>>> FEATURED STOCK ARTICLE : Earnings News Due While Consolidating Above 200 DMA Line - 2/1/2022 |
View all notes |
Set NEW NOTE alert |
Company Profile |
SEC
News |
Chart |
Request a new note
C
A
S
I |
SF
-
NYSE
Stifel Financial Corp
FINANCIAL SERVICES - Investment Brokerage - Regiona
|
$76.09
|
-1.93
-2.47% |
$78.42
|
665,370
122.99% of 50 DAV
50 DAV is 541,000
|
$78.60
-3.19%
|
1/27/2022
|
$74.17
|
PP = $76.23
|
|
MB = $80.04
|
Most Recent Note - 2/3/2022 5:33:01 PM
Y - Pulled back today on lighter volume after matching its 52-week high with 6 consecutive gains backed by above average volume. Rising from a noted "double bottom" base. Disciplined investors may note Monday's follow-through day in the market (M criteria) confirmed a new uptrend. Bullish action has come since it reported strong results for the Dec '21 quarter versus the year ago period, its 5th strong quarterly comparison. Annual earnings (A criteria) history has been good.
>>> FEATURED STOCK ARTICLE : Formed Double Bottom Base and Faces Little Resistance - 1/27/2022 |
View all notes |
Set NEW NOTE alert |
Company Profile |
SEC
News |
Chart |
Request a new note
C
A
S
I |
TGH
-
NYSE
Textainer Group Holdings
TRANSPORTATION - Logistics
|
$38.07
|
-0.30
-0.78% |
$39.31
|
290,608
83.51% of 50 DAV
50 DAV is 348,000
|
$41.24
-7.69%
|
1/31/2022
|
$36.68
|
PP = $41.34
|
|
MB = $43.41
|
Most Recent Note - 2/3/2022 5:34:05 PM
Y - Holding its ground quietly above its 50 DMA line ($35.91) and perched within close striking distance of its 52-week high. Subsequent gains above the pivot point backed by at least +40% above average volume are needed to trigger a technical buy signal. Highlighted in yellow with pivot point cited based on its 11/05/21 high plus 10 cents in the 1/31/22 mid-day report. Disciplined investors may note a follow-through day in the market (M criteria) confirmed a new uptrend. Fundamentals remain strong.
>>> FEATURED STOCK ARTICLE : Consolidating Above 50-Day Moving Average - 1/31/2022 |
View all notes |
Set NEW NOTE alert |
Company Profile |
SEC
News |
Chart |
Request a new note
C
A
S
I |
HWKN
-
NASDAQ
Hawkins Inc
CHEMICALS - Basic Chemicals
|
$40.98
|
+3.91
10.55% |
$41.38
|
100,011
200.02% of 50 DAV
50 DAV is 50,000
|
$40.97
0.02%
|
2/3/2022
|
$39.81
|
PP = $41.07
|
|
MB = $43.12
|
Most Recent Note - 2/3/2022 5:29:59 PM
Y - Posted a solid gain today with +97% above average volume as it hit a new all-time high. It was highlighted in yellow with pivot point cited based on its 1/04/22 high plus 10 cents in the earlier mid-day report following a gap up, rebounding above its 50 DMA line ($37.61). Subsequent gains and a strong close above the pivot point backed by at least +40% above average volume may trigger a technical buy signal. Bullish action came after it reported Dec '21 quarterly earnings +26% on +31% sales revenues versus the year ago period. Three of the 4 latest quarterly comparisons showed earnings increases above the +25% minimum guideline (C criteria) with a strong sales revenues growth rate. Annual earnings growth (A criteria) has been strong after a downturn in FY '18. See the latest FSU analysis for more details and a new annotated graph.
>>> FEATURED STOCK ARTICLE : Bullish Action Followed Another Strong Quarterly Report - 2/3/2022 |
View all notes |
Set NEW NOTE alert |
Company Profile |
SEC
News |
Chart |
Request a new note
C
A
S
I |
|
|
|
THESE ARE NOT BUY RECOMMENDATIONS!
Comments contained in the body of this report are technical
opinions only. The material herein has been obtained
from sources believed to be reliable and accurate, however,
its accuracy and completeness cannot be guaranteed.
This site is not an investment advisor, hence it does
not endorse or recommend any securities or other investments.
Any recommendation contained in this report may not
be suitable for all investors and it is not to be deemed
an offer or solicitation on our part with respect to
the purchase or sale of any securities. All trademarks,
service marks and trade names appearing in this report
are the property of their respective owners, and are
likewise used for identification purposes only.
This report is a service available
only to active Paid Premium Members.
You may opt-out of receiving report notifications
at any time. Questions or comments may be submitted
by writing to Premium Membership Services 665 S.E. 10 Street, Suite 201 Deerfield Beach, FL 33441-5634 or by calling 1-800-965-8307
or 954-785-1121.
|
|
|