You are not logged in.
This means you
CAN ONLY VIEW reports that were published prior to Sunday, February 18, 2024.
You
MUST UPGRADE YOUR MEMBERSHIP if you want to see any current reports.
AFTER MARKET UPDATE - FRIDAY, FEBRUARY 1ST, 2019
Previous After Market Report Next After Market Report >>>
|
|
|
|
DOW |
+64.22 |
25,063.89 |
+0.26% |
|
Volume |
885,530,430 |
-37% |
|
Volume |
2,379,307,260 |
-18% |
|
NASDAQ |
-17.87 |
7,263.87 |
-0.25% |
|
Advancers |
1,684 |
57% |
|
Advancers |
1,761 |
58% |
|
S&P 500 |
+2.43 |
2,706.53 |
+0.09% |
|
Decliners |
1,262 |
43% |
|
Decliners |
1,285 |
42% |
|
Russell 2000 |
+2.64 |
1,502.05 |
+0.18% |
|
52 Wk Highs |
100 |
|
|
52 Wk Highs |
55 |
|
|
S&P 600 |
-0.54 |
933.58 |
-0.06% |
|
52 Wk Lows |
10 |
|
|
52 Wk Lows |
16 |
|
|
 |
Major Indices Ended Mixed But With More Leadership
Kenneth J. Gruneisen - Passed the CAN SLIM® Master's Exam
Stocks finished mixed Friday. The Dow gained 64 points to 25,063 while the S&P 500 added 2 points to 2,706. The Nasdaq Composite fell 17 points to 7,263. The volume totals were lighter than the prior session on both the NYSE and the Nasdaq exchange. Breadth was positive as advancers led decliners by a 4-3 margin on the NYSE and nearly a 3-2 margin on the Nasdaq exchange. There were 29 high-ranked companies from the Leaders List that made a new 52-week high and were listed on the BreakOuts Page, versus the total of 25 on the prior session. New 52-week highs totals solidly outnumbered new 52-week lows on the NYSE and on the Nasdaq exchange versus the prior session. The major indices are in a confirmed uptrend after recently noted improvements helped to signal a change in market direction (M criteria) back to a bullish stance. The Featured Stocks Page provides the most timely analysis on high-ranked leaders. Charts used courtesy of www.stockcharts.com
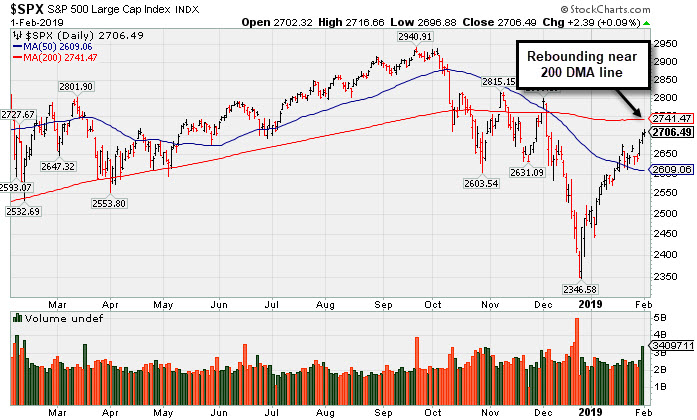
PICTURED: The S&P 500 Index is -8% off its record high, rebounding but still below its 200-day moving average (DMA) line.
The major averages fluctuated amid a robust labor market update and an influx of corporate profit tallies. The benchmarks all notched weekly advances with the Dow climbing 1.3%, the S&P 500 gaining 1.6%, and the Nasdaq adding 1.4%. On the data front, non-farm payrolls increased 304,000 in January, well above December’s downwardly revised 222,000 reading. Average hourly earnings increased 3.2% year-over-year in January while the unemployment rate climbed from 3.9% to 4.0%. A separate update from the Institute for Supply Management revealed manufacturing activity rebounded in January after posting the steepest drop in over a decade in December.
Six of 11 S&P 500 sectors ended in positive territory. Energy shares paced gains with Exxon-Mobil (XOM +3.89%) and Chevron (CVX +3.24%) rose after both oil-giants easily topped analyst profit projections. Tech stocks also outperformed with Symantec (SYMC +8.99%) rose after the cyber security firm topped earnings estimates. Consumer Discretionary was a notable underperformer with Amazon (AMZN -5.38%) fell after the e-commerce giant offered cautious sales guidance for 2019.
Treasuries weakened with the yield on the 10-year note climbing five basis points to 2.69%. In commodities, WTI crude advanced 2.9% to $55.34/barrel. COMEX gold fell 0.1% to $1,318.30/ounce. |
 Kenneth J. Gruneisen started out as a licensed stockbroker in August 1987, a couple of months prior to the historic stock market crash that took the Dow Jones Industrial Average down -22.6% in a single day. He has published daily fact-based fundamental and technical analysis on high-ranked stocks online for two decades. Through FACTBASEDINVESTING.COM, Kenneth provides educational articles, news, market commentary, and other information regarding proven investment systems that work in good times and bad.
Comments contained in the body of this report are technical opinions only and are not necessarily those of Gruneisen Growth Corp. The material herein has been obtained from sources believed to be reliable and accurate, however, its accuracy and completeness cannot be guaranteed. Our firm, employees, and customers may effect transactions, including transactions contrary to any recommendation herein, or have positions in the securities mentioned herein or options with respect thereto. Any recommendation contained in this report may not be suitable for all investors and it is not to be deemed an offer or solicitation on our part with respect to the purchase or sale of any securities. |
|
 |
Retail Index Fell While Financial, Tech, and Energy Indexes Rose
Kenneth J. Gruneisen - Passed the CAN SLIM® Master's Exam
The Retail Index ($RLX -2.54%) created a drag on the market while the Broker/Dealer Index ($XBD +1.17%) posted a gain and the Bank Index ($BKX +0.28%) edged higher. The tech sector was led higher by the Networking Index ($NWX +1.61%) and the Semiconductor Index ($SOX +1.20%) while the Biotech Index ($BTK +0.46%) posted a smaller gain. The Integrated Oil Index ($XOI +0.85%) and the Oil Services Index ($OSX +1.62%) rose while the Gold & Silver Index ($XAU -0.51%) fell.
Charts courtesy of www.stockcharts.com
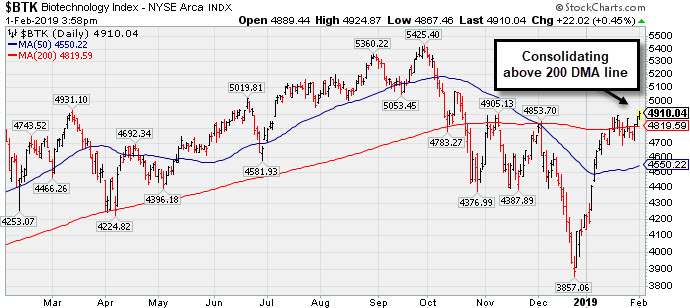 PICTURED: The Biotech Index ($BTK +0.28%) is consolidating above its 200-day moving average (DMA) line.
| Oil Services |
$OSX |
97.70 |
+1.56 |
+1.62% |
+21.22% |
| Integrated Oil |
$XOI |
1,294.87 |
+10.87 |
+0.85% |
+11.71% |
| Semiconductor |
$SOX |
1,287.40 |
+15.31 |
+1.20% |
+11.45% |
| Networking |
$NWX |
543.70 |
+8.63 |
+1.61% |
+11.26% |
| Broker/Dealer |
$XBD |
260.22 |
+3.00 |
+1.17% |
+9.64% |
| Retail |
$RLX |
2,097.12 |
-54.67 |
-2.54% |
+7.47% |
| Gold & Silver |
$XAU |
75.91 |
-0.39 |
-0.51% |
+7.43% |
| Bank |
$BKX |
96.73 |
+0.27 |
+0.28% |
+12.75% |
| Biotech |
$BTK |
4,910.29 |
+22.27 |
+0.46% |
+16.33% |
|
|
|
 |
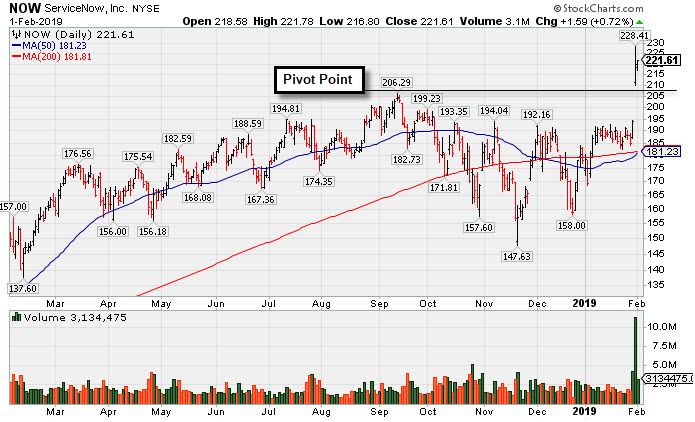
Breakaway Gap Followed Strong Earnings Report
Kenneth J. Gruneisen - Passed the CAN SLIM® Master's Exam
ServiceNow Inc (NOW +$1.49 or +0.68% to $221.51) posted another gain today and its color code was changed to green after rising above its "max buy" level. It was highlighted in yellow with pivot point cited based on its 9/13/18 high plus 10 cents when highlighted in the 1/31/19 mid-day report (read here) as it triggered a technical buy signal with a big "breakaway gap".
Bullish action came after it reported earnings +79% on +30% sales revenues for the Dec '18 quarter, continuing its strong earnings track record. Volume and volatility often increase near earnings news. Fundamentals remain strong.Prior quarterly comparisons were above the +25% minimum earnings guideline (C criteria). Annual earnings (A criteria) growth has been strong since FY '15 and it has an Earnings Per Share Rating of 98. The Computer Software - Enterprise group has a Group Relative Strength Rating of 98, a reassuring sign concerning the L criteria.
The number of top-rated funds owning its shares rose from 1,030 in Jun '17 to 1,420 in Dec '18, a reassuring sign concerning the I criteria. It has a Timeliness Rating of A and a Sponsorship Rating of B. |
|
|
Color Codes Explained :
Y - Better candidates highlighted by our
staff of experts.
G - Previously featured
in past reports as yellow but may no longer be buyable under the
guidelines.
***Last / Change / Volume data in this table is the closing quote data***
Symbol/Exchange
Company Name
Industry Group |
PRICE |
CHANGE
(%Change) |
Day High |
Volume
(% DAV)
(% 50 day avg vol) |
52 Wk Hi
% From Hi |
Featured
Date |
Price
Featured |
Pivot Featured |
|
Max Buy |
MLR
-
NYSE
Miller Industries Inc
AUTOMOTIVE - Auto Parts
|
$30.52
|
+0.47
1.56% |
$30.56
|
15,746
43.74% of 50 DAV
50 DAV is 36,000
|
$30.24
0.93%
|
11/30/2018
|
$28.35
|
PP = $29.50
|
|
MB = $30.98
|
Most Recent Note - 1/29/2019 5:43:31 PM
Y - Held its ground today with light volume. Subsequent gains above the pivot point backed by at least +40% above average volume may help clinch a proper technical buy signal. Its 50 DMA line and recent low define near-term support to watch on pullbacks. See the latest FSU analysis for more details and a new annotated graph.
>>> FEATURED STOCK ARTICLE : Traded Above Pivot Point Recently Without Great Volume - 1/29/2019 |
View all notes |
Set NEW NOTE alert |
Company Profile |
SEC
News |
Chart |
Request a new note
C
A
S
I |
LHCG
-
NASDAQ
L H C Group Inc
HEALTH SERVICES - Home Health Care
|
$106.61
|
+0.88
0.83% |
$107.13
|
584,620
224.85% of 50 DAV
50 DAV is 260,000
|
$109.33
-2.49%
|
1/23/2019
|
$107.29
|
PP = $107.61
|
|
MB = $112.99
|
 Most Recent Note - 2/1/2019 3:37:00 PM
Y - Churning above average volume today, remaining perched very near its high. Subsequent gains above the pivot point backed by at least +40% above average volume may trigger a technical buy signal.
>>> FEATURED STOCK ARTICLE : Healthcare Services Firm Reached a New High - 1/23/2019 |
View all notes |
Set NEW NOTE alert |
Company Profile |
SEC
News |
Chart |
Request a new note
C
A
S
I |
BSTC
-
NASDAQ
Biospecifics Technologie
Medical-Biomed/Biotech
|
$64.69
|
-0.29
-0.45% |
$67.85
|
51,560
132.21% of 50 DAV
50 DAV is 39,000
|
$68.00
-4.87%
|
1/18/2019
|
$67.40
|
PP = $66.31
|
|
MB = $69.63
|
Most Recent Note - 2/1/2019 3:47:06 PM
Y - Challenged its high with today's 4th consecutive gain. Thinly traded Biomed/Biotech firm has recently been sputtering below its pivot point. Confirming volume-driven gains for a new high close would be a reassuring sign of institutional accumulation.
>>> FEATURED STOCK ARTICLE : Thinly Traded Biotech Shows Signs of Accumulation - 1/18/2019 |
View all notes |
Set NEW NOTE alert |
Company Profile |
SEC
News |
Chart |
Request a new note
C
A
S
I |
UBNT
-
NASDAQ
Ubiquiti Networks
TELECOMMUNICATIONS - Diversified Communication Serv
|
$109.59
|
+1.38
1.28% |
$110.85
|
298,620
87.83% of 50 DAV
50 DAV is 340,000
|
$115.44
-5.07%
|
11/9/2018
|
$108.20
|
PP = $101.43
|
|
MB = $106.50
|
Most Recent Note - 1/31/2019 5:59:57 PM
G - Still quietly consolidating above its 50 DMA line ($105.10). Faces some resistance due to overhead supply up to the $115 level. Prior low ($92.08 on 12/24/18) defines the next important support. See the latest FSU analysis for more details and a new annotated graph.
>>> FEATURED STOCK ARTICLE : Consolidating Above 50-Day Moving Average - 1/31/2019 |
View all notes |
Set NEW NOTE alert |
Company Profile |
SEC
News |
Chart |
Request a new note
C
A
S
I |
NOW
-
NYSE
Servicenow Inc
Computer Sftwr-Enterprse
|
$221.51
|
+1.49
0.68% |
$221.84
|
3,522,641
153.89% of 50 DAV
50 DAV is 2,289,000
|
$228.41
-3.02%
|
1/31/2019
|
$218.14
|
PP = $206.40
|
|
MB = $216.72
|
Most Recent Note - 2/1/2019 5:06:59 PM
G - Color code is changed to green after rising above its "max buy" level. Highlighted in yellow with pivot point cited based on its 9/13/18 high plus 10 cents when highlighted in the 1/31/19 mid-day report as it triggered a technical buy signal with a big "breakaway gap". Bullish action came after it reported earnings +79% on +30% sales revenues for the Dec '18 quarter, continuing its strong earnings track record. Prior mid-day report noted - "Volume and volatility often increase near earnings news." See the latest FSU analysis for more details and a new annotated graph.
>>> FEATURED STOCK ARTICLE : Breakaway Gap Followed Strong Earnings Report - 2/1/2019 |
View all notes |
Set NEW NOTE alert |
Company Profile |
SEC
News |
Chart |
Request a new note
C
A
S
I |
Symbol/Exchange
Company Name
Industry Group |
PRICE |
CHANGE
(%Change) |
Day High |
Volume
(% DAV)
(% 50 day avg vol) |
52 Wk Hi
% From Hi |
Featured
Date |
Price
Featured |
Pivot Featured |
|
Max Buy |
PYPL
-
NASDAQ
Paypal Holdings Inc
Finance-CrdtCard/PmtPr
|
$90.01
|
+1.25
1.41% |
$90.50
|
10,445,007
110.92% of 50 DAV
50 DAV is 9,417,000
|
$94.58
-4.83%
|
1/24/2019
|
$92.56
|
PP = $93.80
|
|
MB = $98.49
|
Most Recent Note - 1/31/2019 1:07:09 PM
Y - Gapped down today after reporting +25% earnings on +13% sales revenues for the Dec '18 quarter. Volume and volatility often increase near earnings news. Disciplined investors note that the recent gains above the pivot point lacked the +40% above average volume needed to trigger a proper technical buy signal.
>>> FEATURED STOCK ARTICLE : Perched Within Striking Distance of High Ahead of Earnings News - 1/24/2019 |
View all notes |
Set NEW NOTE alert |
Company Profile |
SEC
News |
Chart |
Request a new note
C
A
S
I |
ALRM
-
NASDAQ
Alarm.com Holdings Inc
Security/Sfty
|
$62.33
|
-0.60
-0.95% |
$63.52
|
622,297
127.52% of 50 DAV
50 DAV is 488,000
|
$63.72
-2.18%
|
1/22/2019
|
$60.52
|
PP = $60.30
|
|
MB = $63.32
|
Most Recent Note - 1/29/2019 5:50:03 PM
Y - Volume was light today while staying perched at its all-time high. Recent gains for new highs lacked great volume conviction. Prior highs define initial support to watch on pullbacks.
>>> FEATURED STOCK ARTICLE : Pullback Broke Steak of Gains and Reversed From New High - 1/22/2019 |
View all notes |
Set NEW NOTE alert |
Company Profile |
SEC
News |
Chart |
Request a new note
C
A
S
I |
PLNT
-
NYSE
Planet Fitness Inc Cl A
Leisure-Services
|
$57.99
|
+0.07
0.12% |
$59.08
|
1,580,084
130.05% of 50 DAV
50 DAV is 1,215,000
|
$59.52
-2.57%
|
11/7/2018
|
$57.10
|
PP = $55.45
|
|
MB = $58.22
|
Most Recent Note - 1/30/2019 8:21:44 PM
Y - Still consolidating below its "max buy" level and holding its ground in a tight range near its all-time high. Its 50 DMA line ($55.04) defines important near-term support to watch above the recent low ($48).
>>> FEATURED STOCK ARTICLE : Hovering in a Tight Range Near All-Time High - 1/25/2019 |
View all notes |
Set NEW NOTE alert |
Company Profile |
SEC
News |
Chart |
Request a new note
C
A
S
I |
TEAM
-
NASDAQ
Atlassian Corp Plc Cl A
Comp Sftwr-Spec Enterprs
|
$98.98
|
+0.58
0.59% |
$101.76
|
2,084,033
121.66% of 50 DAV
50 DAV is 1,713,000
|
$100.00
-1.02%
|
1/7/2019
|
$94.68
|
PP = $98.31
|
|
MB = $103.23
|
Most Recent Note - 1/31/2019 1:09:49 PM
Y - Volume is running at an above average pace today while matching its all-time high. Subsequent gains and a strong close above the pivot point backed by at least +40% above average volume may help to clinch a convincing technical buy signal. Its 50 DMA line ($86.21) and prior low define near-term support to watch on pullbacks. Fundamentals remain strong.
>>> FEATURED STOCK ARTICLE : Volume Light While Hovering Near High - 1/28/2019 |
View all notes |
Set NEW NOTE alert |
Company Profile |
SEC
News |
Chart |
Request a new note
C
A
S
I |
MEDP
-
NASDAQ
Medpace Holdings Inc
Medical-Research Eqp/Svc
|
$65.73
|
+1.33
2.07% |
$66.83
|
908,081
121.89% of 50 DAV
50 DAV is 745,000
|
$65.09
0.98%
|
1/30/2019
|
$64.10
|
PP = $65.19
|
|
MB = $68.45
|
Most Recent Note - 2/1/2019 4:55:41 PM
Y - Wedged to a new 52-week high with +22% above average volume behind today's 3rd consecutive gain. Pivot point cited is based on its 9/17/18 high plus 10 cents. Subsequent gains above the pivot point backed by at least +40% above average volume may trigger a technical buy signal. Fundamentals remain strong. The 200 DMA line acted as support above the prior low and it has rebounded since dropped from the Featured Stocks list on 12/19/18. See the latest FSU analysis for more details and an annotated graph.
>>> FEATURED STOCK ARTICLE : Rallied Near 52-Week High With a Volume-Driven Gain - 1/30/2019 |
View all notes |
Set NEW NOTE alert |
Company Profile |
SEC
News |
Chart |
Request a new note
C
A
S
I |
Symbol/Exchange
Company Name
Industry Group |
PRICE |
CHANGE
(%Change) |
Day High |
Volume
(% DAV)
(% 50 day avg vol) |
52 Wk Hi
% From Hi |
Featured
Date |
Price
Featured |
Pivot Featured |
|
Max Buy |
INVA
-
NASDAQ
Innoviva Inc
Medical-Biomed/Biotech
|
$16.41
|
-0.69
-4.04% |
$17.36
|
1,850,626
156.17% of 50 DAV
50 DAV is 1,185,000
|
$20.54
-20.11%
|
11/23/2018
|
$17.74
|
PP = $18.09
|
|
MB = $18.99
|
Most Recent Note - 2/1/2019 3:34:54 PM
G - A rebound above the 50 DMA line is needed for the outlook to improve. Violated the prior high ($18.60 on 12/03/18) and its 50 DMA line ($17.90) with 3 consecutive volume-driven losses triggering a technical sell signal.
>>> FEATURED STOCK ARTICLE : Perched at High Following Volume-Driven Gains - 1/17/2019 |
View all notes |
Set NEW NOTE alert |
Company Profile |
SEC
News |
Chart |
Request a new note
C
A
S
I |
|
|
|
THESE ARE NOT BUY RECOMMENDATIONS!
Comments contained in the body of this report are technical
opinions only. The material herein has been obtained
from sources believed to be reliable and accurate, however,
its accuracy and completeness cannot be guaranteed.
This site is not an investment advisor, hence it does
not endorse or recommend any securities or other investments.
Any recommendation contained in this report may not
be suitable for all investors and it is not to be deemed
an offer or solicitation on our part with respect to
the purchase or sale of any securities. All trademarks,
service marks and trade names appearing in this report
are the property of their respective owners, and are
likewise used for identification purposes only.
This report is a service available
only to active Paid Premium Members.
You may opt-out of receiving report notifications
at any time. Questions or comments may be submitted
by writing to Premium Membership Services 665 S.E. 10 Street, Suite 201 Deerfield Beach, FL 33441-5634 or by calling 1-800-965-8307
or 954-785-1121.
|
|
|