You are not logged in.
This means you
CAN ONLY VIEW reports that were published prior to Tuesday, February 20, 2024.
You
MUST UPGRADE YOUR MEMBERSHIP if you want to see any current reports.
AFTER MARKET UPDATE - WEDNESDAY, JANUARY 30TH, 2019
Previous After Market Report Next After Market Report >>>
|
|
|
|
DOW |
+434.90 |
25,014.86 |
+1.77% |
|
Volume |
842,817,150 |
+10% |
|
Volume |
2,521,323,090 |
+22% |
|
NASDAQ |
+153.47 |
7,181.76 |
+2.18% |
|
Advancers |
2,342 |
79% |
|
Advancers |
2,122 |
70% |
|
S&P 500 |
+41.05 |
2,681.05 |
+1.55% |
|
Decliners |
604 |
20% |
|
Decliners |
892 |
30% |
|
Russell 2000 |
+15.49 |
1,486.94 |
+1.05% |
|
52 Wk Highs |
70 |
|
|
52 Wk Highs |
30 |
|
|
S&P 600 |
+9.22 |
926.29 |
+1.01% |
|
52 Wk Lows |
14 |
|
|
52 Wk Lows |
27 |
|
|
 |
Indices Rose With Greater Volume and More Leadership
Kenneth J. Gruneisen - Passed the CAN SLIM® Master's Exam
Stocks finished higher Wednesday. The Dow gained 434 points to 25,014 while the S&P 500 added 41 points to 2,681. The Nasdaq jumped 154 points to 7,183. The volume totals were higher than the prior session on both the NYSE and the Nasdaq exchange. Breadth was positive as advancers led decliners by almost a 4-1 margin on the NYSE and more than a 2-1 margin on the Nasdaq exchange. There were 21 high-ranked companies from the Leaders List that made a new 52-week high and were listed on the BreakOuts Page, versus the total of 19 on the prior session. New 52-week highs outnumbered new 52-week lows on the NYSE and on the Nasdaq exchange versus the prior session. The major indices are in a confirmed uptrend after recently noted improvements helped to signal a change in market direction (M criteria) back to a bullish stance. The Featured Stocks Page provides the most timely analysis on high-ranked leaders. Charts used courtesy of www.stockcharts.com
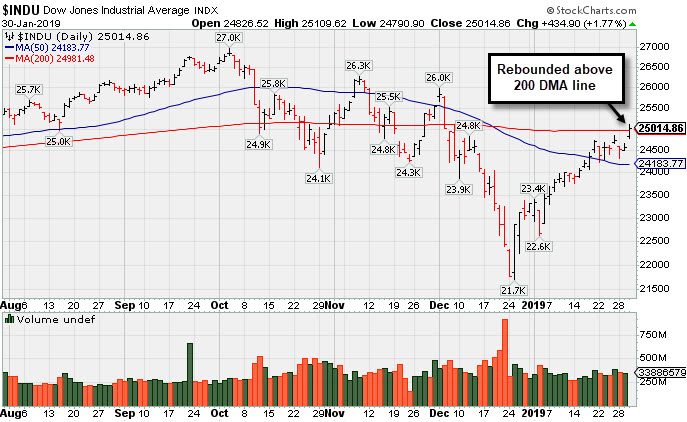
PICTURED: The Dow Jones Industrial Average rebounded above its 200-day moving average (DMA) line, a technical sign the market is in more "healthy" shape.
The major averages rallied as investors digested a day packed with earnings, central bank, and political news. Stocks climbed to session highs while Treasury yields and the dollar dipped following the conclusion of the January Federal Reserve meeting. As expected, the Fed left its benchmark rate unchanged and said it plans to be “patient” regarding future interest rate hikes and its balance sheet reduction program. On the data front, private payrolls rose 213,000 in January, more than a projected 181,000 increase. Another report showed pending home sales dipped to the lowest level in five years in December.
Technology shares paced gains with Apple (AAPL +6.83%) after profit and sales came in slightly above analyst expectations despite a dip in iPhone sales. Boeing (BA +6.25%) was another notable gainer, rising after the jet maker announced annual sales topped $100 billion for the first time. Advanced Micro Devices (AMD +19.95%) rallied after the chipmaker provided optimistic forward guidance. Meanwhile, AT&T (T -4.33%) fell after adding fewer new subscribers than in the previous quarter.
Treasuries strengthened with the yield on the 10-year note fell two basis points to 2.69%. In commodities, WTI crude added 1.8% to $54.28/barrel. COMEX gold gained 0.7% to $1,318.00/ounce. |
 Kenneth J. Gruneisen started out as a licensed stockbroker in August 1987, a couple of months prior to the historic stock market crash that took the Dow Jones Industrial Average down -22.6% in a single day. He has published daily fact-based fundamental and technical analysis on high-ranked stocks online for two decades. Through FACTBASEDINVESTING.COM, Kenneth provides educational articles, news, market commentary, and other information regarding proven investment systems that work in good times and bad.
Comments contained in the body of this report are technical opinions only and are not necessarily those of Gruneisen Growth Corp. The material herein has been obtained from sources believed to be reliable and accurate, however, its accuracy and completeness cannot be guaranteed. Our firm, employees, and customers may effect transactions, including transactions contrary to any recommendation herein, or have positions in the securities mentioned herein or options with respect thereto. Any recommendation contained in this report may not be suitable for all investors and it is not to be deemed an offer or solicitation on our part with respect to the purchase or sale of any securities. |
|
 |
Retail, Semiconductor, Biotech, and Commodity-Linked Groups Rose
Kenneth J. Gruneisen - Passed the CAN SLIM® Master's Exam
The Retail Index ($RLX +2.75%) posted a solid gain while the Broker/Dealer Index ($XBD -0.52%) and the Bank Index ($BKX -0.11%) both ended slightly to the downside. The tech sector was led higher by the Semiconductor Index ($SOX +2.87%) and the Biotech Index ($BTK +1.42%), meanwhile the Networking Index ($NWX -0.10%) edged lower. Commodity-linked groups had a positive bias as the Gold & Silver Index ($XAU +1.37%), Integrated Oil Index ($XOI +1.39%) and the Oil Services Index ($OSX +2.36%) posted unanimous gains.
Charts courtesy of www.stockcharts.com
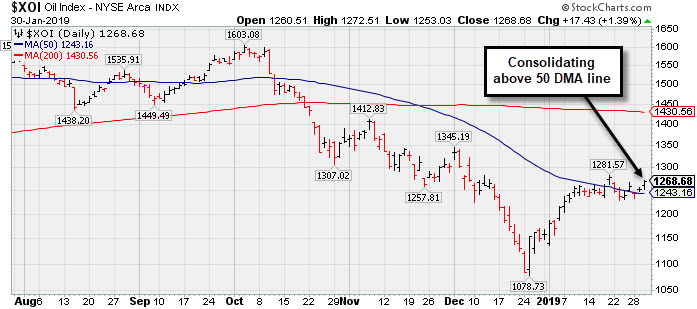 PICTURED: The Integrated Oil Index ($XOI +1.39%) is consolidating above its 200-day moving average (DMA) line.
| Oil Services |
$OSX |
97.51 |
+2.25 |
+2.36% |
+20.98% |
| Integrated Oil |
$XOI |
1,268.68 |
+17.43 |
+1.39% |
+9.45% |
| Semiconductor |
$SOX |
1,271.76 |
+35.51 |
+2.87% |
+10.09% |
| Networking |
$NWX |
530.80 |
-0.54 |
-0.10% |
+8.62% |
| Broker/Dealer |
$XBD |
256.30 |
-1.33 |
-0.52% |
+7.99% |
| Retail |
$RLX |
2,117.97 |
+56.74 |
+2.75% |
+8.54% |
| Gold & Silver |
$XAU |
74.53 |
+1.01 |
+1.37% |
+5.48% |
| Bank |
$BKX |
97.45 |
-0.11 |
-0.11% |
+13.59% |
| Biotech |
$BTK |
4,830.83 |
+67.66 |
+1.42% |
+14.45% |
|
|
|
 |
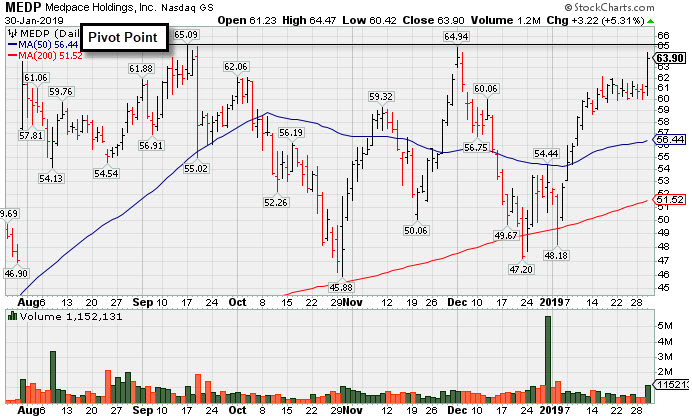
Rallied Near 52-Week High With a Volume-Driven Gain
Kenneth J. Gruneisen - Passed the CAN SLIM® Master's Exam
Medpace Holdings Inc (MEDP +$3.22 or +5.31% to $63.90) was highlighter in yellow with pivot point cited based on its 9/17/18 high plus 10 cents in the earlier mid-day report (read here). It nearly challenged its 52-week high with today's big gain backed by +57% above average volume. Subsequent gains above the pivot point backed by at least +40% above average volume may trigger a technical buy signal.
Fundamentals remain strong. It support at its 200 DMA line during the consolidations in recent months. It was last shown in this FSU section on 12/19/18 with an annotated graph under the headline, "Slumped Badly After Challenging Prior High".
The high-ranked Medical-Research Eqp/Svc firm reported earnings +68% on +62% sales revenues for the Sep '18 quarter marking the 3rd consecutive comparison above the +25% minimum earnings guideline (C criteria). Its annual earnings (A criteria) history has been strong and it has a 96 Earnings Per Share Rating, putting it in the top 5% of all publicly traded companies.
The number of top-rated funds owning its shares rose from 188 in Dec '17 to 424 in Dec '18, a reassuring sign concerning the I criteria. Its current Up/Down Volume Ratio of 1.3 is an unbiased indication its shares have been under slight accumulation over the past 50 days. It has earned a Timeliness Rating of A and Sponsorship rating of B. Proposed yet another Secondary Offering on 8/07/18. Completed Secondary Offerings on 6/12/18, 5/04/18, and 12/01/17.
Charts courtesy of www.stockcharts.com |
|
|
Color Codes Explained :
Y - Better candidates highlighted by our
staff of experts.
G - Previously featured
in past reports as yellow but may no longer be buyable under the
guidelines.
***Last / Change / Volume data in this table is the closing quote data***
Symbol/Exchange
Company Name
Industry Group |
PRICE |
CHANGE
(%Change) |
Day High |
Volume
(% DAV)
(% 50 day avg vol) |
52 Wk Hi
% From Hi |
Featured
Date |
Price
Featured |
Pivot Featured |
|
Max Buy |
MLR
-
NYSE
Miller Industries Inc
AUTOMOTIVE - Auto Parts
|
$29.45
|
-0.05
-0.17% |
$29.71
|
18,153
50.43% of 50 DAV
50 DAV is 36,000
|
$30.00
-1.83%
|
11/30/2018
|
$28.35
|
PP = $29.50
|
|
MB = $30.98
|
Most Recent Note - 1/29/2019 5:43:31 PM
Y - Held its ground today with light volume. Subsequent gains above the pivot point backed by at least +40% above average volume may help clinch a proper technical buy signal. Its 50 DMA line and recent low define near-term support to watch on pullbacks. See the latest FSU analysis for more details and a new annotated graph.
>>> FEATURED STOCK ARTICLE : Traded Above Pivot Point Recently Without Great Volume - 1/29/2019 |
View all notes |
Set NEW NOTE alert |
Company Profile |
SEC
News |
Chart |
Request a new note
C
A
S
I |
LHCG
-
NASDAQ
L H C Group Inc
HEALTH SERVICES - Home Health Care
|
$105.14
|
-1.45
-1.36% |
$108.49
|
199,887
76.29% of 50 DAV
50 DAV is 262,000
|
$109.33
-3.83%
|
1/23/2019
|
$107.29
|
PP = $107.61
|
|
MB = $112.99
|
Most Recent Note - 1/28/2019 5:33:57 PM
Y - Pulled back for a 2nd small loss with light volume, remaining perched very near its high. Highlighted in yellow with pivot point cited based on its 11/29/18 high plus 10 cents in the 1/23/18 mid-day report after an 8-week cup shaped base. Subsequent gains above the pivot point backed by at least +40% above average volume may trigger a technical buy signal.
>>> FEATURED STOCK ARTICLE : Healthcare Services Firm Reached a New High - 1/23/2019 |
View all notes |
Set NEW NOTE alert |
Company Profile |
SEC
News |
Chart |
Request a new note
C
A
S
I |
BSTC
-
NASDAQ
Biospecifics Technologie
Medical-Biomed/Biotech
|
$64.30
|
+0.07
0.11% |
$66.00
|
26,425
66.06% of 50 DAV
50 DAV is 40,000
|
$68.00
-5.44%
|
1/18/2019
|
$67.40
|
PP = $66.31
|
|
MB = $69.63
|
Most Recent Note - 1/28/2019 5:56:47 PM
Y - Thinly traded Biomed/Biotech firm has recently been sputtering below its pivot point. Confirming volume-driven gains for a new high close would be a reassuring sign of institutional accumulation.
>>> FEATURED STOCK ARTICLE : Thinly Traded Biotech Shows Signs of Accumulation - 1/18/2019 |
View all notes |
Set NEW NOTE alert |
Company Profile |
SEC
News |
Chart |
Request a new note
C
A
S
I |
UBNT
-
NASDAQ
Ubiquiti Networks
TELECOMMUNICATIONS - Diversified Communication Serv
|
$107.93
|
+1.70
1.60% |
$107.99
|
287,565
80.55% of 50 DAV
50 DAV is 357,000
|
$115.44
-6.51%
|
11/9/2018
|
$108.20
|
PP = $101.43
|
|
MB = $106.50
|
Most Recent Note - 1/28/2019 5:59:36 PM
G - Still quietly consolidating above its 50 DMA line ($105.18). Faces some resistance due to overhead supply up to the $115 level. Prior low ($92.08 on 12/24/18) defines the next important support. Fundamentals remain strong.
>>> FEATURED STOCK ARTICLE : Sputtering Below 50-Day Moving Average Again - 1/15/2019 |
View all notes |
Set NEW NOTE alert |
Company Profile |
SEC
News |
Chart |
Request a new note
C
A
S
I |
PYPL
-
NASDAQ
Paypal Holdings Inc
Finance-CrdtCard/PmtPr
|
$92.42
|
+1.30
1.43% |
$93.34
|
10,271,768
113.58% of 50 DAV
50 DAV is 9,044,000
|
$94.58
-2.28%
|
1/24/2019
|
$92.56
|
PP = $93.80
|
|
MB = $98.49
|
Most Recent Note - 1/28/2019 1:02:58 PM
Y - Due to report earnings news on 1/30/19. Volume and volatility often increase near earnings news. Pulling back today after wedging to a new all-time high last week. Highlighted in yellow with new pivot point cited based on its 9/13/18 high plus 10 cents. Subsequent gains above the pivot point backed by at least +40% above average volume are needed to trigger a proper technical buy signal.
>>> FEATURED STOCK ARTICLE : Perched Within Striking Distance of High Ahead of Earnings News - 1/24/2019 |
View all notes |
Set NEW NOTE alert |
Company Profile |
SEC
News |
Chart |
Request a new note
C
A
S
I |
Symbol/Exchange
Company Name
Industry Group |
PRICE |
CHANGE
(%Change) |
Day High |
Volume
(% DAV)
(% 50 day avg vol) |
52 Wk Hi
% From Hi |
Featured
Date |
Price
Featured |
Pivot Featured |
|
Max Buy |
ALRM
-
NASDAQ
Alarm.com Holdings Inc
Security/Sfty
|
$62.04
|
-0.65
-1.04% |
$63.29
|
516,976
107.03% of 50 DAV
50 DAV is 483,000
|
$63.72
-2.64%
|
1/22/2019
|
$60.52
|
PP = $60.30
|
|
MB = $63.32
|
Most Recent Note - 1/29/2019 5:50:03 PM
Y - Volume was light today while staying perched at its all-time high. Recent gains for new highs lacked great volume conviction. Prior highs define initial support to watch on pullbacks.
>>> FEATURED STOCK ARTICLE : Pullback Broke Steak of Gains and Reversed From New High - 1/22/2019 |
View all notes |
Set NEW NOTE alert |
Company Profile |
SEC
News |
Chart |
Request a new note
C
A
S
I |
PLNT
-
NYSE
Planet Fitness Inc Cl A
Leisure-Services
|
$58.05
|
+0.47
0.82% |
$58.47
|
1,753,783
145.54% of 50 DAV
50 DAV is 1,205,000
|
$59.52
-2.47%
|
11/7/2018
|
$57.10
|
PP = $55.45
|
|
MB = $58.22
|
 Most Recent Note - 1/30/2019 8:21:44 PM
Y - Still consolidating below its "max buy" level and holding its ground in a tight range near its all-time high. Its 50 DMA line ($55.04) defines important near-term support to watch above the recent low ($48).
>>> FEATURED STOCK ARTICLE : Hovering in a Tight Range Near All-Time High - 1/25/2019 |
View all notes |
Set NEW NOTE alert |
Company Profile |
SEC
News |
Chart |
Request a new note
C
A
S
I |
TEAM
-
NASDAQ
Atlassian Corp Plc Cl A
Comp Sftwr-Spec Enterprs
|
$95.01
|
+1.79
1.92% |
$95.84
|
1,139,394
67.50% of 50 DAV
50 DAV is 1,688,000
|
$100.00
-4.99%
|
1/7/2019
|
$94.68
|
PP = $98.31
|
|
MB = $103.23
|
Most Recent Note - 1/29/2019 5:46:38 PM
Y - Volume totals have been drying up while hovering near its high. Reported earnings +92% on +39% sales revenues for the Dec '18 quarter. Subsequent gains and a strong close above the pivot point backed by at least +40% above average volume may help to clinch a convincing technical buy signal. Its 50 DMA line ($85.29) and prior low define near-term support to watch on pullbacks. See the latest FSU analysis for more details and an annotated graph.
>>> FEATURED STOCK ARTICLE : Volume Light While Hovering Near High - 1/28/2019 |
View all notes |
Set NEW NOTE alert |
Company Profile |
SEC
News |
Chart |
Request a new note
C
A
S
I |
MEDP
-
NASDAQ
Medpace Holdings Inc
Medical-Research Eqp/Svc
|
$63.90
|
+3.22
5.31% |
$64.47
|
1,149,392
157.45% of 50 DAV
50 DAV is 730,000
|
$65.09
-1.83%
|
1/30/2019
|
$64.10
|
PP = $65.19
|
|
MB = $68.45
|
Most Recent Note - 1/30/2019 8:13:08 PM
Y - Rallied near its 52-week high with +57% above average volume behind today's big gain. Color code was changed to yellow with pivot point cited based on its 9/17/18 high plus 10 cents. Subsequent gains above the pivot point backed by at least +40% above average volume may trigger a technical buy signal. Fundamentals remain strong. The 200 DMA line acted as support above the prior low and it has rebounded since dropped from the Featured Stocks list on 12/19/18. See the latest FSU analysis for more details and a new annotated graph.
>>> FEATURED STOCK ARTICLE : Rallied Near 52-Week High With a Volume-Driven Gain - 1/30/2019 |
View all notes |
Set NEW NOTE alert |
Company Profile |
SEC
News |
Chart |
Request a new note
C
A
S
I |
INVA
-
NASDAQ
Innoviva Inc
Medical-Biomed/Biotech
|
$18.22
|
-1.84
-9.17% |
$20.54
|
4,164,313
395.85% of 50 DAV
50 DAV is 1,052,000
|
$20.24
-9.98%
|
11/23/2018
|
$17.74
|
PP = $18.09
|
|
MB = $18.99
|
Most Recent Note - 1/30/2019 8:18:39 PM
G - After hitting another new high today there was an ugly "negative reversal" in the final hour of the session as it suffered a big loss on heavy volume nearly 4 times average. Violated the prior high ($18.60 on 12/03/18) but found prompt support after undercutting its 50 DMA line ($17.89).
>>> FEATURED STOCK ARTICLE : Perched at High Following Volume-Driven Gains - 1/17/2019 |
View all notes |
Set NEW NOTE alert |
Company Profile |
SEC
News |
Chart |
Request a new note
C
A
S
I |
Symbol/Exchange
Company Name
Industry Group |
PRICE |
CHANGE
(%Change) |
Day High |
Volume
(% DAV)
(% 50 day avg vol) |
52 Wk Hi
% From Hi |
Featured
Date |
Price
Featured |
Pivot Featured |
|
Max Buy |
|
|
|
THESE ARE NOT BUY RECOMMENDATIONS!
Comments contained in the body of this report are technical
opinions only. The material herein has been obtained
from sources believed to be reliable and accurate, however,
its accuracy and completeness cannot be guaranteed.
This site is not an investment advisor, hence it does
not endorse or recommend any securities or other investments.
Any recommendation contained in this report may not
be suitable for all investors and it is not to be deemed
an offer or solicitation on our part with respect to
the purchase or sale of any securities. All trademarks,
service marks and trade names appearing in this report
are the property of their respective owners, and are
likewise used for identification purposes only.
This report is a service available
only to active Paid Premium Members.
You may opt-out of receiving report notifications
at any time. Questions or comments may be submitted
by writing to Premium Membership Services 665 S.E. 10 Street, Suite 201 Deerfield Beach, FL 33441-5634 or by calling 1-800-965-8307
or 954-785-1121.
|
|
|