You are not logged in.
This means you
CAN ONLY VIEW reports that were published prior to Sunday, February 25, 2024.
You
MUST UPGRADE YOUR MEMBERSHIP if you want to see any current reports.
AFTER MARKET UPDATE - WEDNESDAY, JANUARY 29TH, 2020
Previous After Market Report Next After Market Report >>>
|
|
|
|
DOW |
+11.60 |
28,734.45 |
+0.04% |
|
Volume |
826,225,170 |
-1% |
|
Volume |
2,209,537,850 |
+5% |
|
NASDAQ |
+5.48 |
9,275.16 |
+0.06% |
|
Advancers |
1,433 |
50% |
|
Advancers |
1,243 |
39% |
|
S&P 500 |
-2.84 |
3,273.40 |
-0.09% |
|
Decliners |
1,429 |
50% |
|
Decliners |
1,934 |
61% |
|
Russell 2000 |
-9.09 |
1,649.22 |
-0.55% |
|
52 Wk Highs |
202 |
|
|
52 Wk Highs |
108 |
|
|
S&P 600 |
-7.81 |
1,004.42 |
-0.77% |
|
52 Wk Lows |
59 |
|
|
52 Wk Lows |
60 |
|
|
 |
Leadership Improved While Major Indices Were Little Changed
Kenneth J. Gruneisen - Passed the CAN SLIM® Master's Exam
The Dow added 11 points, while the S&P 500 dipped 0.1%. The Nasdaq Composite edged up 0.1%. Advancers and decliners were evenly matched on the NYSE but decliners led advancers by a 3-2 margin on the Nasdaq exchange. The reported volume totals were mixed, lighter than the prior session total on the NYSE and higher on the Nasdaq exchange. There were 52 high-ranked companies from the Leaders List that hit a new 52-week high and were listed on the BreakOuts Page, versus the total of 36 on the prior session. New 52-week highs totals expanded and outnumbered new 52-week lows totals on the NYSE on the Nasdaq exchange. The major indices' (M criteria) remain in confirmed uptrend. Disciplined investors buy individual stocks on a case-by-case basis only if all key criteria are met. The Featured Stocks Page provides the most timely analysis on high-ranked leaders. Charts used courtesy of www.stockcharts.com
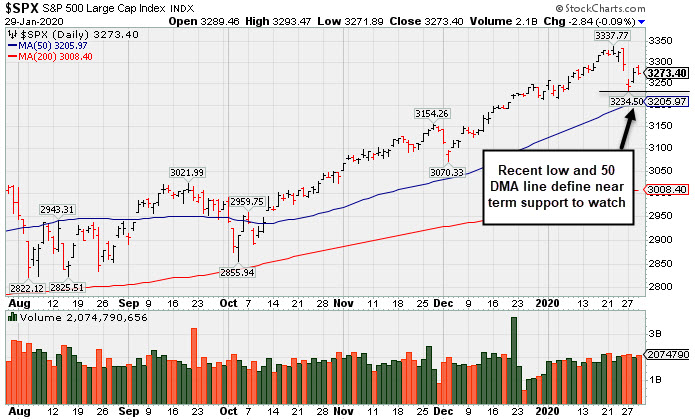
PICTURED: The S&P 500 Index is consolidating near its record high. Near-term support is defined by the prior low and its 50-day moving average (DMA) line.
Stocks finished mixed on Wednesday, paring earlier gains. Investor attention pivoted to the Fed policy decision, as well as corporate and economic updates. Geopolitical news also garnered attention, with President Trump officially signing the United States-Mexico-Canada-Agreement (USMCA) into law.
As expected, the Federal Reserve left its benchmark interest rate unchanged, citing strength in the labor market and solid economic growth. Fed Chair Jerome Powell noted that the committee is “carefully monitoring” the potential economic impact of the Chinese coronavirus. Treasuries rallied, with the yield on the benchmark 10-year note down six basis points to 1.59%.
Seven of 11 S&P 500 sectors closed in negative territory, with Industrials outperforming. Boeing (BA +1.72%) rose as the financial damage caused by the beleaguered 737-MAX jet was better than feared. General Electric (GE +10.32%) rose after besting Wall Street earnings expectations. In other earnings, Apple (AAPL +2.09%) hit a new all-time highs on record revenue. Semiconductor stocks lagged, with Advanced Micro Devices (AMD -5.90%) down on weak guidance. Elsewhere, McDonald’s (MCD +1.92%) rose after its profit tally surprised to the upside, while AT&T (T -3.97%) fell following a revenue miss.
On the data front, pending home sales fell 4.9% in December, the biggest drop since May 2010 amid record-low inventory. Separately, the advance goods trade deficit widened more than anticipated in December. In commodities, WTI crude dipped 0.3% to $53.33/barrel after a government report showed the largest buildup in U.S. crude stockpiles since November. |
 Kenneth J. Gruneisen started out as a licensed stockbroker in August 1987, a couple of months prior to the historic stock market crash that took the Dow Jones Industrial Average down -22.6% in a single day. He has published daily fact-based fundamental and technical analysis on high-ranked stocks online for two decades. Through FACTBASEDINVESTING.COM, Kenneth provides educational articles, news, market commentary, and other information regarding proven investment systems that work in good times and bad.
Comments contained in the body of this report are technical opinions only and are not necessarily those of Gruneisen Growth Corp. The material herein has been obtained from sources believed to be reliable and accurate, however, its accuracy and completeness cannot be guaranteed. Our firm, employees, and customers may effect transactions, including transactions contrary to any recommendation herein, or have positions in the securities mentioned herein or options with respect thereto. Any recommendation contained in this report may not be suitable for all investors and it is not to be deemed an offer or solicitation on our part with respect to the purchase or sale of any securities. |
|
 |
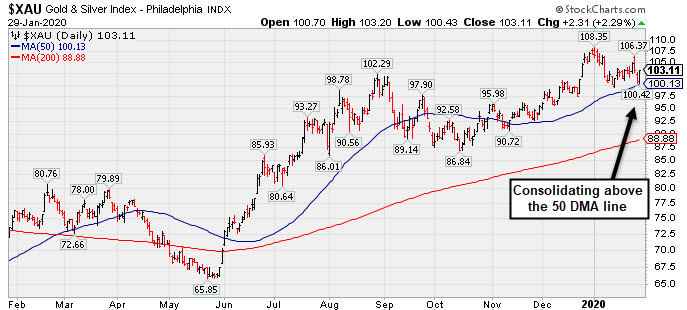
Gold & Silver Index a Standout Gainer
Kenneth J. Gruneisen - Passed the CAN SLIM® Master's Exam
The Bank Index ($BKX -0.93%) outpaced the Broker/Dealer Index ($XBD -0.31%) to the downside while the Retail Index ($RLX -0.12%) ended slightly in the red. The Semiconductor Index ($SOX -1.83%) and the Networking Index ($NWX -2.18%) both slumped while the Biotech Index ($BTK +0.13%) rose just a tiny bit. Energy-linked groups had a negative bias as the Oil Services Index ($OSX -1.91%) and the Integrated Oil Index ($XOI -1.20%) both fell.
PICTURED: The Gold & Silver Index ($XAU +2.29%) was a standout gainer on Wednesday. It is consolidating above its 50-day moving average (DMA) line.
| Oil Services |
$OSX |
63.81 |
-1.24 |
-1.91% |
-18.50% |
| Integrated Oil |
$XOI |
1,149.72 |
-14.02 |
-1.20% |
-9.51% |
| Semiconductor |
$SOX |
1,858.70 |
-34.57 |
-1.83% |
+0.49% |
| Networking |
$NWX |
569.67 |
-12.72 |
-2.18% |
-2.36% |
| Broker/Dealer |
$XBD |
291.39 |
-0.89 |
-0.31% |
+0.35% |
| Retail |
$RLX |
2,450.55 |
-2.86 |
-0.12% |
+0.05% |
| Gold & Silver |
$XAU |
103.11 |
+2.31 |
+2.29% |
-3.56% |
| Bank |
$BKX |
105.86 |
-1.00 |
-0.94% |
-6.62% |
| Biotech |
$BTK |
4,968.31 |
+6.51 |
+0.13% |
-1.96% |
|
|
|
 |
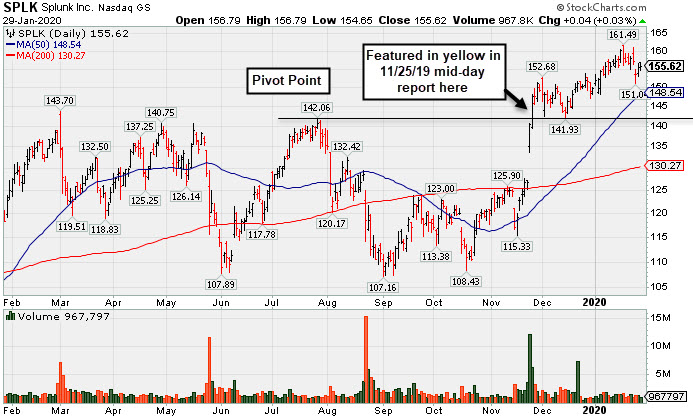
Volume Totals Cooling While Hovering Near All-Time High
Kenneth J. Gruneisen - Passed the CAN SLIM® Master's Exam
Splunk Inc (SPLK) +$0.05 or +0.03% to $155.62) is still stubbornly holding its ground near its all-time high with volume totals cooling in recent weeks. It is extended from the previously noted base. Its 50-day moving average (DMA) line ($148.54) and prior highs in the $142-143 area define important support to watch on pullbacks.
SPLK was last shown in this FSU section on 1/08/20 with an annotated graph under the headline, "New High Hit With Another Gain on Near Average Volume. The number of top-rated funds owning its shares rose from 748 in Jun '17 to 1,191 in Dec '19, a reassuring sign concerning the I criteria. The current Up/Down Volume Ratio of 1.8 is an unbiased indication its shares have been under accumulation over the past 50 days. Its Timeliness Rating is A and Sponsorship Rating is B.
Fundamentals remain strong. Bullish action came as it gapped up on 11/22/19 after reporting earnings +53% on +30% sales revenues versus the year ago period ended October 31st. Quarterly comparisons have been above the +25% minimum guideline (C criteria). Annual earnings history has been strong. The high-ranked Computer Software - Database firm has earned an 99 earnings Per Share Rating, well above the 80+ minimum guideline for buy candidates. Its annual earnings (A criteria) history has been strong since reaching profitability in FY '15.
|
|
|
Color Codes Explained :
Y - Better candidates highlighted by our
staff of experts.
G - Previously featured
in past reports as yellow but may no longer be buyable under the
guidelines.
***Last / Change / Volume data in this table is the closing quote data***
Symbol/Exchange
Company Name
Industry Group |
PRICE |
CHANGE
(%Change) |
Day High |
Volume
(% DAV)
(% 50 day avg vol) |
52 Wk Hi
% From Hi |
Featured
Date |
Price
Featured |
Pivot Featured |
|
Max Buy |
 FTNT
-
NASDAQ
FTNT
-
NASDAQ
Fortinet Inc
Computer Sftwr-Security
|
$117.27
|
-0.27
-0.23% |
$118.84
|
860,528
76.49% of 50 DAV
50 DAV is 1,125,000
|
$120.44
-2.63%
|
12/9/2019
|
$103.85
|
PP = $106.10
|
|
MB = $111.41
|
Most Recent Note - 1/27/2020 5:21:15 PM
G - Gapped down today, retreating from its all-time high. Very extended from any sound base. Its 50 DMA line ($108.50) defines important near-term support to watch.
>>> FEATURED STOCK ARTICLE : Extended From Base After Wedging Higher - 1/14/2020 |
View all notes |
Set NEW NOTE alert |
Company Profile |
SEC
News |
Chart |
Request a new note
C
A
S
I |
SPSC
-
NASDAQ
S P S Commerce Inc
COMPUTER SOFTWARE and SERVICES - Application Software
|
$57.47
|
-0.35
-0.61% |
$58.05
|
127,561
72.35% of 50 DAV
50 DAV is 176,300
|
$59.98
-4.18%
|
11/29/2019
|
$56.59
|
PP = $59.24
|
|
MB = $62.20
|
Most Recent Note - 1/28/2020 5:50:20 PM
Y - Holding its ground stubbornly perched near its all-time high with no resistance remaining. Subsequent gains above its pivot point backed by at least +40% above average volume are needed to trigger a new technical buy signal. Fundamentals remain strong. Its Relative Strength Rating of 79 is just below the 80+ minimum guideline for buy candidates.
>>> FEATURED STOCK ARTICLE : Still Lingering Below Prior Resistance - 1/13/2020 |
View all notes |
Set NEW NOTE alert |
Company Profile |
SEC
News |
Chart |
Request a new note
C
A
S
I |
AUDC
-
NASDAQ
Audiocodes Ltd
ELECTRONICS - Scientific and Technical Instrum
|
$22.33
|
-2.07
-8.48% |
$24.88
|
1,134,365
391.16% of 50 DAV
50 DAV is 290,000
|
$28.73
-22.28%
|
9/13/2019
|
$19.68
|
PP = $19.84
|
|
MB = $20.83
|
 Most Recent Note - 1/29/2020 6:12:49 PM
G - Violated its 50 DMA line ($25.13) and violated the prior low ($24.05 on 1/06/20) with damaging volume-driven losses triggering technical sell signals. Fundamentals remain strong.
>>> FEATURED STOCK ARTICLE : Showed Resilience With Close in Upper Third of Intra-day Range - 1/27/2020 |
View all notes |
Set NEW NOTE alert |
Company Profile |
SEC
News |
Chart |
Request a new note
C
A
S
I |
CHDN
-
NASDAQ
Churchill Downs Inc
LEISURE - Gaming Activities
|
$145.31
|
+0.64
0.44% |
$146.14
|
113,128
51.66% of 50 DAV
50 DAV is 219,000
|
$145.73
-0.29%
|
10/8/2019
|
$129.77
|
PP = $132.83
|
|
MB = $139.47
|
Most Recent Note - 1/27/2020 5:28:35 PM
G - Stubbornly holding its ground near its 52-week high following recent gains with light volume. Its 50 DMA line ($134) defines near-term support above the prior low ($132.55 on 1/03/19) The Jun and Sep '19 quarterly earnings versus the year ago periods were both below the +25% minimum guideline (C criteria) and raised fundamental concerns.
>>> FEATURED STOCK ARTICLE : Reversal From High Following 5 Gains With Light Volume - 1/21/2020 |
View all notes |
Set NEW NOTE alert |
Company Profile |
SEC
News |
Chart |
Request a new note
C
A
S
I |
LULU
-
NASDAQ
Lululemon Athletica
MANUFACTURING - Textile Manufacturing
|
$243.66
|
+4.31
1.80% |
$244.33
|
994,382
50.97% of 50 DAV
50 DAV is 1,951,000
|
$247.51
-1.56%
|
9/6/2019
|
$201.25
|
PP = $194.35
|
|
MB = $204.07
|
Most Recent Note - 1/29/2020 6:19:01 PM
G - Extended from any sound base and hovering near its all-time high with volume totals cooling. Its 50 DMA line ($230) and prior low ($218.18 on 12/12/19) define important near-term support to watch. Fundamentals remain strong.
>>> FEATURED STOCK ARTICLE : Perched at All-Time High After Gains Lacking Great Volume - 1/9/2020 |
View all notes |
Set NEW NOTE alert |
Company Profile |
SEC
News |
Chart |
Request a new note
C
A
S
I |
Symbol/Exchange
Company Name
Industry Group |
PRICE |
CHANGE
(%Change) |
Day High |
Volume
(% DAV)
(% 50 day avg vol) |
52 Wk Hi
% From Hi |
Featured
Date |
Price
Featured |
Pivot Featured |
|
Max Buy |
CPRT
-
NASDAQ
Copart Inc
SPECIALTY RETAIL - Auto Dealerships
|
$100.72
|
+0.01
0.01% |
$101.41
|
867,394
47.04% of 50 DAV
50 DAV is 1,844,000
|
$101.24
-0.51%
|
1/2/2020
|
$92.80
|
PP = $92.51
|
|
MB = $97.14
|
Most Recent Note - 1/28/2020 5:47:24 PM
G - Quietly touched a new all-time high today. Color code was changed to green after wedging above its "max buy" level with gains marked by below average volume. Its 50 DMA line ($91.64) defines near-term support coinciding with prior highs in the $91-92 area. Fundamentals remain strong. See the latest FSU analysis for more details and a new annotated graph.
>>> FEATURED STOCK ARTICLE : New High With Yet Another Gain Backed by Light Volume - 1/28/2020 |
View all notes |
Set NEW NOTE alert |
Company Profile |
SEC
News |
Chart |
Request a new note
C
A
S
I |
NMIH
-
NASDAQ
N M I Holdings Inc Cl A
Finance-MrtgandRel Svc
|
$32.66
|
+0.01
0.03% |
$33.17
|
274,220
53.77% of 50 DAV
50 DAV is 510,000
|
$35.79
-8.75%
|
11/8/2019
|
$32.89
|
PP = $31.44
|
|
MB = $33.01
|
Most Recent Note - 1/27/2020 5:30:31 PM
G - Still quietly sputtering, meanwhile, a rebound above the 50 DMA line ($33.19) is needed for its outlook to improve. Prior highs in the $30-31 area define the next important near-term support. Fundamentals remain strong.
>>> FEATURED STOCK ARTICLE : Outlook Hurt by Slump Below 50-Day Moving Average - 1/10/2020 |
View all notes |
Set NEW NOTE alert |
Company Profile |
SEC
News |
Chart |
Request a new note
C
A
S
I |
SPLK
-
NASDAQ
Splunk Inc
Computer Sftwr-Database
|
$155.62
|
+0.05
0.03% |
$156.79
|
960,703
46.73% of 50 DAV
50 DAV is 2,056,000
|
$161.49
-3.63%
|
11/25/2019
|
$147.79
|
PP = $142.16
|
|
MB = $149.27
|
Most Recent Note - 1/29/2020 6:14:15 PM
G - Volume totals have been cooling while consolidating and it is extended from the previously noted base. Its 50 DMA line ($148.54) and prior highs in the $142-143 area define important support to watch on pullbacks.
>>> FEATURED STOCK ARTICLE : Volume Totals Cooling While Hovering Near All-Time High - 1/29/2020 |
View all notes |
Set NEW NOTE alert |
Company Profile |
SEC
News |
Chart |
Request a new note
C
A
S
I |
PAYC
-
NYSE
Paycom Software Inc
COMPUTER SOFTWARE and SERVICES - Application Software
|
$322.05
|
+3.46
1.09% |
$324.75
|
1,015,118
128.50% of 50 DAV
50 DAV is 790,000
|
$324.00
-0.60%
|
11/20/2019
|
$252.97
|
PP = $259.81
|
|
MB = $272.80
|
Most Recent Note - 1/27/2020 12:33:57 PM
G - Gapped up on 1/23/20 hitting a new all-time high, and it has been stubbornly holding its ground after getting extended from any sound base. Its prior high ($279.95 on 11/27/19) and its 50 DMA line ($271) define important near-term support levels to watch. Fundamentals remain strong.
>>> FEATURED STOCK ARTICLE : Gapped Up for New High But Ended Near Session Low - 1/23/2020 |
View all notes |
Set NEW NOTE alert |
Company Profile |
SEC
News |
Chart |
Request a new note
C
A
S
I |
BLD
-
NYSE
Topbuild Corp
Bldg-Constr Prds/Misc
|
$117.21
|
-0.29
-0.25% |
$119.40
|
190,839
69.14% of 50 DAV
50 DAV is 276,000
|
$119.99
-2.32%
|
12/9/2019
|
$109.71
|
PP = $113.84
|
|
MB = $119.53
|
Most Recent Note - 1/29/2020 6:16:36 PM
Y - Hovering near its 52-week high, holding its ground following volume-driven gains. Prior high ($113.74) defines near-term support above its 50 DMA line.
>>> FEATURED STOCK ARTICLE : Fifth Consecutive Gain Leaves TopBuild Near 52-Week High - 1/17/2020 |
View all notes |
Set NEW NOTE alert |
Company Profile |
SEC
News |
Chart |
Request a new note
C
A
S
I |
Symbol/Exchange
Company Name
Industry Group |
PRICE |
CHANGE
(%Change) |
Day High |
Volume
(% DAV)
(% 50 day avg vol) |
52 Wk Hi
% From Hi |
Featured
Date |
Price
Featured |
Pivot Featured |
|
Max Buy |
TEAM
-
NASDAQ
Atlassian Corp Plc Cl A
Comp Sftwr-Spec Enterprs
|
$149.15
|
-0.12
-0.08% |
$151.52
|
1,925,604
127.35% of 50 DAV
50 DAV is 1,512,000
|
$150.71
-1.04%
|
1/24/2020
|
$144.66
|
PP = $140.49
|
|
MB = $147.51
|
Most Recent Note - 1/28/2020 12:50:26 PM
Y - Poised for a best-ever close with today's early gain. Gapped up and touched a new all-time high on the prior session, rising from a cup-with-handle base pattern with volume +514% above average behind the considerable gain triggering a technical buy signal. Bullish action came after it reported earnings +48% on +37% sales revenues for the Dec '19 quarter. Fundamentals remained strong while it went through a deep consolidation below its 200 DMA line since dropped from the Featured Stocks list on 9/09/19.
>>> FEATURED STOCK ARTICLE : Gapped Up Today Following Another Strong Earnings Report - 1/24/2020 |
View all notes |
Set NEW NOTE alert |
Company Profile |
SEC
News |
Chart |
Request a new note
C
A
S
I |
GLOB
-
NYSE
Globant SA
Computer-Tech Services
|
$125.79
|
-4.31
-3.31% |
$131.00
|
362,572
124.17% of 50 DAV
50 DAV is 292,000
|
$130.75
-3.79%
|
11/14/2019
|
$106.87
|
PP = $112.43
|
|
MB = $118.05
|
Most Recent Note - 1/27/2020 5:27:01 PM
G - Color code is changed to green after rising above its "max buy" level. Showed resilience today and ended in the upper third of its intra-day range with a small loss on higher volume after wedging to new highs with recent gains lacking great volume conviction. Its 50 DMA line ($107.40) defines important near-term support to watch on pullbacks. Fundamentals remain strong.
>>> FEATURED STOCK ARTICLE : Gain for New High Today Backed by Only +12% Above Average Volume - 1/15/2020 |
View all notes |
Set NEW NOTE alert |
Company Profile |
SEC
News |
Chart |
Request a new note
C
A
S
I |
STNE
-
NASDAQ
Stoneco Ltd Cl A
Finance-CrdtCard/PmtPr
|
$43.44
|
-0.07
-0.16% |
$44.00
|
1,306,043
65.27% of 50 DAV
50 DAV is 2,001,000
|
$45.62
-4.78%
|
1/22/2020
|
$43.94
|
PP = $45.72
|
|
MB = $48.01
|
Most Recent Note - 1/27/2020 5:19:55 PM
Y - Gapped down today abruptly retreating from near its 52-week high and testing its 50 DMA line ($39.71). More damaging losses would raise concerns. Subsequent gains above the pivot point backed by at least +40% above average volume are needed to trigger a technical buy signal.
>>> FEATURED STOCK ARTICLE : Perched Near High With Best-Ever Close After Volume-Driven Gain - 1/22/2020 |
View all notes |
Set NEW NOTE alert |
Company Profile |
SEC
News |
Chart |
Request a new note
C
A
S
I |
|
|
|
THESE ARE NOT BUY RECOMMENDATIONS!
Comments contained in the body of this report are technical
opinions only. The material herein has been obtained
from sources believed to be reliable and accurate, however,
its accuracy and completeness cannot be guaranteed.
This site is not an investment advisor, hence it does
not endorse or recommend any securities or other investments.
Any recommendation contained in this report may not
be suitable for all investors and it is not to be deemed
an offer or solicitation on our part with respect to
the purchase or sale of any securities. All trademarks,
service marks and trade names appearing in this report
are the property of their respective owners, and are
likewise used for identification purposes only.
This report is a service available
only to active Paid Premium Members.
You may opt-out of receiving report notifications
at any time. Questions or comments may be submitted
by writing to Premium Membership Services 665 S.E. 10 Street, Suite 201 Deerfield Beach, FL 33441-5634 or by calling 1-800-965-8307
or 954-785-1121.
|
|
|