You are not logged in.
This means you
CAN ONLY VIEW reports that were published prior to Saturday, February 24, 2024.
You
MUST UPGRADE YOUR MEMBERSHIP if you want to see any current reports.
AFTER MARKET UPDATE - MONDAY, JANUARY 28TH, 2019
Previous After Market Report Next After Market Report >>>
|
|
|
|
DOW |
-208.98 |
24,528.22 |
-0.84% |
|
Volume |
820,654,290 |
-5% |
|
Volume |
2,417,566,140 |
-0% |
|
NASDAQ |
-79.18 |
7,085.68 |
-1.11% |
|
Advancers |
1,340 |
45% |
|
Advancers |
1,101 |
36% |
|
S&P 500 |
-20.91 |
2,643.85 |
-0.78% |
|
Decliners |
1,618 |
55% |
|
Decliners |
1,971 |
64% |
|
Russell 2000 |
-9.32 |
1,473.54 |
-0.63% |
|
52 Wk Highs |
41 |
|
|
52 Wk Highs |
40 |
|
|
S&P 600 |
-5.91 |
917.07 |
-0.64% |
|
52 Wk Lows |
22 |
|
|
52 Wk Lows |
35 |
|
|
 |
Leadership Thinned and Major Indices Fell
Kenneth J. Gruneisen - Passed the CAN SLIM® Master's Exam
Stocks finished firmly lower Monday. The Dow lost 208 points to 24,528 while the S&P 500 slipped 20 points to 2,643. The Nasdaq composite fell 79 points to 7,085. The volume totals were lighter than the prior session on the NYSE and on the Nasdaq exchange. Breadth was negative as decliners led advancers by an 8-7 margin on the NYSE and nearly 2-1 on the Nasdaq exchange. There were 14 high-ranked companies from the Leaders List that made a new 52-week high and were listed on the BreakOuts Page, versus the total of 20 on the prior session. New 52-week highs outnumbered new 52-week lows on the NYSE and on the Nasdaq exchange versus the prior session. The major indices are in a confirmed uptrend after recently noted improvements helped to signal a change in market direction (M criteria) back to a bullish stance. The Featured Stocks Page provides the most timely analysis on high-ranked leaders. Charts used courtesy of www.stockcharts.com
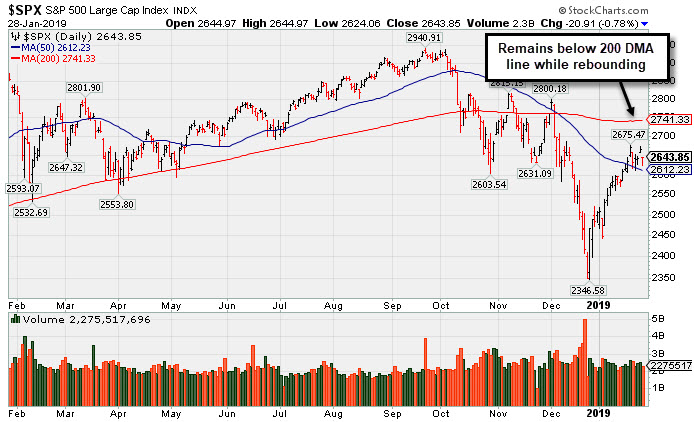
PICTURED: The S&P 500 Index ended -10.1% off its record high hit on 9/21/18. It recently rebounded above its 50-day moving average (DMA) line. Long-time readers may note from that the major averages cannot be considered to be in "healthy" shape while they are below their respective 200 DMA lines.
The major averages declined as cautious guidance updates from bellwether companies in the Industrial and Tech sectors renewed concerns of slowing global growth. Geopolitics remained in focus as Chinese leaders are scheduled to arrive in Washington for a new round of trade talks later this week. On the data front, an update from the Chicago Fed showed an increase of national manufacturing activity in December. Meanwhile, manufacturing activity in the Dallas Fed region unexpectedly increased in the current month. In central banks news, the Federal Reserve is set to kick off its two-day policy meeting Tuesday.
Nine of 11 S&P 500 sectors ended in negative territory. The Information Technology group led decliners with NVIDIA (NVDA -13.82%) fell after the chipmaker lowered its fourth quarter guidance citing a slowdown in demand from China. The Communications Services sector also underperformed with Alphabet (GOOGL -1.97%) falling. Industrials were broadly lower as Caterpillar (CAT -9.13%) fell after the heavy machinery manufacturer fell short of earnings estimates and lowered its full-year forecast.
Treasuries strengthened with the yield on the 10-year falling one basis point to 2.74%. In commodities, WTI crude lost 2.8% to $52.17/barrel. COMEX gold added 0.3% to $1,302.40/ounce despite a slightly stronger dollar. |
 Kenneth J. Gruneisen started out as a licensed stockbroker in August 1987, a couple of months prior to the historic stock market crash that took the Dow Jones Industrial Average down -22.6% in a single day. He has published daily fact-based fundamental and technical analysis on high-ranked stocks online for two decades. Through FACTBASEDINVESTING.COM, Kenneth provides educational articles, news, market commentary, and other information regarding proven investment systems that work in good times and bad.
Comments contained in the body of this report are technical opinions only and are not necessarily those of Gruneisen Growth Corp. The material herein has been obtained from sources believed to be reliable and accurate, however, its accuracy and completeness cannot be guaranteed. Our firm, employees, and customers may effect transactions, including transactions contrary to any recommendation herein, or have positions in the securities mentioned herein or options with respect thereto. Any recommendation contained in this report may not be suitable for all investors and it is not to be deemed an offer or solicitation on our part with respect to the purchase or sale of any securities. |
|
 |
Retail, Tech and Energy Linked Groups Fell
Kenneth J. Gruneisen - Passed the CAN SLIM® Master's Exam
The Retail Index ($RLX -1.00%) outpaced the Broker/Dealer Index ($XBD -0.36%) and the Bank Index ($BKX -0.10%) to the downside. The tech sector was led lower by the Semiconductor Index ($SOX -2.09%) and the Biotech Index ($BTK -2.00%) while the Networking Index ($NWX +0.10%) eked out a small gain. Commodity-linked groups were mixed as the Gold & Silver Index ($XAU +0.66%) edged higher but the Oil Services Index ($OSX -2.55%) and the Integrated Oil Index ($XOI -1.15%) both fell.
Charts courtesy of www.stockcharts.com
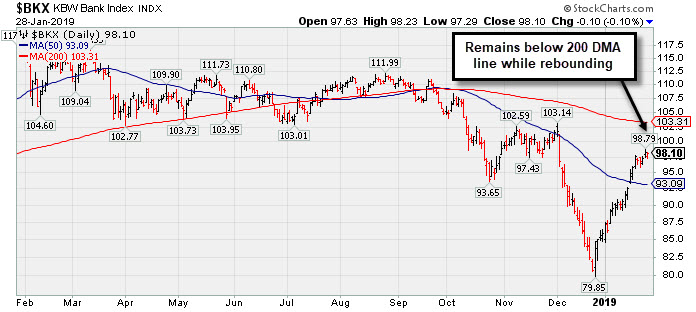 PICTURED: The Bank Index ($BKX -0.10%) remains below its 200-day moving average (DMA) line.
| Oil Services |
$OSX |
95.37 |
-2.49 |
-2.54% |
+18.33% |
| Integrated Oil |
$XOI |
1,244.01 |
-14.50 |
-1.15% |
+7.33% |
| Semiconductor |
$SOX |
1,254.40 |
-26.76 |
-2.09% |
+8.59% |
| Networking |
$NWX |
530.91 |
+0.54 |
+0.10% |
+8.64% |
| Broker/Dealer |
$XBD |
258.64 |
-0.94 |
-0.36% |
+8.97% |
| Retail |
$RLX |
2,087.98 |
-21.13 |
-1.00% |
+7.00% |
| Gold & Silver |
$XAU |
71.65 |
+0.48 |
+0.67% |
+1.40% |
| Bank |
$BKX |
98.10 |
-0.11 |
-0.11% |
+14.35% |
| Biotech |
$BTK |
4,773.54 |
-97.46 |
-2.00% |
+13.09% |
|
|
|
 |
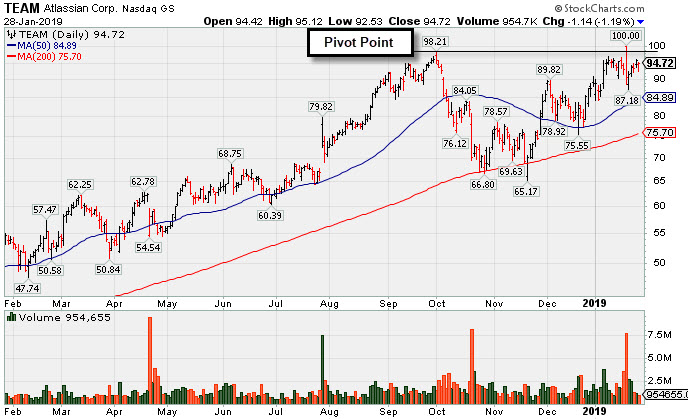
Volume Light While Hovering Near High
Kenneth J. Gruneisen - Passed the CAN SLIM® Master's Exam
Atlassian Corp (TEAM -$1.14 or -1.19% to $94.72) ended lower with a loss on light volume. Subsequent gains and a strong close above the pivot point backed by at least +40% above average volume may help to clinch a convincing technical buy signal. Its 50-day moving average (DMA) line ($84.41) and prior low define near-term support to watch on pullbacks.
TEAM was highlighted in yellow with new pivot point cited based on its 10/01/18 high plus 10 cents in the 1/04/19 mid-day report (read here). It was last shown in the FSU section on 1/07/19 with an annotated graph under the headline, "Rebounding Near Prior High Which May Act as Resistance". It found support at its 200 DMA line during the consolidation after dropped from the Featured Stocks list on 10/10/18.
Fundamentals remain strong. This Australia - based software developer recently it reported earnings +92% on +39% sales revenues for the Dec '18 quarter versus the year ago period, its 5th consecutive quarterly comparison above the +25% minimum guideline (C criteria), helping it better match with the fact-based investment system's guidelines. Annual earnings (A criteria) history has been strong since its $21 IPO on 12/10/15.
The number of top-rated funds owning its shares rose from 266 in Sep '17 to 406 in Sep '18, a reassuring sign concerning the I criteria. It has a Timeliness Rating of A and Sponsorship Rating of B.Its current Up/Down Volume Ratio of 1.3 is an unbiased indication its shares have been under accumulation.
|
|
|
Color Codes Explained :
Y - Better candidates highlighted by our
staff of experts.
G - Previously featured
in past reports as yellow but may no longer be buyable under the
guidelines.
***Last / Change / Volume data in this table is the closing quote data***
Symbol/Exchange
Company Name
Industry Group |
PRICE |
CHANGE
(%Change) |
Day High |
Volume
(% DAV)
(% 50 day avg vol) |
52 Wk Hi
% From Hi |
Featured
Date |
Price
Featured |
Pivot Featured |
|
Max Buy |
MLR
-
NYSE
Miller Industries Inc
AUTOMOTIVE - Auto Parts
|
$29.50
|
-0.30
-1.01% |
$29.72
|
24,798
67.02% of 50 DAV
50 DAV is 37,000
|
$30.00
-1.67%
|
11/30/2018
|
$28.35
|
PP = $29.50
|
|
MB = $30.98
|
 Most Recent Note - 1/28/2019 5:58:03 PM
Y - Pulled back today with light volume. Subsequent gains above the pivot point backed by at least +40% above average volume may help clinch a proper technical buy signal. Its 50 DMA line and recent low define near-term support to watch on pullbacks.
>>> FEATURED STOCK ARTICLE : Perched Within Close Striking Distance of Prior High - 1/8/2019 |
View all notes |
Set NEW NOTE alert |
Company Profile |
SEC
News |
Chart |
Request a new note
C
A
S
I |
LHCG
-
NASDAQ
L H C Group Inc
HEALTH SERVICES - Home Health Care
|
$105.64
|
-1.98
-1.84% |
$107.31
|
155,925
58.84% of 50 DAV
50 DAV is 265,000
|
$109.33
-3.38%
|
1/23/2019
|
$107.29
|
PP = $107.61
|
|
MB = $112.99
|
Most Recent Note - 1/28/2019 5:33:57 PM
Y - Pulled back for a 2nd small loss with light volume, remaining perched very near its high. Highlighted in yellow with pivot point cited based on its 11/29/18 high plus 10 cents in the 1/23/18 mid-day report after an 8-week cup shaped base. Subsequent gains above the pivot point backed by at least +40% above average volume may trigger a technical buy signal.
>>> FEATURED STOCK ARTICLE : Healthcare Services Firm Reached a New High - 1/23/2019 |
View all notes |
Set NEW NOTE alert |
Company Profile |
SEC
News |
Chart |
Request a new note
C
A
S
I |
BSTC
-
NASDAQ
Biospecifics Technologie
Medical-Biomed/Biotech
|
$63.98
|
-0.04
-0.06% |
$64.81
|
35,295
86.09% of 50 DAV
50 DAV is 41,000
|
$68.00
-5.91%
|
1/18/2019
|
$67.40
|
PP = $66.31
|
|
MB = $69.63
|
Most Recent Note - 1/28/2019 5:56:47 PM
Y - Thinly traded Biomed/Biotech firm has recently been sputtering below its pivot point. Confirming volume-driven gains for a new high close would be a reassuring sign of institutional accumulation.
>>> FEATURED STOCK ARTICLE : Thinly Traded Biotech Shows Signs of Accumulation - 1/18/2019 |
View all notes |
Set NEW NOTE alert |
Company Profile |
SEC
News |
Chart |
Request a new note
C
A
S
I |
UBNT
-
NASDAQ
Ubiquiti Networks
TELECOMMUNICATIONS - Diversified Communication Serv
|
$106.79
|
-0.51
-0.48% |
$107.19
|
134,394
35.65% of 50 DAV
50 DAV is 377,000
|
$115.44
-7.49%
|
11/9/2018
|
$108.20
|
PP = $101.43
|
|
MB = $106.50
|
Most Recent Note - 1/28/2019 5:59:36 PM
G - Still quietly consolidating above its 50 DMA line ($105.18). Faces some resistance due to overhead supply up to the $115 level. Prior low ($92.08 on 12/24/18) defines the next important support. Fundamentals remain strong.
>>> FEATURED STOCK ARTICLE : Sputtering Below 50-Day Moving Average Again - 1/15/2019 |
View all notes |
Set NEW NOTE alert |
Company Profile |
SEC
News |
Chart |
Request a new note
C
A
S
I |
PYPL
-
NASDAQ
Paypal Holdings Inc
Finance-CrdtCard/PmtPr
|
$92.30
|
-1.98
-2.10% |
$93.42
|
7,360,174
81.88% of 50 DAV
50 DAV is 8,989,000
|
$94.58
-2.41%
|
1/24/2019
|
$92.56
|
PP = $93.80
|
|
MB = $98.49
|
Most Recent Note - 1/28/2019 1:02:58 PM
Y - Due to report earnings news on 1/30/19. Volume and volatility often increase near earnings news. Pulling back today after wedging to a new all-time high last week. Highlighted in yellow with new pivot point cited based on its 9/13/18 high plus 10 cents. Subsequent gains above the pivot point backed by at least +40% above average volume are needed to trigger a proper technical buy signal.
>>> FEATURED STOCK ARTICLE : Perched Within Striking Distance of High Ahead of Earnings News - 1/24/2019 |
View all notes |
Set NEW NOTE alert |
Company Profile |
SEC
News |
Chart |
Request a new note
C
A
S
I |
Symbol/Exchange
Company Name
Industry Group |
PRICE |
CHANGE
(%Change) |
Day High |
Volume
(% DAV)
(% 50 day avg vol) |
52 Wk Hi
% From Hi |
Featured
Date |
Price
Featured |
Pivot Featured |
|
Max Buy |
ALRM
-
NASDAQ
Alarm.com Holdings Inc
Security/Sfty
|
$62.88
|
+0.24
0.38% |
$63.15
|
447,727
91.56% of 50 DAV
50 DAV is 489,000
|
$63.72
-1.32%
|
1/22/2019
|
$60.52
|
PP = $60.30
|
|
MB = $63.32
|
Most Recent Note - 1/25/2019 5:06:15 PM
Y - Gapped up and posted a gain today for a new high with +29% above average volume, adding to an impressive spurt of gains. Prior highs define initial support to watch on pullbacks.
>>> FEATURED STOCK ARTICLE : Pullback Broke Steak of Gains and Reversed From New High - 1/22/2019 |
View all notes |
Set NEW NOTE alert |
Company Profile |
SEC
News |
Chart |
Request a new note
C
A
S
I |
PLNT
-
NYSE
Planet Fitness Inc Cl A
Leisure-Services
|
$57.74
|
+0.17
0.30% |
$58.40
|
785,388
62.78% of 50 DAV
50 DAV is 1,251,000
|
$59.52
-2.99%
|
11/7/2018
|
$57.10
|
PP = $55.45
|
|
MB = $58.22
|
Most Recent Note - 1/25/2019 5:09:15 PM
Y - Consolidating below its "max buy" level and holding its ground in a tight range near its all-time high. Its 50 DMA line ($54.69) defines important near-term support to watch above the recent low ($48). See the latest FSU analysis for more details and a new annotated graph.
>>> FEATURED STOCK ARTICLE : Hovering in a Tight Range Near All-Time High - 1/25/2019 |
View all notes |
Set NEW NOTE alert |
Company Profile |
SEC
News |
Chart |
Request a new note
C
A
S
I |
TEAM
-
NASDAQ
Atlassian Corp Plc Cl A
Comp Sftwr-Spec Enterprs
|
$94.72
|
-1.14
-1.19% |
$95.12
|
954,660
56.09% of 50 DAV
50 DAV is 1,702,000
|
$100.00
-5.28%
|
1/7/2019
|
$94.68
|
PP = $98.31
|
|
MB = $103.23
|
Most Recent Note - 1/28/2019 5:51:08 PM
Y - Hovering near its high with lighter than average volume for the past 3 sessions. Reported earnings +92% on +39% sales revenues for the Dec '18 quarter. Subsequent gains and a strong close above the pivot point backed by at least +40% above average volume may help to clinch a convincing technical buy signal. Its 50 DMA line ($84.41) and prior low define near-term support to watch on pullbacks. See the latest FSU analysis for more details and a new annotated graph.
>>> FEATURED STOCK ARTICLE : Volume Light While Hovering Near High - 1/28/2019 |
View all notes |
Set NEW NOTE alert |
Company Profile |
SEC
News |
Chart |
Request a new note
C
A
S
I |
INVA
-
NASDAQ
Innoviva Inc
Medical-Biomed/Biotech
|
$19.68
|
-0.15
-0.76% |
$19.92
|
729,445
70.07% of 50 DAV
50 DAV is 1,041,000
|
$19.96
-1.40%
|
11/23/2018
|
$17.74
|
PP = $18.09
|
|
MB = $18.99
|
Most Recent Note - 1/28/2019 5:53:28 PM
G - Volume totals have been cooling while stubbornly holding its ground near its 52-week high. The prior high ($18.60 on 12/03/18) defines initial support above its 50 DMA line ($17.70).
>>> FEATURED STOCK ARTICLE : Perched at High Following Volume-Driven Gains - 1/17/2019 |
View all notes |
Set NEW NOTE alert |
Company Profile |
SEC
News |
Chart |
Request a new note
C
A
S
I |
|
|
|
THESE ARE NOT BUY RECOMMENDATIONS!
Comments contained in the body of this report are technical
opinions only. The material herein has been obtained
from sources believed to be reliable and accurate, however,
its accuracy and completeness cannot be guaranteed.
This site is not an investment advisor, hence it does
not endorse or recommend any securities or other investments.
Any recommendation contained in this report may not
be suitable for all investors and it is not to be deemed
an offer or solicitation on our part with respect to
the purchase or sale of any securities. All trademarks,
service marks and trade names appearing in this report
are the property of their respective owners, and are
likewise used for identification purposes only.
This report is a service available
only to active Paid Premium Members.
You may opt-out of receiving report notifications
at any time. Questions or comments may be submitted
by writing to Premium Membership Services 665 S.E. 10 Street, Suite 201 Deerfield Beach, FL 33441-5634 or by calling 1-800-965-8307
or 954-785-1121.
|
|
|