You are not logged in.
This means you
CAN ONLY VIEW reports that were published prior to Sunday, February 25, 2024.
You
MUST UPGRADE YOUR MEMBERSHIP if you want to see any current reports.
AFTER MARKET UPDATE - THURSDAY, JANUARY 27TH, 2022
Previous After Market Report Next After Market Report >>>
|
|
|
|
DOW |
-7.31 |
34,160.78 |
-0.02% |
|
Volume |
1,075,602,623 |
-7% |
|
Volume |
5,169,975,800 |
-10% |
|
NASDAQ |
-189.34 |
13,352.78 |
-1.40% |
|
Advancers |
904 |
28% |
|
Advancers |
968 |
22% |
|
S&P 500 |
-23.42 |
4,326.51 |
-0.54% |
|
Decliners |
2,381 |
72% |
|
Decliners |
3,507 |
78% |
|
Russell 2000 |
-45.18 |
1,931.29 |
-2.29% |
|
52 Wk Highs |
36 |
|
|
52 Wk Highs |
22 |
|
|
S&P 600 |
-25.12 |
1,252.49 |
-1.97% |
|
52 Wk Lows |
429 |
|
|
52 Wk Lows |
848 |
|
|
Damaging losses for the major averages recently signaled a market correction (M criteria). Greater caution is advised until strength returns. Disciplined investors know to avoid new buying efforts and to raise cash by selling faltering stocks on a case-by-case basis.
|
 |
Major Averages Slumped Yet Again Erasing Early Gains
Kenneth J. Gruneisen - Passed the CAN SLIM® Master's Exam
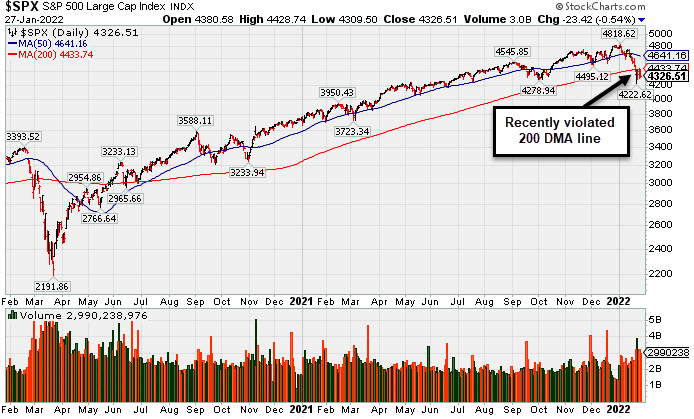
The Dow lost 7 points, wiping out an earlier advance of more than 600 points. The S&P 500 slipped 0.5%, erasing a morning rally of nearly 2%. The broad benchmark is now 9.8% below its January 3 record and poised for its worst month since March 2020 (-9.2% month-to-date). The Nasdaq Composite fell 1.4%, heading toward a fifth consecutive weekly decline, which would mark its longest losing streak since 2012. Volume totals reported were lighter than the prior session on the NYSE and on the Nasdaq exchange. Decliners led advancers by almost a 3-1 margin on the NYSE and more than 3-1 on the Nasdaq exchange. There were 10 high-ranked companies from the Leaders List that hit new 52-week highs and were listed on the BreakOuts Page, versus 12 on the prior session. New 52-week lows totals swelled again and easily outnumbered shrinking new 52-week highs totals on the NYSE and on the Nasdaq exchange. The market averages (M criteria) have seen damaging losses noted that signaled a more serious market correction. Greater caution is suggested until noted strength returns. PICTURED: The S&P 500 Index suffered its 7th loss in the span of 8 sessions. It halted its slide after undercutting its September low and decisively violating its 200-day moving average (DMA) line. At Monday's low it was -12.4 off its January 4 record high. Friday marks Day 5 of the rally attempt - an important time for all disciplined investors now watching for a follow-through day to confirm a new uptrend.
U.S. stocks finished lower on Thursday, with the major averages once again giving up early session gains. Wall Street remained jittery about the Federal Reserve’s (Fed) pivot away from highly accommodative, pandemic-era monetary stimulus. Yesterday, officials set the stage for an interest rate hike in March, while Fed Chair Jerome Powell’s remarks were interpreted as more hawkish than expected.
In earnings, Tesla Inc. (TSLA -11.55%) fell after warning of ongoing supply chain disruptions, while Intel Corp. (INTC -7.04%) fell following weaker-than-anticipated guidance. In other corporate news, Netflix, Inc. (NFLX +7.51%) rose on reports billionaire investor William Ackman’s hedge fund purchased more than $1 billion worth of shares.
On the data front, an advance reading of fourth-quarter U.S. GDP showed the economy expanded at a 6.9% annualized pace, capping the strongest year-over-year growth rate since 1984. Separately, weekly initial jobless claims eased to 260,000. Treasuries were mixed, with the yield on the 10-year note retreating six basis points (0.06%) to 1.81%, while the yield on the two-year note rose three basis points (0.03%) to 1.19%, a 23-month peak. In FOREX trading, a gauge of the U.S. dollar jumped the most since March 2020, rallying 0.8% to its highest level since mid-2020.
|
 Kenneth J. Gruneisen started out as a licensed stockbroker in August 1987, a couple of months prior to the historic stock market crash that took the Dow Jones Industrial Average down -22.6% in a single day. He has published daily fact-based fundamental and technical analysis on high-ranked stocks online for two decades. Through FACTBASEDINVESTING.COM, Kenneth provides educational articles, news, market commentary, and other information regarding proven investment systems that work in good times and bad.
Comments contained in the body of this report are technical opinions only and are not necessarily those of Gruneisen Growth Corp. The material herein has been obtained from sources believed to be reliable and accurate, however, its accuracy and completeness cannot be guaranteed. Our firm, employees, and customers may effect transactions, including transactions contrary to any recommendation herein, or have positions in the securities mentioned herein or options with respect thereto. Any recommendation contained in this report may not be suitable for all investors and it is not to be deemed an offer or solicitation on our part with respect to the purchase or sale of any securities. |
|
 |
Tech Sector, Gold & Silver, and Bank Indexes Led Group Decliners
Kenneth J. Gruneisen - Passed the CAN SLIM® Master's Exam
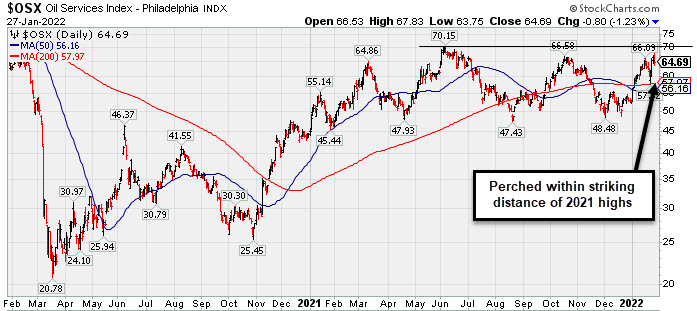
The Semiconductor Index ($SOX -4.78%) led the tech sector lower while the Biotech Index ($BTK -1.96%) and Networking Index ($NWX -1.72%) also slumped. The Gold & Silver Index ($XAU -2.91%) suffered a big loss. Energy-linked groups were mixed as the Oil Services Index ($OSX -1.23%) fell and the Integrated Oil Index ($XOI +1.26%) rose. The Bank Index ($BKX -1.20%) slumped and the Broker/Dealer Index ($XBD -0.29%) edged lower while the Retail Index ($RLX +0.19%) eked out a small gain.
PICTURED: The Oil Services Index ($OSX -1.23%) is perched within striking distance of its 2021 highs.
| Oil Services |
$OSX |
64.69 |
-0.80 |
-1.23% |
+22.70% |
| Integrated Oil |
$XOI |
1,392.31 |
+17.26 |
+1.26% |
+18.17% |
| Semiconductor |
$SOX |
3,243.99 |
-163.01 |
-4.78% |
-17.79% |
| Networking |
$NWX |
832.63 |
-14.58 |
-1.72% |
-14.26% |
| Broker/Dealer |
$XBD |
460.26 |
-1.32 |
-0.29% |
-5.46% |
| Retail |
$RLX |
3,605.66 |
+6.93 |
+0.19% |
-14.69% |
| Gold & Silver |
$XAU |
122.14 |
-3.66 |
-2.91% |
-7.78% |
| Bank |
$BKX |
133.04 |
-1.62 |
-1.20% |
+0.62% |
| Biotech |
$BTK |
4,790.85 |
-95.92 |
-1.96% |
-13.18% |
|
|
|
 |
Formed Double Bottom Base and Faces Little Resistance
Kenneth J. Gruneisen - Passed the CAN SLIM® Master's Exam
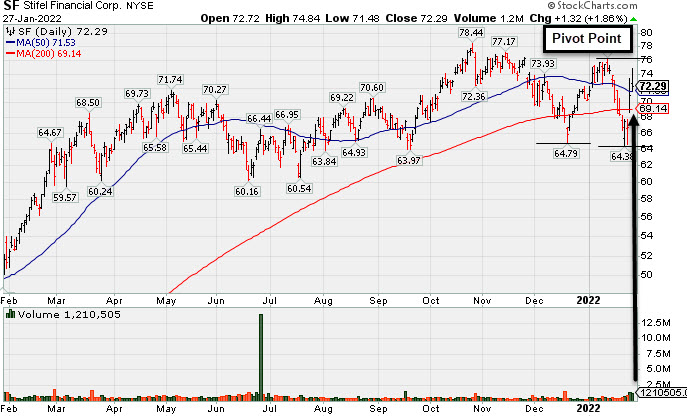
Stifel Financial Corp (SF +$1.32 or +1.86% to $72.29) was highlighted in yellow with pivot point cited based on its 1/12/22 high in the earlier mid-day report while building on a "double bottom" base. Disciplined investors will wait for a noted follow-through day in the market (M criteria) to confirm a new uptrend. Subsequent gains above the stock's pivot point backed by at least +40% above average volume are needed to trigger a proper technical buy signal. It has been rebounding toward its all-time high with 2 consecutive volume-driven gains after again briefly undercutting its 200-day moving average (DMA) line.
It has a 98 Earnings Per Share Rating, well above the 80+ minimum guideline for buy candidates. It reported strong results above the +25% minimum guideline (C criteria). in the past 5 quarterly comparisons through Dec '21 versus the year ago period. Annual earnings (A criteria) history has been good.
It hails from the FINANCIAL SERVICES - Investment Brokerage - Regional industry group which is currently ranked 51st on the 197 Industry Groups list. There are 104.3 million shares outstanding (S criteria). The number of top-rated funds owning its shares rose from 601 in Mar '21 to 613 in Dec '21. Its current Up/Down Volume Ratio of 0.8 is an unbiased indication its shares have been under distributional pressure over the past 50 days. It has a Timeliness Rating of B and Sponsorship Rating of C. |
|
|
Color Codes Explained :
Y - Better candidates highlighted by our
staff of experts.
G - Previously featured
in past reports as yellow but may no longer be buyable under the
guidelines.
***Last / Change / Volume data in this table is the closing quote data***
|
|
|
THESE ARE NOT BUY RECOMMENDATIONS!
Comments contained in the body of this report are technical
opinions only. The material herein has been obtained
from sources believed to be reliable and accurate, however,
its accuracy and completeness cannot be guaranteed.
This site is not an investment advisor, hence it does
not endorse or recommend any securities or other investments.
Any recommendation contained in this report may not
be suitable for all investors and it is not to be deemed
an offer or solicitation on our part with respect to
the purchase or sale of any securities. All trademarks,
service marks and trade names appearing in this report
are the property of their respective owners, and are
likewise used for identification purposes only.
This report is a service available
only to active Paid Premium Members.
You may opt-out of receiving report notifications
at any time. Questions or comments may be submitted
by writing to Premium Membership Services 665 S.E. 10 Street, Suite 201 Deerfield Beach, FL 33441-5634 or by calling 1-800-965-8307
or 954-785-1121.
|
|
|