You are not logged in.
This means you
CAN ONLY VIEW reports that were published prior to Sunday, February 25, 2024.
You
MUST UPGRADE YOUR MEMBERSHIP if you want to see any current reports.
AFTER MARKET UPDATE - THURSDAY, JANUARY 24TH, 2019
Previous After Market Report Next After Market Report >>>
|
|
|
|
DOW |
-22.38 |
24,553.24 |
-0.09% |
|
Volume |
790,086,120 |
+2% |
|
Volume |
2,376,874,560 |
+5% |
|
NASDAQ |
+47.69 |
7,073.46 |
+0.68% |
|
Advancers |
2,003 |
68% |
|
Advancers |
1,883 |
62% |
|
S&P 500 |
+3.63 |
2,642.33 |
+0.14% |
|
Decliners |
961 |
32% |
|
Decliners |
1,147 |
38% |
|
Russell 2000 |
+10.15 |
1,464.41 |
+0.70% |
|
52 Wk Highs |
32 |
|
|
52 Wk Highs |
29 |
|
|
S&P 600 |
+5.50 |
912.68 |
+0.61% |
|
52 Wk Lows |
22 |
|
|
52 Wk Lows |
32 |
|
|
 |
Breadth Positive as Major Indices Ended Mixed
Kenneth J. Gruneisen - Passed the CAN SLIM® Master's Exam
Stocks finished mixed on Thursday. The Dow fell 22 points to 24,553 while the S&P 500 added 3 points to 2,642. The Nasdaq Composite gained 47 points to 7,073. The volume totals were higher than the prior session on the NYSE and on the Nasdaq exchange. Breadth was positive as advancers led decliners by a 2-1 margin on the NYSE and 3-2 on the Nasdaq exchange. There were 10 high-ranked companies from the Leaders List that made a new 52-week high and were listed on the BreakOuts Page, versus the total of 5 on the prior session. New 52-week highs outnumbered new 52-week lows on the NYSE, but new lows still outnumbered new highs on the Nasdaq exchange versus the prior session. The major indices are in a confirmed uptrend after recently noted improvements helped to signal a change in market direction (M criteria) back to a bullish stance. The Featured Stocks Page provides the most timely analysis on high-ranked leaders. Charts used courtesy of www.stockcharts.com
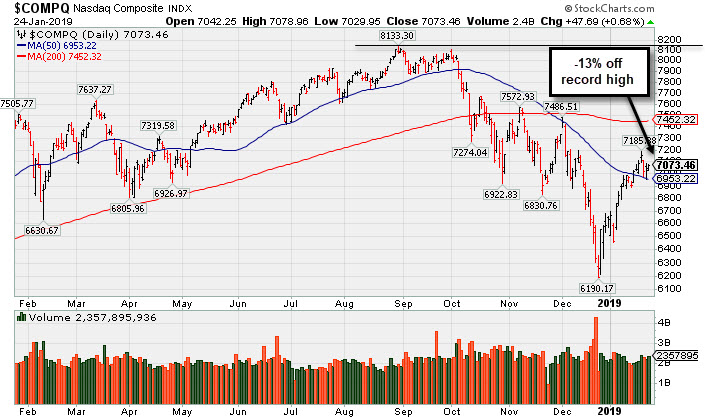
PICTURED: The Nasdaq Composite Index ended -13% off its record high hit on 8/30/18. It recently rebounded above its 50-day moving average (DMA) line. Long-time readers may note from that the major averages cannot be considered to be in "healthy" shape while they are below their respective 200 DMA lines.
The Dow and S&P 500 fluctuated between gains and losses as strength in Technology shares balance renewed trade concerns. Comments from Commerce Secretary Wilbur Ross that the U.S. and China are “miles and miles from getting a resolution” weighed on sentiment. On the data front, initial jobless claims fell to a 49-year low of 199,000 in the most recent week. Research firm Markit’s flash readings on service and manufacturing activity showed both sectors expanded modestly in January. A separate release revealed the leading indicator dipped 0.1%, the second negative reading since January 2016.
Eight of 11 S&P 500 sectors ended in positive territory. Technology shares outperformed as bellwether chipmaker Texas Instruments (TXN +6.91%) rose after topping consensus earnings estimates. Energy stocks also outperformed in sympathy with higher oil prices. Airlines lifted Industrials with American Airlines (AAL +6.35%) rose after releasing strong quarterly results. Consumer Staples was a notable laggard with spice maker McCormick (MKC -10.54%) gapped down below its 200 DMA line after missing analyst estimates on the top and bottom line.
Treasuries strengthened with the yield on the 10-year note down four basis points to 2.71%. In commodities, WTI crude gained 1.1% to $53.20/barrel. COMEX gold fell 0.3% to $1,279.70/ounce amid a stronger dollar. |
 Kenneth J. Gruneisen started out as a licensed stockbroker in August 1987, a couple of months prior to the historic stock market crash that took the Dow Jones Industrial Average down -22.6% in a single day. He has published daily fact-based fundamental and technical analysis on high-ranked stocks online for two decades. Through FACTBASEDINVESTING.COM, Kenneth provides educational articles, news, market commentary, and other information regarding proven investment systems that work in good times and bad.
Comments contained in the body of this report are technical opinions only and are not necessarily those of Gruneisen Growth Corp. The material herein has been obtained from sources believed to be reliable and accurate, however, its accuracy and completeness cannot be guaranteed. Our firm, employees, and customers may effect transactions, including transactions contrary to any recommendation herein, or have positions in the securities mentioned herein or options with respect thereto. Any recommendation contained in this report may not be suitable for all investors and it is not to be deemed an offer or solicitation on our part with respect to the purchase or sale of any securities. |
|
 |
Tech, Retail, Financial, and Energy Groups Rose
Kenneth J. Gruneisen - Passed the CAN SLIM® Master's Exam
The Retail Index ($RLX +0.51%), Bank Index ($BKX +0.45%), and the Broker/Dealer Index ($XBD +0.45%) each ended with a modest gain on Thursday. The tech sector was led by the Semiconductor Index ($SOX +5.73%) while the the Biotech Index ($BTK +0.57%) and the Networking Index ($NWX +0.83%) posted smaller gains. Energy-linked groups also had positive tilt as the Oil Services Index ($OSX +2.24%) outpaced the Integrated Oil Index ($XOI +0.23%), meanwhile, the Gold & Silver Index ($XAU -0.42%) was a laggard as it ended the session lower.
Charts courtesy of www.stockcharts.com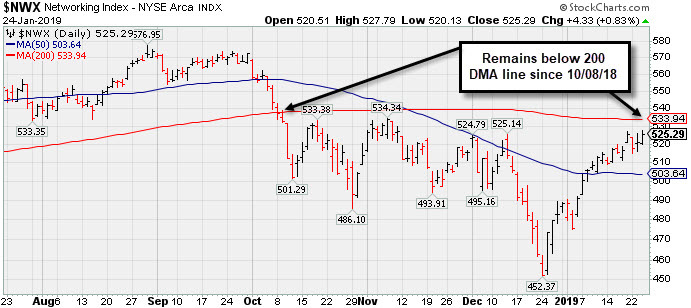 PICTURED: The Networking Index ($NWX +0.83%) remains below its 200-day moving average (DMA) line since 10/08/18
| Oil Services |
$OSX |
94.93 |
+2.08 |
+2.24% |
+17.78% |
| Integrated Oil |
$XOI |
1,239.57 |
+2.91 |
+0.23% |
+6.94% |
| Semiconductor |
$SOX |
1,253.91 |
+67.96 |
+5.73% |
+8.55% |
| Networking |
$NWX |
525.29 |
+4.33 |
+0.83% |
+7.49% |
| Broker/Dealer |
$XBD |
257.93 |
+1.17 |
+0.45% |
+8.68% |
| Retail |
$RLX |
2,084.98 |
+10.48 |
+0.51% |
+6.84% |
| Gold & Silver |
$XAU |
68.57 |
-0.29 |
-0.42% |
-2.96% |
| Bank |
$BKX |
97.26 |
+0.43 |
+0.44% |
+13.37% |
| Biotech |
$BTK |
4,783.66 |
+27.16 |
+0.57% |
+13.33% |
|
|
|
 |
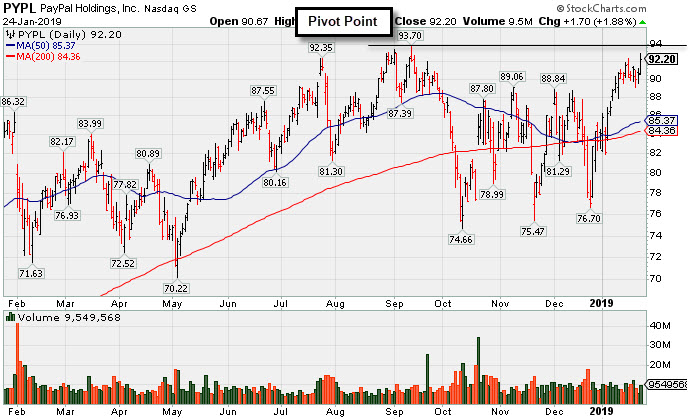
Perched Within Striking Distance of High Ahead of Earnings News
Kenneth J. Gruneisen - Passed the CAN SLIM® Master's Exam
Paypal Holdings Inc (PYPL +$1.70 or +1.88% to $92.20) was highlighted in yellow with new pivot point cited based on its 9/13/18 high plus 10 cents in the earlier mid-day report (read here). It is challenging its all-time high. Subsequent gains above the pivot point backed by at least +40% above average volume are needed to trigger a proper technical buy signal. Its 50-day moving average (DMA) line ($85.37) and 200 DMA line define important near-term support above recent lows in the $75 area.
Keep in mind that it is due to report earnings news on 1/30/19. Volume and volatility often increase near earnings news. Fundamentals remain strong. It reported earnings +26% on +14% sales revenues for the Sep '18 quarter, its 6th consecutive quarterly earnings increase above the +25% minimum guideline (C criteria).
PYPL went through a choppy consolidation since last shown in this FSU section on 9/12/18 with an annotated graph under the headline, "Consolidating Above 50-Day Moving Average Near High". The high-ranked Finance - Credit Card/Payment Processing firm saw the number of top-rated funds owning its shares rise from 2,054 in Mar '17 to 2,486 in Dec '18, a reassuring sign concerning the I criteria. Its current Up/Down Volume Ratio of 1.2 is an unbiased indication its shares have been under slight accumulation over the past 50 days. It has a Timeliness Rating of A and Sponsorship Rating of B. |
|
|
Color Codes Explained :
Y - Better candidates highlighted by our
staff of experts.
G - Previously featured
in past reports as yellow but may no longer be buyable under the
guidelines.
***Last / Change / Volume data in this table is the closing quote data***
Symbol/Exchange
Company Name
Industry Group |
PRICE |
CHANGE
(%Change) |
Day High |
Volume
(% DAV)
(% 50 day avg vol) |
52 Wk Hi
% From Hi |
Featured
Date |
Price
Featured |
Pivot Featured |
|
Max Buy |
MLR
-
NYSE
Miller Industries Inc
AUTOMOTIVE - Auto Parts
|
$29.32
|
-0.03
-0.10% |
$29.51
|
21,655
55.53% of 50 DAV
50 DAV is 39,000
|
$30.00
-2.27%
|
11/30/2018
|
$28.35
|
PP = $29.50
|
|
MB = $30.98
|
Most Recent Note - 1/23/2019 5:18:49 PM
Y - Held its ground today near its high. Posted a gain on 1/18/19 backed by +39% above average volume. Subsequent gains above the pivot point backed by at least +40% above average volume may help clinch a proper technical buy signal. Its 50 DMA line and recent low define near-term support to watch on pullbacks.
>>> FEATURED STOCK ARTICLE : Perched Within Close Striking Distance of Prior High - 1/8/2019 |
View all notes |
Set NEW NOTE alert |
Company Profile |
SEC
News |
Chart |
Request a new note
C
A
S
I |
LHCG
-
NASDAQ
L H C Group Inc
HEALTH SERVICES - Home Health Care
|
$108.23
|
+1.16
1.08% |
$109.26
|
230,450
86.96% of 50 DAV
50 DAV is 265,000
|
$108.84
-0.56%
|
1/23/2019
|
$107.29
|
PP = $107.61
|
|
MB = $112.99
|
Most Recent Note - 1/23/2019 5:17:12 PM
Y - Posted a gain with near average volume today for a best-ever close. Highlighted in yellow with pivot point cited based on its 11/29/18 high plus 10 cents in the earlier mid-day report. Hit a new high today after an 8-week cup shaped base. Subsequent gains above the pivot point backed by at least +40% above average volume may trigger a technical buy signal. See the latest FSU analysis for more details and a new annotated graph. Found support above its 200 DMA line since noted in the 12/17/18 mid-day report - "The Sep '18 report marked its 3rd strong quarterly earnings increase above the +25% minimum guideline (C criteria), helping it better match with the fact-based investment system's fundamental guidelines."
>>> FEATURED STOCK ARTICLE : Healthcare Services Firm Reached a New High - 1/23/2019 |
View all notes |
Set NEW NOTE alert |
Company Profile |
SEC
News |
Chart |
Request a new note
C
A
S
I |
BSTC
-
NASDAQ
Biospecifics Technologie
Medical-Biomed/Biotech
|
$63.98
|
+1.80
2.89% |
$64.18
|
37,409
89.07% of 50 DAV
50 DAV is 42,000
|
$68.00
-5.91%
|
1/18/2019
|
$67.40
|
PP = $66.31
|
|
MB = $69.63
|
 Most Recent Note - 1/24/2019 5:11:48 PM
Y - Posted a gain today with lighter volume, rebounding near its pivot point. Thinly traded Biomed/Biotech firm was covered in greater detail in the 1/18/19 FSU analysis with an annotated graph.
>>> FEATURED STOCK ARTICLE : Thinly Traded Biotech Shows Signs of Accumulation - 1/18/2019 |
View all notes |
Set NEW NOTE alert |
Company Profile |
SEC
News |
Chart |
Request a new note
C
A
S
I |
UBNT
-
NASDAQ
Ubiquiti Networks
TELECOMMUNICATIONS - Diversified Communication Serv
|
$107.17
|
+0.80
0.75% |
$108.04
|
251,837
60.54% of 50 DAV
50 DAV is 416,000
|
$115.44
-7.16%
|
11/9/2018
|
$108.20
|
PP = $101.43
|
|
MB = $106.50
|
Most Recent Note - 1/22/2019 6:09:58 PM
G - Faces some resistance due to overhead supply up to the $115 level. Quietly consolidating near its 50 DMA line ($104.75). Prior low ($92.08 on 12/24/18) defines the next important support. Fundamentals remain strong.
>>> FEATURED STOCK ARTICLE : Sputtering Below 50-Day Moving Average Again - 1/15/2019 |
View all notes |
Set NEW NOTE alert |
Company Profile |
SEC
News |
Chart |
Request a new note
C
A
S
I |
PYPL
-
NASDAQ
Paypal Holdings Inc
Finance-CrdtCard/PmtPr
|
$92.20
|
+1.70
1.88% |
$92.99
|
9,549,568
107.38% of 50 DAV
50 DAV is 8,893,000
|
$93.70
-1.60%
|
1/24/2019
|
$92.56
|
PP = $93.80
|
|
MB = $98.49
|
Most Recent Note - 1/24/2019 5:08:20 PM
Y - Posted a solid gain on near average volume challenging its all-time high. Highlighted in yellow with new pivot point cited based on its 9/13/18 high plus 10 cents. Subsequent gains above the pivot point backed by at least +40% above average volume are needed to trigger a proper technical buy signal. Fundamentals remain strong. Due to report earnings news on 1/30/19. See the latest FSU analysis for more details and a new annotated graph.
>>> FEATURED STOCK ARTICLE : Perched Within Striking Distance of High Ahead of Earnings News - 1/24/2019 |
View all notes |
Set NEW NOTE alert |
Company Profile |
SEC
News |
Chart |
Request a new note
C
A
S
I |
Symbol/Exchange
Company Name
Industry Group |
PRICE |
CHANGE
(%Change) |
Day High |
Volume
(% DAV)
(% 50 day avg vol) |
52 Wk Hi
% From Hi |
Featured
Date |
Price
Featured |
Pivot Featured |
|
Max Buy |
ALRM
-
NASDAQ
Alarm.com Holdings Inc
Security/Sfty
|
$61.05
|
+0.88
1.46% |
$61.19
|
450,444
86.13% of 50 DAV
50 DAV is 523,000
|
$61.64
-0.95%
|
1/22/2019
|
$60.52
|
PP = $60.30
|
|
MB = $63.32
|
Most Recent Note - 1/22/2019 12:11:38 PM
Y - Color code is changed to yellow with pivot point cited based on its 10/01/18 high plus 10 cents. During a choppy 16-week consolidation its 200 DMA line acted as support. Friday's gain above the pivot point backed by +124% above average volume triggered a technical buy signal. Reported Sep '18 quarterly earnings +33% on +24% sales revenues, its 11th consecutive comparison above the +25% minimum earnings guideline (C criteria). Annual earnings (A criteria) growth has been strong after a downturn in FY '15. Up considerably from its $14 IPO on 6/26/15.
>>> FEATURED STOCK ARTICLE : Pullback Broke Steak of Gains and Reversed From New High - 1/22/2019 |
View all notes |
Set NEW NOTE alert |
Company Profile |
SEC
News |
Chart |
Request a new note
C
A
S
I |
PLNT
-
NYSE
Planet Fitness Inc Cl A
Leisure-Services
|
$57.62
|
-0.18
-0.31% |
$58.13
|
643,406
50.94% of 50 DAV
50 DAV is 1,263,000
|
$59.52
-3.19%
|
11/7/2018
|
$57.10
|
PP = $55.45
|
|
MB = $58.22
|
Most Recent Note - 1/22/2019 6:07:59 PM
G - Ended near its "max buy" level today, recently holding its ground in a tight range near its all-time high. Its 50 DMA line ($54.57) defines important near-term support to watch above the recent low ($48).
>>> FEATURED STOCK ARTICLE : Found Prompt Support Near 50-Day Moving Average Line - 1/4/2019 |
View all notes |
Set NEW NOTE alert |
Company Profile |
SEC
News |
Chart |
Request a new note
C
A
S
I |
TEAM
-
NASDAQ
Atlassian Corp Plc Cl A
Comp Sftwr-Spec Enterprs
|
$93.32
|
-0.33
-0.35% |
$94.90
|
1,203,148
71.28% of 50 DAV
50 DAV is 1,688,000
|
$100.00
-6.68%
|
1/7/2019
|
$94.68
|
PP = $98.31
|
|
MB = $103.23
|
Most Recent Note - 1/23/2019 11:39:46 AM
Y - There was a big "negative reversal" and weak close on 1/18/19 after hitting a new high, and heavy volume behind recent losses was action indicative of distributional pressure. Volume and volatility often increase near earnings news. Reported earnings +92% on +39% sales revenues for the Dec '18 quarter. Recently held its ground in a tight range, churning higher volume while perched within close striking distance of its prior high. Color code was changed to yellow with new pivot point cited based on its 10/01/18 high plus 10 cents. Subsequent gains and a strong close above the pivot point backed by at least +40% above average volume may help to clinch a convincing technical buy signal. Its 50 DMA line ($83.59) and prior low define near-term support to watch on pullbacks.
>>> FEATURED STOCK ARTICLE : Rebounding Near Prior High Which May Act as Resistance - 1/7/2019 |
View all notes |
Set NEW NOTE alert |
Company Profile |
SEC
News |
Chart |
Request a new note
C
A
S
I |
INVA
-
NASDAQ
Innoviva Inc
Medical-Biomed/Biotech
|
$19.65
|
-0.04
-0.20% |
$19.84
|
338,973
31.21% of 50 DAV
50 DAV is 1,086,000
|
$19.96
-1.55%
|
11/23/2018
|
$17.74
|
PP = $18.09
|
|
MB = $18.99
|
Most Recent Note - 1/22/2019 6:06:05 PM
G - Touched a new high but reversed into the red for a loss with higher volume. The prior high ($18.60 on 12/03/18) defines initial support above its 50 DMA line ($17.50). See the latest FSU analysis for more details and an annotated graph.
>>> FEATURED STOCK ARTICLE : Perched at High Following Volume-Driven Gains - 1/17/2019 |
View all notes |
Set NEW NOTE alert |
Company Profile |
SEC
News |
Chart |
Request a new note
C
A
S
I |
|
|
|
THESE ARE NOT BUY RECOMMENDATIONS!
Comments contained in the body of this report are technical
opinions only. The material herein has been obtained
from sources believed to be reliable and accurate, however,
its accuracy and completeness cannot be guaranteed.
This site is not an investment advisor, hence it does
not endorse or recommend any securities or other investments.
Any recommendation contained in this report may not
be suitable for all investors and it is not to be deemed
an offer or solicitation on our part with respect to
the purchase or sale of any securities. All trademarks,
service marks and trade names appearing in this report
are the property of their respective owners, and are
likewise used for identification purposes only.
This report is a service available
only to active Paid Premium Members.
You may opt-out of receiving report notifications
at any time. Questions or comments may be submitted
by writing to Premium Membership Services 665 S.E. 10 Street, Suite 201 Deerfield Beach, FL 33441-5634 or by calling 1-800-965-8307
or 954-785-1121.
|
|
|