You are not logged in.
This means you
CAN ONLY VIEW reports that were published prior to Tuesday, February 20, 2024.
You
MUST UPGRADE YOUR MEMBERSHIP if you want to see any current reports.
AFTER MARKET UPDATE - THURSDAY, JANUARY 23RD, 2020
Previous After Market Report Next After Market Report >>>
|
|
|
|
DOW |
-26.18 |
29,160.09 |
-0.09% |
|
Volume |
948,487,420 |
+10% |
|
Volume |
2,433,063,590 |
-0% |
|
NASDAQ |
+18.71 |
9,402.48 |
+0.20% |
|
Advancers |
1,425 |
50% |
|
Advancers |
1,419 |
45% |
|
S&P 500 |
+3.79 |
3,325.54 |
+0.11% |
|
Decliners |
1,402 |
50% |
|
Decliners |
1,754 |
55% |
|
Russell 2000 |
+0.55 |
1,685.01 |
+0.03% |
|
52 Wk Highs |
202 |
|
|
52 Wk Highs |
144 |
|
|
S&P 600 |
+1.95 |
1,031.47 |
+0.19% |
|
52 Wk Lows |
45 |
|
|
52 Wk Lows |
44 |
|
|
 |
Major Indices Ended Mixed With Less Leadership
Kenneth J. Gruneisen - Passed the CAN SLIM® Master's Exam
On Wall Street, the Dow slipped 26 points. The S&P 500 added 0.1%, while the Nasdaq Composite rose 0.2%. Advancers led decliners by a very narrow margin on the NYSE, meanwhile decliners outnumbered advancers by a 9-7 margin on the Nasdaq exchange. The reported volume totals were mixed, higher than the prior session total on the NYSE and slightly lower on the Nasdaq exchange. There were 59 high-ranked companies from the Leaders List that hit a new 52-week high and were listed on the BreakOuts Page, versus the total of 113 on the prior session. New 52-week highs totals contracted yet easily outnumbered new 52-week lows totals on the NYSE and on the Nasdaq exchange. The major indices (M criteria) are in a "confirmed uptrend" after enduring distributional pressure in recent weeks. The Featured Stocks Page provides the most timely analysis on high-ranked leaders. Charts used courtesy of www.stockcharts.com
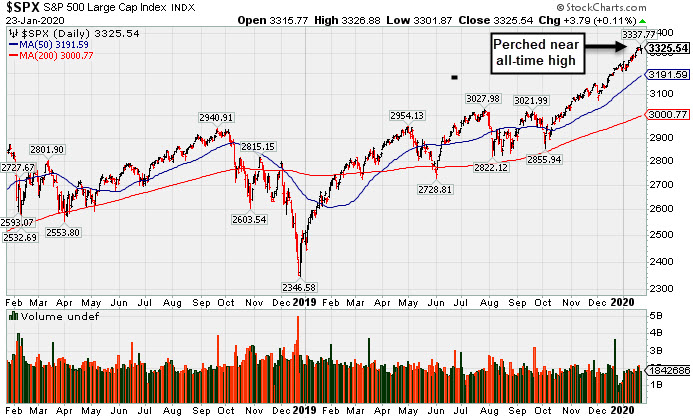
PICTURED: The S&P 500 Index remains perched near its record high
Stocks rebounded from session lows to end mixed on Thursday, as investors digested corporate earnings results and developments on China’s coronavirus. Reports showed the World Health Organization (WHO) called the outbreak a local Chinese emergency, helping to calm fears of an international epidemic. However, stocks in China fell the most since May overnight after authorities put two cities on lockdown in an attempt to contain the spread of the respiratory disease.
Six of 11 S&P 500 sectors finished in negative territory, with Health Care and Energy sectors leading laggards. Industrials outperformed following a rebound in airline companies. American Airlines (AAL +5.42%) and United Airlines (UAL +1.85%) rose. In earnings, Texas Instruments (TXN +0.68%) rose after the chipmaker posted positive quarterly results and improved its current-quarter revenue forecast. Proctor & Gamble (PG 1.-05%) slipped after the consumer products giant missed Wall Street sales expectations for the first time in five quarters, but increased its full-year guidance. Comcast (CMCSA -3.77%) fell after reporting a drop in video-subscribers. Apparel-maker VF Corp. (VFC -9.69%) fell following disappointing quarterly sales and a reduction to its full-year outlook.
Treasuries strengthened, with the yield on the 10-year note down three basis points to 1.73%. On the data front, initial jobless claims came in at 211,000 in the most recent week. Separately, the Leading Index of Economic Indicators declined more than expected in December. In commodities, WTI crude lost 2.0% to $55.58/barrel. COMEX gold added 0.3% to $1,561.40/ounce. |
 Kenneth J. Gruneisen started out as a licensed stockbroker in August 1987, a couple of months prior to the historic stock market crash that took the Dow Jones Industrial Average down -22.6% in a single day. He has published daily fact-based fundamental and technical analysis on high-ranked stocks online for two decades. Through FACTBASEDINVESTING.COM, Kenneth provides educational articles, news, market commentary, and other information regarding proven investment systems that work in good times and bad.
Comments contained in the body of this report are technical opinions only and are not necessarily those of Gruneisen Growth Corp. The material herein has been obtained from sources believed to be reliable and accurate, however, its accuracy and completeness cannot be guaranteed. Our firm, employees, and customers may effect transactions, including transactions contrary to any recommendation herein, or have positions in the securities mentioned herein or options with respect thereto. Any recommendation contained in this report may not be suitable for all investors and it is not to be deemed an offer or solicitation on our part with respect to the purchase or sale of any securities. |
|
 |
Semiconductor and Networking Indexes Rose
Kenneth J. Gruneisen - Passed the CAN SLIM® Master's Exam
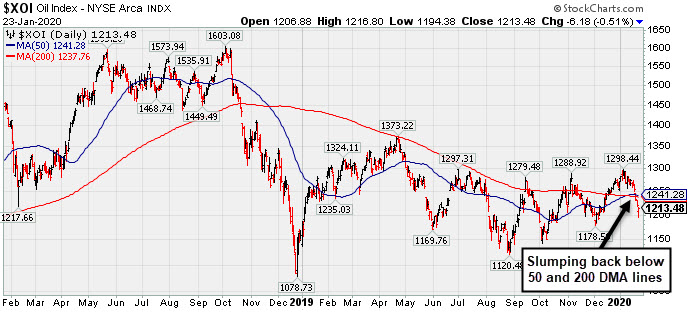
The Broker/Dealer Index ($XBD -0.90%) suffered a larger loss while the Bank Index ($BKX -0.11%) edged lower and the Retail Index ($RLX +0.12%) ended slightly higher. The Semiconductor Index ($SOX +0.78%) led the tech sector while the Networking Index ($NWX +0.64%) also notched a small gain, but the Biotech Index ($BTK -0.99%) fell. Energy-linked groups had a negative bias as the Oil Services Index ($OSX -1.65%) outpaced the Integrated Oil Index ($XOI -0.51%) to the downside and the Gold & Silver Index ($XAU -0.21%) also finished slightly lower.
PICTURED: The Integrated Oil Index ($XOI -0.51%) has slumped back below its 50-day and 200-day moving average lines.
| Oil Services |
$OSX |
70.49 |
-1.19 |
-1.66% |
-9.96% |
| Integrated Oil |
$XOI |
1,213.48 |
-6.18 |
-0.51% |
-4.49% |
| Semiconductor |
$SOX |
1,945.37 |
+15.14 |
+0.78% |
+5.18% |
| Networking |
$NWX |
593.51 |
+3.80 |
+0.64% |
+1.73% |
| Broker/Dealer |
$XBD |
299.19 |
-2.71 |
-0.90% |
+3.03% |
| Retail |
$RLX |
2,488.43 |
+2.86 |
+0.12% |
+1.60% |
| Gold & Silver |
$XAU |
102.93 |
-0.22 |
-0.21% |
-3.73% |
| Bank |
$BKX |
109.80 |
-0.11 |
-0.10% |
-3.14% |
| Biotech |
$BTK |
5,060.50 |
-50.84 |
-0.99% |
-0.14% |
|
|
|
 |
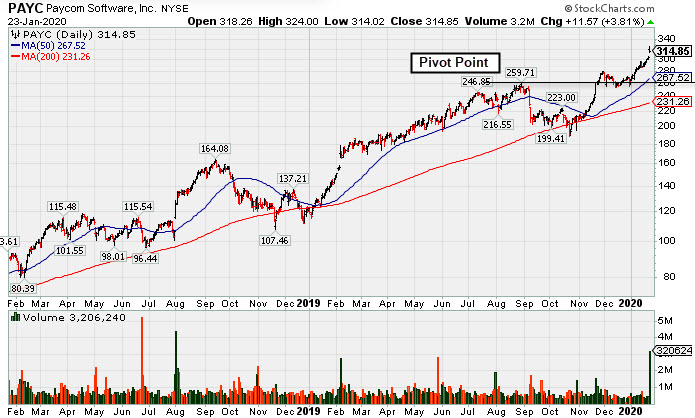
Gapped Up for New High But Ended Near Session Low
Kenneth J. Gruneisen - Passed the CAN SLIM® Master's Exam
Paycom Software Inc (PAYC +$11.57 or +3.81% to $314.85) gapped up today hitting a new all-time high but finished bear the session low. It is very extended from any sound base with above average volume behind its 6th consecutive gain. Its prior high ($279.95 on 11/27/19) and its 50-day moving average (DMA) line ($267.52) define important near-term support levels to watch. Fundamentals remain strong.
PAYC finished strong after highlighted in yellow with new pivot point cited based on its 8/29/19 high plus 10 cents in the 11/20/19 mid-day report (read here). The gain for a new high was backed by +167% above average volume and triggered a new technical buy signal. It was last shown in this FSU section on 1/03/20 under the headline "Perched Near High and Near the Max Buy Level" .
It has an Earnings Per Share Rating of 98, well above the 80+ minimum guidelin efor buy candidates. It reported earnings +35% on +31% sales revenues for the Sep '19 quarter, well above the +25% minimum guideline (C criteria). Its annual earnings (A criteria) history has been strong and steady.
The Computer Software - Enterprise firm's current Up/Down Volume Ratio of 3.9 is an unbiased indication its shares have been under accumulation over the past 50 days. Its small supply of only 58.4 million shares outstanding (S criteria) can contribute to greater price volatility in the event of institutional buying or selling. The number of top-rated funds owning its shares rose from 384 in Jun '17 to 916 in Sep '19, a reassuring sign concerning the I criteria. It has a Timeliness rating of A and Sponsorship rating of B. It completed Secondary Offerings on 11/13/15, 9/16/15, 5/15/15 and 1/14/15 since its $15 IPO on 4/15/14. |
|
|
Color Codes Explained :
Y - Better candidates highlighted by our
staff of experts.
G - Previously featured
in past reports as yellow but may no longer be buyable under the
guidelines.
***Last / Change / Volume data in this table is the closing quote data***
Symbol/Exchange
Company Name
Industry Group |
PRICE |
CHANGE
(%Change) |
Day High |
Volume
(% DAV)
(% 50 day avg vol) |
52 Wk Hi
% From Hi |
Featured
Date |
Price
Featured |
Pivot Featured |
|
Max Buy |
 FTNT
-
NASDAQ
FTNT
-
NASDAQ
Fortinet Inc
Computer Sftwr-Security
|
$119.07
|
+1.25
1.06% |
$119.55
|
1,386,867
118.23% of 50 DAV
50 DAV is 1,173,000
|
$120.44
-1.14%
|
12/9/2019
|
$103.85
|
PP = $106.10
|
|
MB = $111.41
|
Most Recent Note - 1/21/2020 4:21:43 PM
G - Holding its ground stubbornly after wedging higher with gains lacking great volume conviction. Very extended from any sound base. Its 50 DMA line ($106.84) defines important near-term support to watch on pullbacks.
>>> FEATURED STOCK ARTICLE : Extended From Base After Wedging Higher - 1/14/2020 |
View all notes |
Set NEW NOTE alert |
Company Profile |
SEC
News |
Chart |
Request a new note
C
A
S
I |
SPSC
-
NASDAQ
S P S Commerce Inc
COMPUTER SOFTWARE and SERVICES - Application Software
|
$58.85
|
+0.35
0.59% |
$59.49
|
242,991
138.85% of 50 DAV
50 DAV is 175,000
|
$59.14
-0.50%
|
11/29/2019
|
$56.59
|
PP = $59.24
|
|
MB = $62.20
|
Most Recent Note - 1/22/2020 5:38:58 PM
Y - Posted a solid volume-driven gain today for its second-best ever close. Perched near its all-time high with no resistance remaining. Subsequent gains above its pivot point backed by at least +40% above average volume are needed to trigger a new technical buy signal. Fundamentals remain strong. Its Relative Strength Rating of 85 is above the 80+ minimum guideline for buy candidates.
>>> FEATURED STOCK ARTICLE : Still Lingering Below Prior Resistance - 1/13/2020 |
View all notes |
Set NEW NOTE alert |
Company Profile |
SEC
News |
Chart |
Request a new note
C
A
S
I |
AUDC
-
NASDAQ
Audiocodes Ltd
ELECTRONICS - Scientific and Technical Instrum
|
$28.12
|
-0.37
-1.30% |
$28.66
|
161,307
62.04% of 50 DAV
50 DAV is 260,000
|
$28.73
-2.12%
|
9/13/2019
|
$19.68
|
PP = $19.84
|
|
MB = $20.83
|
Most Recent Note - 1/22/2020 5:35:12 PM
G - Hit yet another new all-time high with below average volume behind today's gain. Very extended from the previously noted base. Its 50 DMA line ($24.69) defines support above with prior highs in the $22 area. Fundamentals remain strong.
>>> FEATURED STOCK ARTICLE : Large Loss With Higher Volume Indicates Distributional Pressure - 1/6/2020 |
View all notes |
Set NEW NOTE alert |
Company Profile |
SEC
News |
Chart |
Request a new note
C
A
S
I |
CHDN
-
NASDAQ
Churchill Downs Inc
LEISURE - Gaming Activities
|
$143.04
|
+0.81
0.57% |
$143.70
|
174,240
78.84% of 50 DAV
50 DAV is 221,000
|
$145.73
-1.85%
|
10/8/2019
|
$129.77
|
PP = $132.83
|
|
MB = $139.47
|
Most Recent Note - 1/21/2020 5:09:25 PM
G - Reversed into the red after hitting another new 52-week high today following 5 consecutive gains with light volume. Its 50 DMA line ($133) defines near-term support above the prior low ($132.55 on 1/03/19) The Jun and Sep '19 quarterly earnings versus the year ago periods were both below the +25% minimum guideline (C criteria) and raised fundamental concerns. See the latest FSU analysis for more details and a new annotated graph.
>>> FEATURED STOCK ARTICLE : Reversal From High Following 5 Gains With Light Volume - 1/21/2020 |
View all notes |
Set NEW NOTE alert |
Company Profile |
SEC
News |
Chart |
Request a new note
C
A
S
I |
LULU
-
NASDAQ
Lululemon Athletica
MANUFACTURING - Textile Manufacturing
|
$243.06
|
-1.24
-0.51% |
$244.28
|
857,401
43.09% of 50 DAV
50 DAV is 1,990,000
|
$247.51
-1.80%
|
9/6/2019
|
$201.25
|
PP = $194.35
|
|
MB = $204.07
|
 Most Recent Note - 1/23/2020 4:59:16 PM
G - Still stubbornly holding its ground perched near its all-time high with volume totals cooling. Extended from any sound base. Its 50 DMA line ($228) and prior low ($218.18 on 12/12/19) define important near-term support to watch. Fundamentals remain strong.
>>> FEATURED STOCK ARTICLE : Perched at All-Time High After Gains Lacking Great Volume - 1/9/2020 |
View all notes |
Set NEW NOTE alert |
Company Profile |
SEC
News |
Chart |
Request a new note
C
A
S
I |
Symbol/Exchange
Company Name
Industry Group |
PRICE |
CHANGE
(%Change) |
Day High |
Volume
(% DAV)
(% 50 day avg vol) |
52 Wk Hi
% From Hi |
Featured
Date |
Price
Featured |
Pivot Featured |
|
Max Buy |
CPRT
-
NASDAQ
Copart Inc
SPECIALTY RETAIL - Auto Dealerships
|
$99.90
|
+0.26
0.26% |
$99.99
|
804,141
42.98% of 50 DAV
50 DAV is 1,871,000
|
$100.35
-0.45%
|
1/2/2020
|
$92.80
|
PP = $92.51
|
|
MB = $97.14
|
Most Recent Note - 1/23/2020 4:58:23 PM
G - Perched at its all-time high and its color code is changed to green after wedging above its "max buy" level with gains marked by below average volume. Its 50 DMA line ($90.61) defines near-term support. Fundamentals remain strong.
>>> FEATURED STOCK ARTICLE : Perched at All-Time HIgh Following Recent Volume-Driven Gain - 1/7/2020 |
View all notes |
Set NEW NOTE alert |
Company Profile |
SEC
News |
Chart |
Request a new note
C
A
S
I |
NMIH
-
NASDAQ
N M I Holdings Inc Cl A
Finance-MrtgandRel Svc
|
$32.76
|
-0.53
-1.59% |
$33.26
|
526,492
100.86% of 50 DAV
50 DAV is 522,000
|
$35.79
-8.47%
|
11/8/2019
|
$32.89
|
PP = $31.44
|
|
MB = $33.01
|
Most Recent Note - 1/21/2020 4:24:09 PM
G - Endured distributional pressure today with a loss on higher volume after a quiet rebound above the 50 DMA line ($33.19). Prior highs in the $30-31 area define the next important near-term support. Fundamentals remain strong.
>>> FEATURED STOCK ARTICLE : Outlook Hurt by Slump Below 50-Day Moving Average - 1/10/2020 |
View all notes |
Set NEW NOTE alert |
Company Profile |
SEC
News |
Chart |
Request a new note
C
A
S
I |
SPLK
-
NASDAQ
Splunk Inc
Computer Sftwr-Database
|
$157.84
|
+1.31
0.84% |
$158.42
|
1,471,714
72.46% of 50 DAV
50 DAV is 2,031,000
|
$161.49
-2.26%
|
11/25/2019
|
$147.79
|
PP = $142.16
|
|
MB = $149.27
|
Most Recent Note - 1/22/2020 5:37:21 PM
G - Holding its ground stubbornly near its all-time high following recent gains backed by below average volume, extended from the previously noted base. Its 50 DMA line ($145) and prior highs in the $142-143 area define important support to watch on pullbacks.
>>> FEATURED STOCK ARTICLE : New High Hit With Another Gain on Near Average Volume - 1/8/2020 |
View all notes |
Set NEW NOTE alert |
Company Profile |
SEC
News |
Chart |
Request a new note
C
A
S
I |
PAYC
-
NYSE
Paycom Software Inc
COMPUTER SOFTWARE and SERVICES - Application Software
|
$314.85
|
+11.57
3.81% |
$324.00
|
3,199,951
631.15% of 50 DAV
50 DAV is 507,000
|
$306.37
2.77%
|
11/20/2019
|
$252.97
|
PP = $259.81
|
|
MB = $272.80
|
Most Recent Note - 1/23/2020 1:12:49 PM
G - Gapped up hitting a new all-time high, getting more extended from any sound base with above average volume behind today's 6th consecutive gain. Its prior high ($279.95 on 11/27/19) and its 50 DMA line ($267) define important near-term support levels to watch. Fundamentals remain strong.
>>> FEATURED STOCK ARTICLE : Gapped Up for New High But Ended Near Session Low - 1/23/2020 |
View all notes |
Set NEW NOTE alert |
Company Profile |
SEC
News |
Chart |
Request a new note
C
A
S
I |
BLD
-
NYSE
Topbuild Corp
Bldg-Constr Prds/Misc
|
$117.47
|
+3.29
2.88% |
$117.75
|
425,333
157.53% of 50 DAV
50 DAV is 270,000
|
$115.23
1.94%
|
12/9/2019
|
$109.71
|
PP = $113.84
|
|
MB = $119.53
|
Most Recent Note - 1/23/2020 4:56:41 PM
Y - Hit another new 52-week high and finished strong with today's 8th consecutive gain backed by volume slightly above average. Recent rebound above its 50 DMA line ($107.42) helped its outlook to improve.
>>> FEATURED STOCK ARTICLE : Fifth Consecutive Gain Leaves TopBuild Near 52-Week High - 1/17/2020 |
View all notes |
Set NEW NOTE alert |
Company Profile |
SEC
News |
Chart |
Request a new note
C
A
S
I |
Symbol/Exchange
Company Name
Industry Group |
PRICE |
CHANGE
(%Change) |
Day High |
Volume
(% DAV)
(% 50 day avg vol) |
52 Wk Hi
% From Hi |
Featured
Date |
Price
Featured |
Pivot Featured |
|
Max Buy |
GLOB
-
NYSE
Globant SA
Computer-Tech Services
|
$123.50
|
+2.90
2.40% |
$124.62
|
302,852
110.13% of 50 DAV
50 DAV is 275,000
|
$120.93
2.13%
|
11/14/2019
|
$106.87
|
PP = $112.43
|
|
MB = $118.05
|
Most Recent Note - 1/21/2020 4:26:58 PM
Y - Ended near the session low after a "negative reversal" following a streak of 5 quiet gains for new highs. Gains above the pivot point backed by at least +40% above average volume are needed to trigger a proper technical buy signal. Its 50 DMA line ($105.63) defines important near-term support to watch on pullbacks. Fundamentals remain strong.
>>> FEATURED STOCK ARTICLE : Gain for New High Today Backed by Only +12% Above Average Volume - 1/15/2020 |
View all notes |
Set NEW NOTE alert |
Company Profile |
SEC
News |
Chart |
Request a new note
C
A
S
I |
STNE
-
NASDAQ
Stoneco Ltd Cl A
Finance-CrdtCard/PmtPr
|
$45.03
|
+0.39
0.87% |
$45.27
|
1,545,453
78.69% of 50 DAV
50 DAV is 1,964,000
|
$45.62
-1.29%
|
1/22/2020
|
$43.94
|
PP = $45.72
|
|
MB = $48.01
|
Most Recent Note - 1/22/2020 5:33:49 PM
Y - Finished strong after highlighted in yellow with pivot point cited based on its 4/02/19 high plus 10 cents in the earlier mid-day report. Faces little remaining resistance due to overhead supply up to the $45 level. Subsequent gains above the pivot point backed by at least +40% above average volume may trigger a technical buy signal. This Brazilian company reported earnings +70% on +55% sales revenues for the Sep '19 quarter, and prior quarterly comparisons were strong. Completed a Secondary Offering on 4/03/18 and went through a deep consolidation Completed its $24 IPO on 10/25/18. See the latest FSU analysis for more details and a new annotated graph.
>>> FEATURED STOCK ARTICLE : Perched Near High With Best-Ever Close After Volume-Driven Gain - 1/22/2020 |
View all notes |
Set NEW NOTE alert |
Company Profile |
SEC
News |
Chart |
Request a new note
C
A
S
I |
|
|
|
THESE ARE NOT BUY RECOMMENDATIONS!
Comments contained in the body of this report are technical
opinions only. The material herein has been obtained
from sources believed to be reliable and accurate, however,
its accuracy and completeness cannot be guaranteed.
This site is not an investment advisor, hence it does
not endorse or recommend any securities or other investments.
Any recommendation contained in this report may not
be suitable for all investors and it is not to be deemed
an offer or solicitation on our part with respect to
the purchase or sale of any securities. All trademarks,
service marks and trade names appearing in this report
are the property of their respective owners, and are
likewise used for identification purposes only.
This report is a service available
only to active Paid Premium Members.
You may opt-out of receiving report notifications
at any time. Questions or comments may be submitted
by writing to Premium Membership Services 665 S.E. 10 Street, Suite 201 Deerfield Beach, FL 33441-5634 or by calling 1-800-965-8307
or 954-785-1121.
|
|
|