You are not logged in.
This means you
CAN ONLY VIEW reports that were published prior to Sunday, February 25, 2024.
You
MUST UPGRADE YOUR MEMBERSHIP if you want to see any current reports.
AFTER MARKET UPDATE - WEDNESDAY, JANUARY 23RD, 2019
Previous After Market Report Next After Market Report >>>
|
|
|
|
DOW |
+171.14 |
24,575.62 |
+0.70% |
|
Volume |
772,844,460 |
-21% |
|
Volume |
2,261,616,620 |
-5% |
|
NASDAQ |
+5.41 |
7,025.77 |
+0.08% |
|
Advancers |
1,440 |
49% |
|
Advancers |
1,510 |
50% |
|
S&P 500 |
+5.80 |
2,638.70 |
+0.22% |
|
Decliners |
1,499 |
51% |
|
Decliners |
1,539 |
50% |
|
Russell 2000 |
-3.20 |
1,454.26 |
-0.22% |
|
52 Wk Highs |
22 |
|
|
52 Wk Highs |
22 |
|
|
S&P 600 |
-1.78 |
907.18 |
-0.20% |
|
52 Wk Lows |
19 |
|
|
52 Wk Lows |
48 |
|
|
 |
Major Indices Rose With Less Volume Conviction
Kenneth J. Gruneisen - Passed the CAN SLIM® Master's Exam
Stocks finished higher Wednesday. The Dow added 171 points to 24,575 while the S&P 500 climbed 5 points to 2,638 The Nasdaq Composite gained 5 points to 7,025. The volume totals were lighter than the prior session on the NYSE and on the Nasdaq exchange. Breadth was even as decliners narrowly led advancers on the NYSE and on the Nasdaq exchange. There were 5 high-ranked companies from the Leaders List that made a new 52-week high and were listed on the BreakOuts Page, versus the total of 8 on the prior session. New 52-week highs outnumbered new 52-week lows on the NYSE, but new lows outnumbered new highs on the Nasdaq exchange versus the prior session. The major indices are in a confirmed uptrend after recently noted improvements helped to signal a change in market direction (M criteria) back to a bullish stance. The Featured Stocks Page provides the most timely analysis on high-ranked leaders. Charts used courtesy of www.stockcharts.com
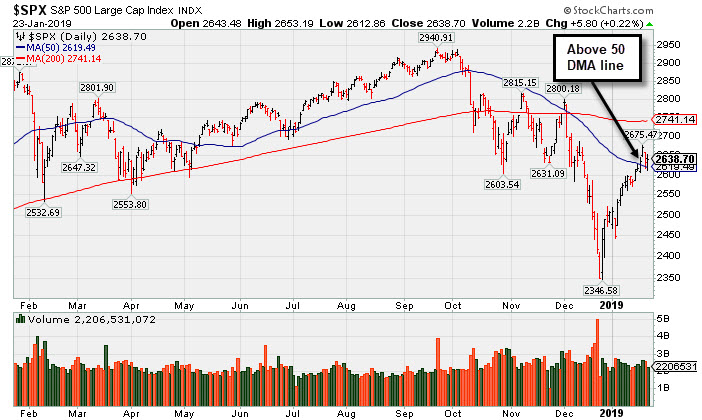
PICTURED: The S&P 500 Index ended -10.27% off its record high hit on 9/29/18. It recently rebounded above its 50-day moving average (DMA) line. Long-time readers may note from that the major averages cannot be considered to be in "healthy" shape while they are below their respective 200 DMA lines.
The major averages fluctuated throughout the session as generally positive corporate earnings overcame concerns surrounding trade relations and the ongoing partial government shutdown. On the data front, separate updates on the housing market showed mortgage applications dipped 2.7% in the prior week while U.S. home prices rose 0.4% in November. An additional survey showed manufacturing activity in the Richmond Fed district contracted in-line with expectations in January.
Nine of 11 S&P 500 sectors finished higher as Consumer Staples paced gains. Shares of Procter & Gamble (PG +4.87%) rose after beating Wall Street profit projections. In other earnings news, IBM (IBM +8.46%) and United Technologies (UTX +5.38%) rose after both companies topped earnings forecasts and raised full-year guidance. Abbot Laboratories (ABT -2.21%) fell after revealing revenue below forecasts as pharmaceutical sales declined in the fourth-quarter. Shares of Tesla (TSLA -3.79%) fell after the electric vehicle maker was the subject of an analyst downgrade.
Treasuries were little changed as the yield on the 10-year note climbed was flat at 2.75%. In commodities, WTI crude slipped 0.8% to $52.60/barrel. COMEX gold lost 0.1% to $1282.60/ounce despite a weaker dollar. |
 Kenneth J. Gruneisen started out as a licensed stockbroker in August 1987, a couple of months prior to the historic stock market crash that took the Dow Jones Industrial Average down -22.6% in a single day. He has published daily fact-based fundamental and technical analysis on high-ranked stocks online for two decades. Through FACTBASEDINVESTING.COM, Kenneth provides educational articles, news, market commentary, and other information regarding proven investment systems that work in good times and bad.
Comments contained in the body of this report are technical opinions only and are not necessarily those of Gruneisen Growth Corp. The material herein has been obtained from sources believed to be reliable and accurate, however, its accuracy and completeness cannot be guaranteed. Our firm, employees, and customers may effect transactions, including transactions contrary to any recommendation herein, or have positions in the securities mentioned herein or options with respect thereto. Any recommendation contained in this report may not be suitable for all investors and it is not to be deemed an offer or solicitation on our part with respect to the purchase or sale of any securities. |
|
 |
Networking, Retail, and Gold & Silver Indexes Rose
Kenneth J. Gruneisen - Passed the CAN SLIM® Master's Exam
The Retail Index ($RLX +0.31%) eked out a small gain on Wednesday as the Bank Index ($BKX -0.07%) finished flat and the Broker/Dealer Index ($XBD -0.65%) ended with a modest loss. The tech sector was mixed as the Semiconductor Index ($SOX -0.62%) and the Biotech Index ($BTK -0.57%) both fell, meanwhile, the Networking Index ($NWX +0.60%) posted a small gain. Energy-linked groups also had negative tilt as the Oil Services Index ($OSX -2.10%) and the Integrated Oil Index ($XOI -0.89%) both slumped, meanwhile, the Gold & Silver Index ($XAU +0.18%) edged higher.
Charts courtesy of www.stockcharts.com
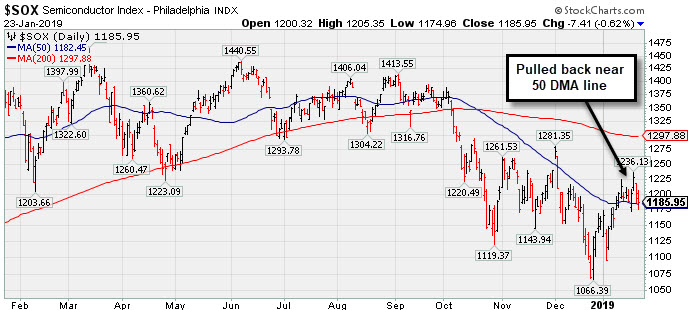 PICTURED: The Semiconductor Index ($SOX -0.62%) fell back to a close near its 50-day moving average (DMA) line.
| Oil Services |
$OSX |
92.85 |
-1.99 |
-2.10% |
+15.20% |
| Integrated Oil |
$XOI |
1,236.67 |
-11.05 |
-0.89% |
+6.69% |
| Semiconductor |
$SOX |
1,185.95 |
-7.41 |
-0.62% |
+2.66% |
| Networking |
$NWX |
520.96 |
+3.10 |
+0.60% |
+6.61% |
| Broker/Dealer |
$XBD |
256.77 |
-1.69 |
-0.65% |
+8.19% |
| Retail |
$RLX |
2,074.50 |
+6.50 |
+0.31% |
+6.31% |
| Gold & Silver |
$XAU |
68.86 |
+0.12 |
+0.17% |
-2.55% |
| Bank |
$BKX |
96.83 |
-0.07 |
-0.07% |
+12.87% |
| Biotech |
$BTK |
4,756.50 |
-27.23 |
-0.57% |
+12.69% |
|
|
|
 |
Healthcare Services Firm Reached a New High
Kenneth J. Gruneisen - Passed the CAN SLIM® Master's Exam
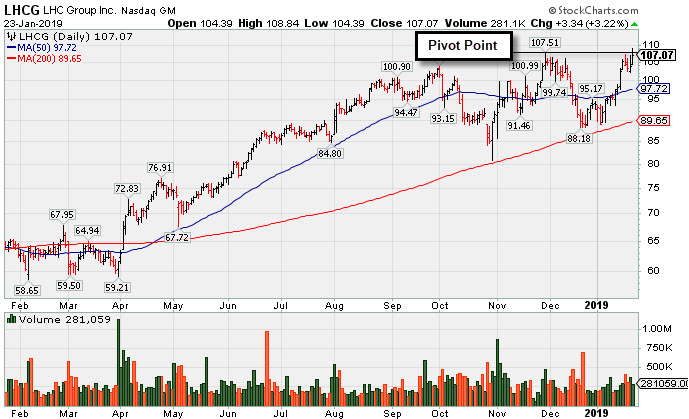
L H C Group Inc (LHCG +$3.34 or +3.22% to $107.07) was highlighted in yellow with pivot point cited based on its 11/29/18 high plus 10 cents. It hit a new high today after an 8-week cup shaped base. Subsequent gains above the pivot point backed by at least +40% above average volume may trigger a technical buy signal.
It found support above its 200 DMA line since noted in the 12/17/18 mid-day report - "The Sep '18 report marked its 3rd strong quarterly earnings increase above the +25% minimum guideline (C criteria), helping it better match with the fact-based investment system's fundamental guidelines." Its annual earnings growth (A criteria) has been strong, and it has a current Earnings Per Share Rating of 94.
The number of top-rated funds owning its shares rose from 350 in Mar '18 to 484 in Dec '18, a reassuring sign concerning the I criteria. It has earned an A Timeliness Rating and a C Sponsorship Rating. It has a small supply of only 31.4 million shares (S criteria) outstanding, which can contribute to greater volatility i the event of institutional buying or selling.
Charts courtesy of www.stockcharts.com
 |
|
|
Color Codes Explained :
Y - Better candidates highlighted by our
staff of experts.
G - Previously featured
in past reports as yellow but may no longer be buyable under the
guidelines.
***Last / Change / Volume data in this table is the closing quote data***
Symbol/Exchange
Company Name
Industry Group |
PRICE |
CHANGE
(%Change) |
Day High |
Volume
(% DAV)
(% 50 day avg vol) |
52 Wk Hi
% From Hi |
Featured
Date |
Price
Featured |
Pivot Featured |
|
Max Buy |
MLR
-
NYSE
Miller Industries Inc
AUTOMOTIVE - Auto Parts
|
$29.35
|
+0.06
0.20% |
$29.45
|
20,844
53.45% of 50 DAV
50 DAV is 39,000
|
$30.00
-2.17%
|
11/30/2018
|
$28.35
|
PP = $29.50
|
|
MB = $30.98
|
 Most Recent Note - 1/23/2019 5:18:49 PM
Y - Held its ground today near its high. Posted a gain on 1/18/19 backed by +39% above average volume. Subsequent gains above the pivot point backed by at least +40% above average volume may help clinch a proper technical buy signal. Its 50 DMA line and recent low define near-term support to watch on pullbacks.
>>> FEATURED STOCK ARTICLE : Perched Within Close Striking Distance of Prior High - 1/8/2019 |
View all notes |
Set NEW NOTE alert |
Company Profile |
SEC
News |
Chart |
Request a new note
C
A
S
I |
LHCG
-
NASDAQ
L H C Group Inc
HEALTH SERVICES - Home Health Care
|
$107.07
|
+3.34
3.22% |
$108.84
|
281,056
105.26% of 50 DAV
50 DAV is 267,000
|
$107.51
-0.41%
|
1/23/2019
|
$107.29
|
PP = $107.61
|
|
MB = $112.99
|
Most Recent Note - 1/23/2019 5:17:12 PM
Y - Posted a gain with near average volume today for a best-ever close. Highlighted in yellow with pivot point cited based on its 11/29/18 high plus 10 cents in the earlier mid-day report. Hit a new high today after an 8-week cup shaped base. Subsequent gains above the pivot point backed by at least +40% above average volume may trigger a technical buy signal. See the latest FSU analysis for more details and a new annotated graph. Found support above its 200 DMA line since noted in the 12/17/18 mid-day report - "The Sep '18 report marked its 3rd strong quarterly earnings increase above the +25% minimum guideline (C criteria), helping it better match with the fact-based investment system's fundamental guidelines."
>>> FEATURED STOCK ARTICLE : Healthcare Services Firm Reached a New High - 1/23/2019 |
View all notes |
Set NEW NOTE alert |
Company Profile |
SEC
News |
Chart |
Request a new note
C
A
S
I |
BSTC
-
NASDAQ
Biospecifics Technologie
Medical-Biomed/Biotech
|
$62.18
|
-1.66
-2.60% |
$65.21
|
59,749
145.73% of 50 DAV
50 DAV is 41,000
|
$68.00
-8.56%
|
1/18/2019
|
$67.40
|
PP = $66.31
|
|
MB = $69.63
|
Most Recent Note - 1/22/2019 6:12:27 PM
Y - Ended near the session low with a big loss today breaking a streak of 4 consecutive gains. Highlighted in yellow with pivot point cited based on its 11/07/18 high plus 10 cents in the 1/18/19 mid-day report. Thinly traded Biomed/Biotech firm's earnings increases have been above the +25% minimum guideline (C criteria) in the 4 latest quarterly comparisons through Sep '18. Sales revenues growth showed acceleration, but quarterly totals have been in the $7-8 million range, still rather minuscule in the context of all publicly traded companies. See the latest FSU analysis for more details and an annotated graph.
>>> FEATURED STOCK ARTICLE : Thinly Traded Biotech Shows Signs of Accumulation - 1/18/2019 |
View all notes |
Set NEW NOTE alert |
Company Profile |
SEC
News |
Chart |
Request a new note
C
A
S
I |
UBNT
-
NASDAQ
Ubiquiti Networks
TELECOMMUNICATIONS - Diversified Communication Serv
|
$106.37
|
+1.76
1.68% |
$106.99
|
212,234
50.29% of 50 DAV
50 DAV is 422,000
|
$115.44
-7.86%
|
11/9/2018
|
$108.20
|
PP = $101.43
|
|
MB = $106.50
|
Most Recent Note - 1/22/2019 6:09:58 PM
G - Faces some resistance due to overhead supply up to the $115 level. Quietly consolidating near its 50 DMA line ($104.75). Prior low ($92.08 on 12/24/18) defines the next important support. Fundamentals remain strong.
>>> FEATURED STOCK ARTICLE : Sputtering Below 50-Day Moving Average Again - 1/15/2019 |
View all notes |
Set NEW NOTE alert |
Company Profile |
SEC
News |
Chart |
Request a new note
C
A
S
I |
ALRM
-
NASDAQ
Alarm.com Holdings Inc
Security/Sfty
|
$60.17
|
+0.77
1.30% |
$60.87
|
555,538
105.42% of 50 DAV
50 DAV is 527,000
|
$61.64
-2.38%
|
1/22/2019
|
$60.52
|
PP = $60.30
|
|
MB = $63.32
|
Most Recent Note - 1/22/2019 12:11:38 PM
Y - Color code is changed to yellow with pivot point cited based on its 10/01/18 high plus 10 cents. During a choppy 16-week consolidation its 200 DMA line acted as support. Friday's gain above the pivot point backed by +124% above average volume triggered a technical buy signal. Reported Sep '18 quarterly earnings +33% on +24% sales revenues, its 11th consecutive comparison above the +25% minimum earnings guideline (C criteria). Annual earnings (A criteria) growth has been strong after a downturn in FY '15. Up considerably from its $14 IPO on 6/26/15.
>>> FEATURED STOCK ARTICLE : Pullback Broke Steak of Gains and Reversed From New High - 1/22/2019 |
View all notes |
Set NEW NOTE alert |
Company Profile |
SEC
News |
Chart |
Request a new note
C
A
S
I |
Symbol/Exchange
Company Name
Industry Group |
PRICE |
CHANGE
(%Change) |
Day High |
Volume
(% DAV)
(% 50 day avg vol) |
52 Wk Hi
% From Hi |
Featured
Date |
Price
Featured |
Pivot Featured |
|
Max Buy |
PLNT
-
NYSE
Planet Fitness Inc Cl A
Leisure-Services
|
$57.80
|
-0.39
-0.67% |
$58.86
|
991,031
74.57% of 50 DAV
50 DAV is 1,329,000
|
$59.52
-2.89%
|
11/7/2018
|
$57.10
|
PP = $55.45
|
|
MB = $58.22
|
Most Recent Note - 1/22/2019 6:07:59 PM
G - Ended near its "max buy" level today, recently holding its ground in a tight range near its all-time high. Its 50 DMA line ($54.57) defines important near-term support to watch above the recent low ($48).
>>> FEATURED STOCK ARTICLE : Found Prompt Support Near 50-Day Moving Average Line - 1/4/2019 |
View all notes |
Set NEW NOTE alert |
Company Profile |
SEC
News |
Chart |
Request a new note
C
A
S
I |
TEAM
-
NASDAQ
Atlassian Corp Plc Cl A
Comp Sftwr-Spec Enterprs
|
$93.65
|
+2.21
2.42% |
$94.40
|
2,215,665
132.20% of 50 DAV
50 DAV is 1,676,000
|
$100.00
-6.35%
|
1/7/2019
|
$94.68
|
PP = $98.31
|
|
MB = $103.23
|
Most Recent Note - 1/23/2019 11:39:46 AM
Y - There was a big "negative reversal" and weak close on 1/18/19 after hitting a new high, and heavy volume behind recent losses was action indicative of distributional pressure. Volume and volatility often increase near earnings news. Reported earnings +92% on +39% sales revenues for the Dec '18 quarter. Recently held its ground in a tight range, churning higher volume while perched within close striking distance of its prior high. Color code was changed to yellow with new pivot point cited based on its 10/01/18 high plus 10 cents. Subsequent gains and a strong close above the pivot point backed by at least +40% above average volume may help to clinch a convincing technical buy signal. Its 50 DMA line ($83.59) and prior low define near-term support to watch on pullbacks.
>>> FEATURED STOCK ARTICLE : Rebounding Near Prior High Which May Act as Resistance - 1/7/2019 |
View all notes |
Set NEW NOTE alert |
Company Profile |
SEC
News |
Chart |
Request a new note
C
A
S
I |
INVA
-
NASDAQ
Innoviva Inc
Medical-Biomed/Biotech
|
$19.69
|
+0.16
0.82% |
$19.77
|
514,512
46.44% of 50 DAV
50 DAV is 1,108,000
|
$19.96
-1.35%
|
11/23/2018
|
$17.74
|
PP = $18.09
|
|
MB = $18.99
|
Most Recent Note - 1/22/2019 6:06:05 PM
G - Touched a new high but reversed into the red for a loss with higher volume. The prior high ($18.60 on 12/03/18) defines initial support above its 50 DMA line ($17.50). See the latest FSU analysis for more details and an annotated graph.
>>> FEATURED STOCK ARTICLE : Perched at High Following Volume-Driven Gains - 1/17/2019 |
View all notes |
Set NEW NOTE alert |
Company Profile |
SEC
News |
Chart |
Request a new note
C
A
S
I |
|
|
|
THESE ARE NOT BUY RECOMMENDATIONS!
Comments contained in the body of this report are technical
opinions only. The material herein has been obtained
from sources believed to be reliable and accurate, however,
its accuracy and completeness cannot be guaranteed.
This site is not an investment advisor, hence it does
not endorse or recommend any securities or other investments.
Any recommendation contained in this report may not
be suitable for all investors and it is not to be deemed
an offer or solicitation on our part with respect to
the purchase or sale of any securities. All trademarks,
service marks and trade names appearing in this report
are the property of their respective owners, and are
likewise used for identification purposes only.
This report is a service available
only to active Paid Premium Members.
You may opt-out of receiving report notifications
at any time. Questions or comments may be submitted
by writing to Premium Membership Services 665 S.E. 10 Street, Suite 201 Deerfield Beach, FL 33441-5634 or by calling 1-800-965-8307
or 954-785-1121.
|
|
|

