You are not logged in.
This means you
CAN ONLY VIEW reports that were published prior to Saturday, February 24, 2024.
You
MUST UPGRADE YOUR MEMBERSHIP if you want to see any current reports.
AFTER MARKET UPDATE - TUESDAY, JANUARY 21ST, 2020
Previous After Market Report Next After Market Report >>>
|
|
|
|
DOW |
-152.06 |
29,196.04 |
-0.52% |
|
Volume |
1,045,974,330 |
+6% |
|
Volume |
2,665,317,150 |
+6% |
|
NASDAQ |
-18.13 |
9,370.81 |
-0.19% |
|
Advancers |
1,152 |
40% |
|
Advancers |
1,247 |
39% |
|
S&P 500 |
-8.83 |
3,320.79 |
-0.27% |
|
Decliners |
1,743 |
60% |
|
Decliners |
1,962 |
61% |
|
Russell 2000 |
-13.74 |
1,685.90 |
-0.81% |
|
52 Wk Highs |
259 |
|
|
52 Wk Highs |
234 |
|
|
S&P 600 |
-9.56 |
1,029.72 |
-0.92% |
|
52 Wk Lows |
27 |
|
|
52 Wk Lows |
42 |
|
|
 |
Major Indices Retreated From Record Highs
Kenneth J. Gruneisen - Passed the CAN SLIM® Master's Exam
The S&P 500 lost 0.3%, while the Dow dropped 152 points to snap a five-day winning streak. The Nasdaq Composite fell from a fresh record high reached earlier in the session, ending the day down 0.2%. Decliners led advancers by a 3-2 margin on the NYSE and on the Nasdaq exchange. The reported volume totals were higher than the prior session totals on the NYSE and on the Nasdaq exchange, indicative of distributional pressure. There were 85 high-ranked companies from the Leaders List that hit a new 52-week high and were listed on the BreakOuts Page, versus the total of 111 on the prior session. New 52-week highs totals contracted yet still easily outnumbered new 52-week lows totals on the NYSE and on the Nasdaq exchange. The major indices (M criteria) are in a "confirmed uptrend" after enduring distributional pressure in recent weeks. The Featured Stocks Page provides the most timely analysis on high-ranked leaders. Charts used courtesy of www.stockcharts.com
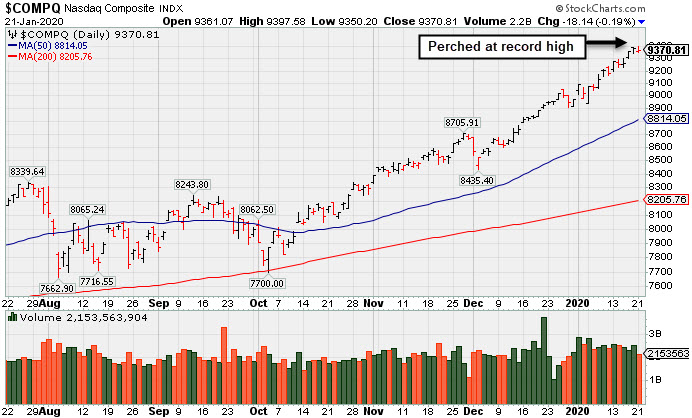
PICTURED: The Nasdaq Composite Index is perched near its record high
Stocks finished lower on Tuesday amid news of a respiratory virus outbreak in central China. Market participants assessed the threat of contagion as a single case was reportedly confirmed in the United States. This followed Friday’s session in which the S&P 500 capped a 2% weekly advance, its best since August. The benchmark index has risen 13 of the past 15 weeks.
Seven of 11 S&P 500 sectors closed in negative territory with Energy shares leading decliners. The traditionally defensive Real Estate, Utilities, and Consumer Staples groups outperformed. In earnings, UBS Group Ag Adr (UBS -4.79%) fell after the Swiss lender disappointed key profitability metrics and cut its financial targets across the board. Meanwhile, Halliburton (HAL -0.79%) fell despite posting positive quarterly results. In other corporate news, Boeing (BA -3.33%) fell after setting expectations that its 737-MAX aircraft would be unlikely to gain regulatory approval to return to service until June or July. Elsewhere, Amazon (AMZN +1.46%) rose on news the e-commerce giant filed trademarks for “Amazon Pharmacy” in several countries. Intel (INTC +1.59%) rose following an analyst upgrade.
Treasuries strengthened with the yield on the benchmark 10-year note down five basis points to 1.77%. In commodities, WTI crude dipped 0.3% to $58.34/barrel as market participants seemingly shrugged off Libyan supply disruptions. |
 Kenneth J. Gruneisen started out as a licensed stockbroker in August 1987, a couple of months prior to the historic stock market crash that took the Dow Jones Industrial Average down -22.6% in a single day. He has published daily fact-based fundamental and technical analysis on high-ranked stocks online for two decades. Through FACTBASEDINVESTING.COM, Kenneth provides educational articles, news, market commentary, and other information regarding proven investment systems that work in good times and bad.
Comments contained in the body of this report are technical opinions only and are not necessarily those of Gruneisen Growth Corp. The material herein has been obtained from sources believed to be reliable and accurate, however, its accuracy and completeness cannot be guaranteed. Our firm, employees, and customers may effect transactions, including transactions contrary to any recommendation herein, or have positions in the securities mentioned herein or options with respect thereto. Any recommendation contained in this report may not be suitable for all investors and it is not to be deemed an offer or solicitation on our part with respect to the purchase or sale of any securities. |
|
 |
Gold & Silver Index and Retail Index Rose
Kenneth J. Gruneisen - Passed the CAN SLIM® Master's Exam
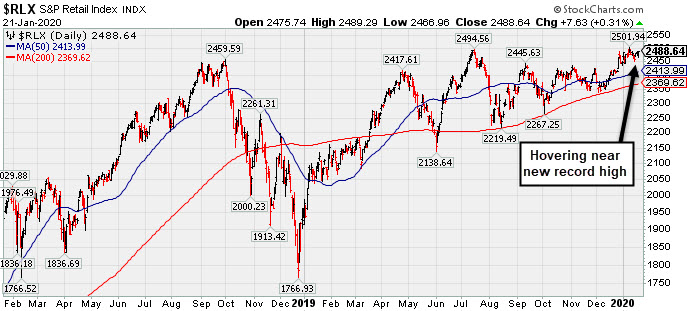
The Bank Index ($BKX -1.09%) lost ground while the Broker/Dealer Index ($XBD +0.05%) finished flat and the Retail Index ($RLX +0.31%) eked out a tiny gain. The tech sector had a negative bias as the Networking Index ($NWX -0.81%) and the Biotech Index ($BTK -1.19%) both fell while the Semiconductor Index ($SOX -0.08%) held its ground. Commodity-linked groups were mixed as the Oil Services Index ($OSX -2.99%) and Integrated Oil Index ($XOI -1.74%) both fell, meanwhile, the Gold & Silver Index ($XAU +1.43%) was a standout gainer.
PICTURED: The Retail Index ($RLX +0.31%) has been hovering near a new record high hit since the start of the year.
| Oil Services |
$OSX |
72.75 |
-2.24 |
-2.99% |
-7.08% |
| Integrated Oil |
$XOI |
1,231.92 |
-21.82 |
-1.74% |
-3.04% |
| Semiconductor |
$SOX |
1,915.00 |
-1.62 |
-0.08% |
+3.53% |
| Networking |
$NWX |
589.56 |
-4.79 |
-0.81% |
+1.05% |
| Broker/Dealer |
$XBD |
302.04 |
+0.16 |
+0.05% |
+4.02% |
| Retail |
$RLX |
2,488.64 |
+7.63 |
+0.31% |
+1.61% |
| Gold & Silver |
$XAU |
103.29 |
+1.45 |
+1.42% |
-3.40% |
| Bank |
$BKX |
109.71 |
-1.21 |
-1.09% |
-3.22% |
| Biotech |
$BTK |
5,114.81 |
-61.73 |
-1.19% |
+0.93% |
|
|
|
 |
Reversal From High Following 5 Gains With Light Volume
Kenneth J. Gruneisen - Passed the CAN SLIM® Master's Exam
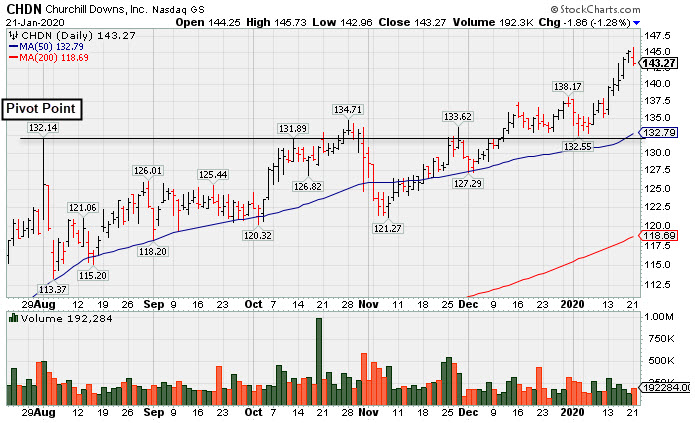
Churchill Downs Inc (CHDN -$1.86 or -1.28% to $143.27) reversed into the red after hitting yet another new 52-week high today following 5 consecutive gains. It is extended from the previously noted base. Its 50-day moving average (DMA) line ($133) defines near-term support nearly coinciding with the prior low ($132.55 on 1/03/19). The Jun and Sep '19 quarterly earnings versus the year ago periods were both below the +25% minimum guideline (C criteria) and raised fundamental concerns.
It has shown resilience following damaging volume-driven losses after it reported Sep '19 earnings +4% on +38% sales revenues versus the year ago period, its 2nd consecutive quarterly comparison below the +25% minimum earnings guideline (C criteria). Fundamental concerns have been noted, yet it still has an Earnings Per Share Rating of 87. Annual earnings (A criteria) growth has been strong since a downturn in FY '14.
The L criteria of the fact-based investment system guides investors toward buying leading stocks that are in leading industry groups. The Leisure - Gaming/Equipment industry group has a Group Relative Strength Rating of A.
The number of top-rated funds owning its shares rose from 333 in Jun '17 to 480 in Dec '19, a reassuring sign concerning the I criteria. Its current Up/Down Volume Ratio of 1.4 is an unbiased indication its shares have been under accumulation over the past 50 days. It has a small supply of 39.8 million shares (S criteria) outstanding following a 3:1 split effective 1/28/19, and this small supply can contribute to greater price volatility in the event of institutional buying or selling.
|
|
|
Color Codes Explained :
Y - Better candidates highlighted by our
staff of experts.
G - Previously featured
in past reports as yellow but may no longer be buyable under the
guidelines.
***Last / Change / Volume data in this table is the closing quote data***
Symbol/Exchange
Company Name
Industry Group |
PRICE |
CHANGE
(%Change) |
Day High |
Volume
(% DAV)
(% 50 day avg vol) |
52 Wk Hi
% From Hi |
Featured
Date |
Price
Featured |
Pivot Featured |
|
Max Buy |
 CCBG
-
NASDAQ
CCBG
-
NASDAQ
Capital City Bk Gp
BANKING - Regional - Mid-Atlantic Banks
|
$28.90
|
-0.14
-0.48% |
$29.07
|
29,034
65.99% of 50 DAV
50 DAV is 44,000
|
$30.95
-6.62%
|
12/16/2019
|
$30.07
|
PP = $30.95
|
|
MB = $32.50
|
 Most Recent Note - 1/21/2020 4:18:56 PM
Still sputtering below its 50 DMA line ($29.52) and its Relative Strength Rating has slumped to 73, below the 80+ minimum guideline for buy candidates. Prior low ($28.16 on 12/03/19) defines the next important support level. A rebound above the 50 DMA line is needed for its outlook to improve. It will be dropped from the Featured Stocks list tonight.
>>> FEATURED STOCK ARTICLE : Perched Near 52-Week High After Forming an Orderly Base - 1/2/2020 |
View all notes |
Set NEW NOTE alert |
Company Profile |
SEC
News |
Chart |
Request a new note
C
A
S
I |
FTNT
-
NASDAQ
Fortinet Inc
Computer Sftwr-Security
|
$117.64
|
+0.15
0.13% |
$118.31
|
849,717
70.22% of 50 DAV
50 DAV is 1,210,000
|
$119.50
-1.56%
|
12/9/2019
|
$103.85
|
PP = $106.10
|
|
MB = $111.41
|
Most Recent Note - 1/21/2020 4:21:43 PM
G - Holding its ground stubbornly after wedging higher with gains lacking great volume conviction. Very extended from any sound base. Its 50 DMA line ($106.84) defines important near-term support to watch on pullbacks.
>>> FEATURED STOCK ARTICLE : Extended From Base After Wedging Higher - 1/14/2020 |
View all notes |
Set NEW NOTE alert |
Company Profile |
SEC
News |
Chart |
Request a new note
C
A
S
I |
SPSC
-
NASDAQ
S P S Commerce Inc
COMPUTER SOFTWARE and SERVICES - Application Software
|
$57.04
|
+0.04
0.07% |
$57.58
|
174,260
100.15% of 50 DAV
50 DAV is 174,000
|
$59.14
-3.55%
|
11/29/2019
|
$56.59
|
PP = $59.24
|
|
MB = $62.20
|
Most Recent Note - 1/17/2020 6:19:56 PM
Y - Pulled back today when perched near its all-time high with very little resistance remaining. Subsequent gains above its pivot point backed by at least +40% above average volume are needed to trigger a new technical buy signal. Fundamentals remain strong. Its Relative Strength Rating of 82 is above the 80+ minimum guideline for buy candidates.
>>> FEATURED STOCK ARTICLE : Still Lingering Below Prior Resistance - 1/13/2020 |
View all notes |
Set NEW NOTE alert |
Company Profile |
SEC
News |
Chart |
Request a new note
C
A
S
I |
AUDC
-
NASDAQ
Audiocodes Ltd
ELECTRONICS - Scientific and Technical Instrum
|
$28.12
|
+0.66
2.40% |
$28.56
|
242,971
93.09% of 50 DAV
50 DAV is 261,000
|
$28.58
-1.61%
|
9/13/2019
|
$19.68
|
PP = $19.84
|
|
MB = $20.83
|
Most Recent Note - 1/16/2020 6:16:20 PM
G - Hit another new all-time high with average volume behind today's big gain. Very extended from the previously noted base. Its 50 DMA line ($24.31) defines support above with prior highs in the $22 area. Fundamentals remain strong.
>>> FEATURED STOCK ARTICLE : Large Loss With Higher Volume Indicates Distributional Pressure - 1/6/2020 |
View all notes |
Set NEW NOTE alert |
Company Profile |
SEC
News |
Chart |
Request a new note
C
A
S
I |
CHDN
-
NASDAQ
Churchill Downs Inc
LEISURE - Gaming Activities
|
$143.27
|
-1.86
-1.28% |
$145.73
|
192,284
83.60% of 50 DAV
50 DAV is 230,000
|
$145.30
-1.40%
|
10/8/2019
|
$129.77
|
PP = $132.83
|
|
MB = $139.47
|
Most Recent Note - 1/21/2020 5:09:25 PM
G - Reversed into the red after hitting another new 52-week high today following 5 consecutive gains with light volume. Its 50 DMA line ($133) defines near-term support above the prior low ($132.55 on 1/03/19) The Jun and Sep '19 quarterly earnings versus the year ago periods were both below the +25% minimum guideline (C criteria) and raised fundamental concerns. See the latest FSU analysis for more details and a new annotated graph.
>>> FEATURED STOCK ARTICLE : Reversal From High Following 5 Gains With Light Volume - 1/21/2020 |
View all notes |
Set NEW NOTE alert |
Company Profile |
SEC
News |
Chart |
Request a new note
C
A
S
I |
Symbol/Exchange
Company Name
Industry Group |
PRICE |
CHANGE
(%Change) |
Day High |
Volume
(% DAV)
(% 50 day avg vol) |
52 Wk Hi
% From Hi |
Featured
Date |
Price
Featured |
Pivot Featured |
|
Max Buy |
LULU
-
NASDAQ
Lululemon Athletica
MANUFACTURING - Textile Manufacturing
|
$242.52
|
+1.27
0.53% |
$243.48
|
1,591,180
78.81% of 50 DAV
50 DAV is 2,019,000
|
$247.51
-2.02%
|
9/6/2019
|
$201.25
|
PP = $194.35
|
|
MB = $204.07
|
Most Recent Note - 1/17/2020 6:15:39 PM
G - Stubbornly holding its ground perched near its all-time high with volume totals cooling. Extended from any sound base. Its 50 DMA line ($226) and prior low ($218.18 on 12/12/19) define important near-term support to watch. Fundamentals remain strong.
>>> FEATURED STOCK ARTICLE : Perched at All-Time High After Gains Lacking Great Volume - 1/9/2020 |
View all notes |
Set NEW NOTE alert |
Company Profile |
SEC
News |
Chart |
Request a new note
C
A
S
I |
CPRT
-
NASDAQ
Copart Inc
SPECIALTY RETAIL - Auto Dealerships
|
$98.60
|
+1.48
1.52% |
$99.04
|
1,462,526
78.34% of 50 DAV
50 DAV is 1,867,000
|
$97.36
1.27%
|
1/2/2020
|
$92.80
|
PP = $92.51
|
|
MB = $97.14
|
Most Recent Note - 1/17/2020 12:12:54 PM
Y - Perched at its all-time high and near its "max buy" level after 7 consecutive gains marked by below average volume. Its 50 DMA line ($89.53) defines near-term support. Fundamentals remain strong.
>>> FEATURED STOCK ARTICLE : Perched at All-Time HIgh Following Recent Volume-Driven Gain - 1/7/2020 |
View all notes |
Set NEW NOTE alert |
Company Profile |
SEC
News |
Chart |
Request a new note
C
A
S
I |
NMIH
-
NASDAQ
N M I Holdings Inc Cl A
Finance-MrtgandRel Svc
|
$33.06
|
-0.47
-1.40% |
$33.70
|
681,303
127.35% of 50 DAV
50 DAV is 535,000
|
$35.79
-7.63%
|
11/8/2019
|
$32.89
|
PP = $31.44
|
|
MB = $33.01
|
Most Recent Note - 1/21/2020 4:24:09 PM
G - Endured distributional pressure today with a loss on higher volume after a quiet rebound above the 50 DMA line ($33.19). Prior highs in the $30-31 area define the next important near-term support. Fundamentals remain strong.
>>> FEATURED STOCK ARTICLE : Outlook Hurt by Slump Below 50-Day Moving Average - 1/10/2020 |
View all notes |
Set NEW NOTE alert |
Company Profile |
SEC
News |
Chart |
Request a new note
C
A
S
I |
SPLK
-
NASDAQ
Splunk Inc
Computer Sftwr-Database
|
$157.10
|
-0.86
-0.54% |
$159.25
|
1,044,832
51.49% of 50 DAV
50 DAV is 2,029,000
|
$161.49
-2.72%
|
11/25/2019
|
$147.79
|
PP = $142.16
|
|
MB = $149.27
|
Most Recent Note - 1/16/2020 6:20:22 PM
G - Hit yet another new high with today's gain backed by below average volume, getting more extended from the previously noted base. Prior highs in the $142-143 area define important support to watch coinciding with its 50 DMA line ($143).
>>> FEATURED STOCK ARTICLE : New High Hit With Another Gain on Near Average Volume - 1/8/2020 |
View all notes |
Set NEW NOTE alert |
Company Profile |
SEC
News |
Chart |
Request a new note
C
A
S
I |
PAYC
-
NYSE
Paycom Software Inc
COMPUTER SOFTWARE and SERVICES - Application Software
|
$299.78
|
+3.54
1.19% |
$301.21
|
462,146
91.70% of 50 DAV
50 DAV is 504,000
|
$297.53
0.76%
|
11/20/2019
|
$252.97
|
PP = $259.81
|
|
MB = $272.80
|
Most Recent Note - 1/17/2020 6:17:40 PM
G - Managed a best-ever close with today's 3rd consecutive gain backed by light volume. Very extended from any sound base. Its 50 DMA line ($262) defines important near-term support to watch. Fundamentals remain strong.
>>> FEATURED STOCK ARTICLE : Perched Near High and Near the Max Buy Level - 1/3/2020 |
View all notes |
Set NEW NOTE alert |
Company Profile |
SEC
News |
Chart |
Request a new note
C
A
S
I |
Symbol/Exchange
Company Name
Industry Group |
PRICE |
CHANGE
(%Change) |
Day High |
Volume
(% DAV)
(% 50 day avg vol) |
52 Wk Hi
% From Hi |
Featured
Date |
Price
Featured |
Pivot Featured |
|
Max Buy |
BLD
-
NYSE
Topbuild Corp
Bldg-Constr Prds/Misc
|
$113.91
|
+2.31
2.07% |
$113.98
|
385,593
142.81% of 50 DAV
50 DAV is 270,000
|
$113.74
0.15%
|
12/9/2019
|
$109.71
|
PP = $113.84
|
|
MB = $119.53
|
Most Recent Note - 1/17/2020 6:12:54 PM
Y - Challenged its 52-week high with today's 5th consecutive gain. Recent rebound above its 50 DMA line ($106.92) helped its outlook to improve. See the latest FSU analysis for more details and a new annotated graph.
>>> FEATURED STOCK ARTICLE : Fifth Consecutive Gain Leaves TopBuild Near 52-Week High - 1/17/2020 |
View all notes |
Set NEW NOTE alert |
Company Profile |
SEC
News |
Chart |
Request a new note
C
A
S
I |
GLOB
-
NYSE
Globant SA
Computer-Tech Services
|
$116.74
|
-2.93
-2.45% |
$120.64
|
294,211
108.56% of 50 DAV
50 DAV is 271,000
|
$119.83
-2.58%
|
11/14/2019
|
$106.87
|
PP = $112.43
|
|
MB = $118.05
|
Most Recent Note - 1/21/2020 4:26:58 PM
Y - Ended near the session low after a "negative reversal" following a streak of 5 quiet gains for new highs. Gains above the pivot point backed by at least +40% above average volume are needed to trigger a proper technical buy signal. Its 50 DMA line ($105.63) defines important near-term support to watch on pullbacks. Fundamentals remain strong.
>>> FEATURED STOCK ARTICLE : Gain for New High Today Backed by Only +12% Above Average Volume - 1/15/2020 |
View all notes |
Set NEW NOTE alert |
Company Profile |
SEC
News |
Chart |
Request a new note
C
A
S
I |
|
|
|
THESE ARE NOT BUY RECOMMENDATIONS!
Comments contained in the body of this report are technical
opinions only. The material herein has been obtained
from sources believed to be reliable and accurate, however,
its accuracy and completeness cannot be guaranteed.
This site is not an investment advisor, hence it does
not endorse or recommend any securities or other investments.
Any recommendation contained in this report may not
be suitable for all investors and it is not to be deemed
an offer or solicitation on our part with respect to
the purchase or sale of any securities. All trademarks,
service marks and trade names appearing in this report
are the property of their respective owners, and are
likewise used for identification purposes only.
This report is a service available
only to active Paid Premium Members.
You may opt-out of receiving report notifications
at any time. Questions or comments may be submitted
by writing to Premium Membership Services 665 S.E. 10 Street, Suite 201 Deerfield Beach, FL 33441-5634 or by calling 1-800-965-8307
or 954-785-1121.
|
|
|