You are not logged in.
This means you
CAN ONLY VIEW reports that were published prior to Tuesday, February 20, 2024.
You
MUST UPGRADE YOUR MEMBERSHIP if you want to see any current reports.
AFTER MARKET UPDATE - THURSDAY, JANUARY 17TH, 2019
Previous After Market Report Next After Market Report >>>
|
|
|
|
DOW |
+162.94 |
24,370.10 |
+0.67% |
|
Volume |
914,044,460 |
+6% |
|
Volume |
2,120,819,812 |
-2% |
|
NASDAQ |
+49.77 |
7,084.46 |
+0.71% |
|
Advancers |
2,105 |
71% |
|
Advancers |
1,927 |
63% |
|
S&P 500 |
+19.86 |
2,635.96 |
+0.76% |
|
Decliners |
863 |
29% |
|
Decliners |
1,145 |
37% |
|
Russell 2000 |
+12.55 |
1,467.25 |
+0.86% |
|
52 Wk Highs |
19 |
|
|
52 Wk Highs |
29 |
|
|
S&P 600 |
+8.29 |
915.13 |
+0.91% |
|
52 Wk Lows |
11 |
|
|
52 Wk Lows |
26 |
|
|
 |
Breadth Positive as S&P 500 Index Rose Above 50-Day Moving Average
Kenneth J. Gruneisen - Passed the CAN SLIM® Master's Exam
Stocks finished higher Thursday. The Dow gained 162 points to 24,370 while the S&P 500 climbed 19 points to 2,635. The Nasdaq Composite added 49 points to 7,084. The volume totals were mixed, higher than the prior session on the NYSE and lighter on the Nasdaq exchange. Breadth was positive as advancers led decliners by more than a 2-1 margin on the NYSE and nearly 2-1 on the Nasdaq exchange. There were 7 high-ranked companies from the Leaders List that made a new 52-week high and were listed on the BreakOuts Page, versus the total of 1 on the prior session. New 52-week highs outnumbered new 52-week lows on the NYSE and on the Nasdaq exchange versus the prior session. The major indices are in a confirmed uptrend after recently noted improvements helped to signal a change in market direction (M criteria) back to a bullish stance. The Featured Stocks Page provides the most timely analysis on high-ranked leaders. Charts used courtesy of www.stockcharts.com
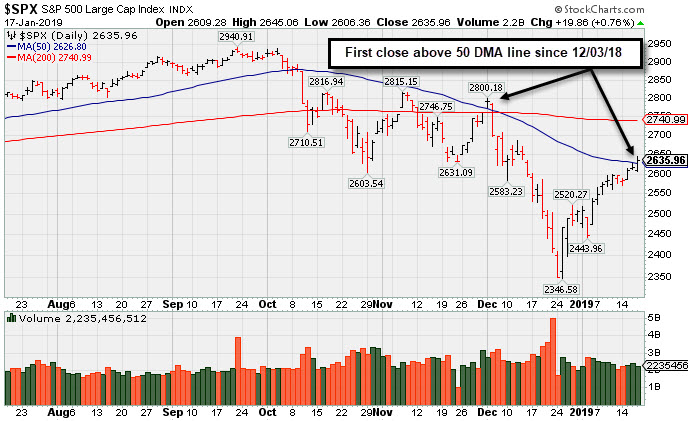
PICTURED: The S&P 500 Index closed above its 50-day moving average (DMA) line for the first time since 12/03/18.
The major averages advanced amid a report that Trump administration officials favored easing tariffs on Chinese goods. Gains were capped, however, after the Treasury Department denied the reports. Investors welcomed the conflicting, but optimistic headlines following earlier news that U.S. prosecutors are investigating Chinese company Huawei Technologies. On the data front, a report showed business activity in the Philadelphia Fed region expanded at a faster-than-projected pace in January. In a separate release, initial jobless claims inched down to 213,000 in the most recent week after coming in at 216,000 the prior period.
All 11 S&P 500 sectors ended in positive territory. Materials paced gains with Alcoa (AA +2.10%) rose despite the aluminum maker hinting that supply may outpace demand in 2019. Industrials also outperformed with Fastenal (FAST +5.95%) rose after revealing earnings and revenue was in-line with Wall Street expectations. Morgan Stanley (MS -4.41%) was a notable decliner after reporting that its trading and wealth management businesses were negatively influenced by the fourth-quarter market volatility.
Treasuries were mixed with the yield of the 10-year note up one basis point to 2.74%. In commodities, WTI crude fell 0.1% to $52.26/barrel. COMEX gold lost 0.2% to $1291.20/ounce amid a stronger dollar. |
 Kenneth J. Gruneisen started out as a licensed stockbroker in August 1987, a couple of months prior to the historic stock market crash that took the Dow Jones Industrial Average down -22.6% in a single day. He has published daily fact-based fundamental and technical analysis on high-ranked stocks online for two decades. Through FACTBASEDINVESTING.COM, Kenneth provides educational articles, news, market commentary, and other information regarding proven investment systems that work in good times and bad.
Comments contained in the body of this report are technical opinions only and are not necessarily those of Gruneisen Growth Corp. The material herein has been obtained from sources believed to be reliable and accurate, however, its accuracy and completeness cannot be guaranteed. Our firm, employees, and customers may effect transactions, including transactions contrary to any recommendation herein, or have positions in the securities mentioned herein or options with respect thereto. Any recommendation contained in this report may not be suitable for all investors and it is not to be deemed an offer or solicitation on our part with respect to the purchase or sale of any securities. |
|
 |
Financial, Energy, and Tech Groups Rose
Kenneth J. Gruneisen - Passed the CAN SLIM® Master's Exam
Financial stocks were a positive influence on the major indices again on Thursday as the Bank Index ($BKX +1.02%) outpaced the Broker/Dealer Index ($XBD +0.23%). The tech sector had a positive bias as the Biotech Index ($BTK +1.02%) and the Semiconductor Index ($SOX +1.14%) both outpaced the Networking Index ($NWX +0.19%). Energy-linked groups also had a positive tilt as the Oil Services Index ($OSX +1.11%) and the Integrated Oil Index ($XOI +0.95%) both rose, meanwhile, the Gold & Silver Index ($XAU -0.01%) finished flat.
Charts courtesy of www.stockcharts.com
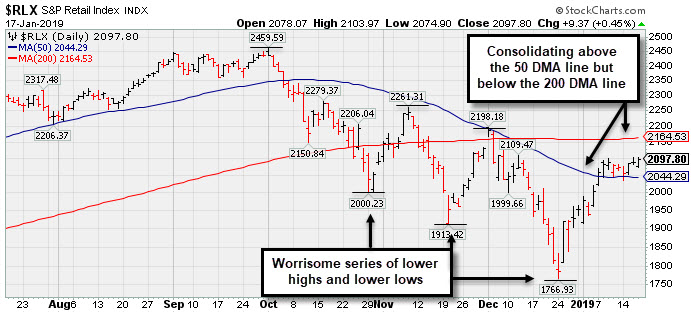 PICTURED: The Retail Index ($RLX +0.45%) has rebounded above its 50-day moving average (DMA) line, but remains below its 200 DMA line. It has formed a worrisome series of lower highs and lower lows.
| Oil Services |
$OSX |
94.95 |
+1.04 |
+1.11% |
+17.80% |
| Integrated Oil |
$XOI |
1,258.50 |
+11.88 |
+0.95% |
+8.58% |
| Semiconductor |
$SOX |
1,200.76 |
+13.57 |
+1.14% |
+3.95% |
| Networking |
$NWX |
516.39 |
+1.00 |
+0.19% |
+5.67% |
| Broker/Dealer |
$XBD |
259.61 |
+0.60 |
+0.23% |
+9.38% |
| Retail |
$RLX |
2,097.80 |
+9.37 |
+0.45% |
+7.50% |
| Gold & Silver |
$XAU |
69.53 |
-0.01 |
-0.01% |
-1.60% |
| Bank |
$BKX |
95.86 |
+0.97 |
+1.02% |
+11.74% |
| Biotech |
$BTK |
4,844.60 |
+48.76 |
+1.02% |
+14.78% |
|
|
|
 |
Perched at High Following Volume-Driven Gains
Kenneth J. Gruneisen - Passed the CAN SLIM® Master's Exam
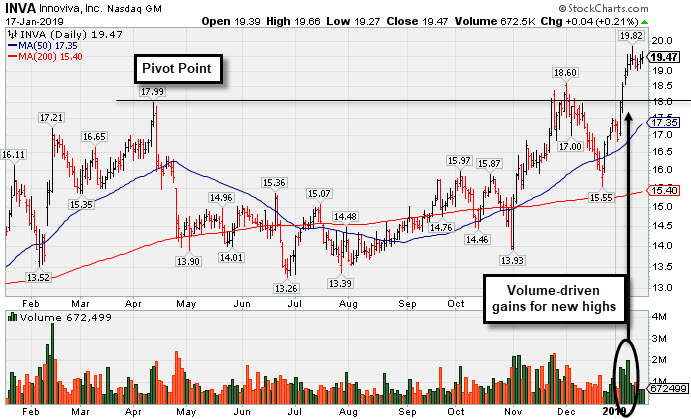
Innoviva Inc (INVA +$0.04 or +0.21% to $19.47) is stubbornly holding its ground with volume totals cooling while remaining perched near its 52-week high after a streak of gains. The 50-day moving average (DMA) line ($17.35) and prior low ($15.55 on 12/24/18) define near-term support.
Last week's gains above the pivot point were backed above average volume helping trigger a convincing technical buy signal. It was highlighted in yellow with pivot point cited based on its 4/12/18 high plus 10 cents in the 11/23/18 mid-day report (read here) and last shown in this FSU section on 1/03/19 with an annotated graph under the headline, "Consolidating Above 50-Day Average Line Near High".
Earnings increases in quarterly comparisons through Sep '18 have been above the +25% minimum guideline (C criteria). Annual earnings (A criteria) growth has been good after turning a profitable FY '15. It has earned a 94 Earnings Per Share Rating, well above the 80+ minimum for buy candidates.
The number of top-rated funds owning its shares rose from 351 in Dec '17 to 390 in Sep '18, a reassuring sign concerning the I criteria. The current Up/Down Volume Ratio of 1.4 is an unbiased indication its shares have been under accumulation over the past 50 days. There are only 66.7 million shares in the public float (S criteria). It has earned an A Timeliness Rating and C Sponsorship Rating.
Charts courtesy of www.stockcharts.com
 |
|
|
Color Codes Explained :
Y - Better candidates highlighted by our
staff of experts.
G - Previously featured
in past reports as yellow but may no longer be buyable under the
guidelines.
***Last / Change / Volume data in this table is the closing quote data***
Symbol/Exchange
Company Name
Industry Group |
PRICE |
CHANGE
(%Change) |
Day High |
Volume
(% DAV)
(% 50 day avg vol) |
52 Wk Hi
% From Hi |
Featured
Date |
Price
Featured |
Pivot Featured |
|
Max Buy |
MLR
-
NYSE
Miller Industries Inc
AUTOMOTIVE - Auto Parts
|
$28.47
|
-0.16
-0.56% |
$28.87
|
21,556
56.73% of 50 DAV
50 DAV is 38,000
|
$29.40
-3.16%
|
11/30/2018
|
$28.35
|
PP = $29.50
|
|
MB = $30.98
|
 Most Recent Note - 1/17/2019 5:02:39 PM
Y - Volume totals have been cooling in recent weeks while remaining perched within close striking distance of prior highs. Very little resistance remains due to overhead supply up to the $29 level. Its 50 DMA line and recent low define near-term support to watch on pullbacks.
>>> FEATURED STOCK ARTICLE : Perched Within Close Striking Distance of Prior High - 1/8/2019 |
View all notes |
Set NEW NOTE alert |
Company Profile |
SEC
News |
Chart |
Request a new note
C
A
S
I |
UBNT
-
NASDAQ
Ubiquiti Networks
TELECOMMUNICATIONS - Diversified Communication Serv
|
$103.80
|
+2.01
1.97% |
$104.67
|
323,725
75.64% of 50 DAV
50 DAV is 428,000
|
$115.44
-10.08%
|
11/9/2018
|
$108.20
|
PP = $101.43
|
|
MB = $106.50
|
Most Recent Note - 1/17/2019 5:07:42 PM
G - Posted a gain today with below average volume. A convincing rebound above its 50 DMA line ($104.18) is needed for its outlook to improve. Prior low ($92.08 on 12/24/18) defines the next important support. Fundamentals remain strong. See the latest FSU analysis for more details and an annotated graph.
>>> FEATURED STOCK ARTICLE : Sputtering Below 50-Day Moving Average Again - 1/15/2019 |
View all notes |
Set NEW NOTE alert |
Company Profile |
SEC
News |
Chart |
Request a new note
C
A
S
I |
PLNT
-
NYSE
Planet Fitness Inc Cl A
Leisure-Services
|
$58.49
|
+0.59
1.02% |
$58.99
|
898,511
67.86% of 50 DAV
50 DAV is 1,324,000
|
$59.23
-1.25%
|
11/7/2018
|
$57.10
|
PP = $55.45
|
|
MB = $58.22
|
Most Recent Note - 1/17/2019 5:03:49 PM
G - Posted a quiet gain back above its "max buy" level today and its color code is changed to green. Its 50 DMA line ($54.13) defines important near-term support to watch above the recent low ($48).
>>> FEATURED STOCK ARTICLE : Found Prompt Support Near 50-Day Moving Average Line - 1/4/2019 |
View all notes |
Set NEW NOTE alert |
Company Profile |
SEC
News |
Chart |
Request a new note
C
A
S
I |
TEAM
-
NASDAQ
Atlassian Corp Plc Cl A
Comp Sftwr-Spec Enterprs
|
$92.92
|
-1.40
-1.48% |
$94.75
|
3,218,021
220.41% of 50 DAV
50 DAV is 1,460,000
|
$98.21
-5.39%
|
1/7/2019
|
$94.68
|
PP = $98.31
|
|
MB = $103.23
|
Most Recent Note - 1/17/2019 5:06:00 PM
Y - Volume and volatility often increase near earnings news. Reported earnings +92% on +39% sales revenues for the Dec '18 quarter after the close today. It has been holding its ground in a tight range, churning higher volume while perched within close striking distance of its prior high. Color code was changed to yellow with new pivot point cited based on its 10/01/18 high plus 10 cents. Subsequent gains above the pivot point backed by at least +40% above average volume may trigger a technical buy signal. Its 50 DMA line ($82.58) and prior low define near-term support to watch on pullbacks.
>>> FEATURED STOCK ARTICLE : Rebounding Near Prior High Which May Act as Resistance - 1/7/2019 |
View all notes |
Set NEW NOTE alert |
Company Profile |
SEC
News |
Chart |
Request a new note
C
A
S
I |
INVA
-
NASDAQ
Innoviva Inc
Medical-Biomed/Biotech
|
$19.47
|
+0.04
0.21% |
$19.66
|
672,667
58.19% of 50 DAV
50 DAV is 1,156,000
|
$19.82
-1.77%
|
11/23/2018
|
$17.74
|
PP = $18.09
|
|
MB = $18.99
|
Most Recent Note - 1/17/2019 5:01:36 PM
G - Stubbornly holding its ground with volume totals cooling while remaining perched near its 52-week high after a streak of gains . The 50 DMA line ($17.35) and prior low ($15.55 on 12/24/18) define near-term support. See the latest FSU analysis for more details and a new annotated graph.
>>> FEATURED STOCK ARTICLE : Perched at High Following Volume-Driven Gains - 1/17/2019 |
View all notes |
Set NEW NOTE alert |
Company Profile |
SEC
News |
Chart |
Request a new note
C
A
S
I |
Symbol/Exchange
Company Name
Industry Group |
PRICE |
CHANGE
(%Change) |
Day High |
Volume
(% DAV)
(% 50 day avg vol) |
52 Wk Hi
% From Hi |
Featured
Date |
Price
Featured |
Pivot Featured |
|
Max Buy |
|
|
|
THESE ARE NOT BUY RECOMMENDATIONS!
Comments contained in the body of this report are technical
opinions only. The material herein has been obtained
from sources believed to be reliable and accurate, however,
its accuracy and completeness cannot be guaranteed.
This site is not an investment advisor, hence it does
not endorse or recommend any securities or other investments.
Any recommendation contained in this report may not
be suitable for all investors and it is not to be deemed
an offer or solicitation on our part with respect to
the purchase or sale of any securities. All trademarks,
service marks and trade names appearing in this report
are the property of their respective owners, and are
likewise used for identification purposes only.
This report is a service available
only to active Paid Premium Members.
You may opt-out of receiving report notifications
at any time. Questions or comments may be submitted
by writing to Premium Membership Services 665 S.E. 10 Street, Suite 201 Deerfield Beach, FL 33441-5634 or by calling 1-800-965-8307
or 954-785-1121.
|
|
|

