You are not logged in.
This means you
CAN ONLY VIEW reports that were published prior to Tuesday, February 20, 2024.
You
MUST UPGRADE YOUR MEMBERSHIP if you want to see any current reports.
AFTER MARKET UPDATE - THURSDAY, JANUARY 16TH, 2020
Previous After Market Report Next After Market Report >>>
|
|
|
|
DOW |
+267.42 |
29,297.64 |
+0.92% |
|
Volume |
846,201,580 |
-3% |
|
Volume |
2,289,339,090 |
-5% |
|
NASDAQ |
+98.43 |
9,357.13 |
+1.06% |
|
Advancers |
2,003 |
70% |
|
Advancers |
2,382 |
75% |
|
S&P 500 |
+27.52 |
3,316.81 |
+0.84% |
|
Decliners |
846 |
30% |
|
Decliners |
800 |
25% |
|
Russell 2000 |
+22.82 |
1,705.22 |
+1.36% |
|
52 Wk Highs |
298 |
|
|
52 Wk Highs |
379 |
|
|
S&P 600 |
+13.42 |
1,041.03 |
+1.31% |
|
52 Wk Lows |
6 |
|
|
52 Wk Lows |
14 |
|
|
 |
Major Indices Extend Rally Into New Record High Territory
Kenneth J. Gruneisen - Passed the CAN SLIM® Master's Exam
The Dow surged 267 points, while the S&P 500 gained 0.8%. A rally in the Tech sector helped push the Nasdaq Composite up 1.1%. Breadth was positive as advancers led decliners by more than a 2-1 margin on the NYSE and nearly 3-1 on the Nasdaq exchange. The reported volume totals were lighter than the prior session totals on the NYSE and on the Nasdaq exchange. There were 96 high-ranked companies from the Leaders List that hit a new 52-week high and were listed on the BreakOuts Page, up from the total of 83 on the prior session. New 52-week highs totals expanded and easily outnumbered new 52-week lows totals on the NYSE and on the Nasdaq exchange. The major indices (M criteria) are in a "confirmed uptrend" after enduring distributional pressure in recent weeks. The Featured Stocks Page provides the most timely analysis on high-ranked leaders. Charts used courtesy of www.stockcharts.com
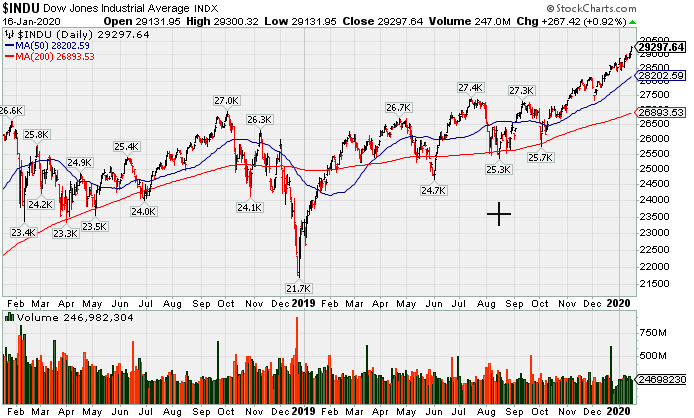
PICTURED: The Dow Jones Industrial Average hit another new record high
All three major averages closed at record levels on Thursday, as investors remained upbeat on trade developments and digested corporate earnings reports. Yesterday, the U.S. and China officially signed the “phase one” trade pact. The agreement was seen as the first step in easing the nearly two-year trade dispute, as it improves intellectual property protections and details a $200 billion increase in Chinese purchases of U.S. goods over two years. Meanwhile, the Senate passed the new U.S.-Mexico-Canada Agreement (USMCA) earlier today, with the trade accord now awaiting President Trump’s signature.
On the data front, December U.S. retail sales rose 0.3%, in-line with economists’ projections. The figure excluding autos increased 0.7%, which was the largest uptick in five months. Treasuries weakened with the yield on the benchmark ten-year note up two basis points to 1.80%.
All 11 S&P 500 sectors finished in positive territory, with Technology stocks pacing the gains. In earnings, Morgan Stanley (MS +6.61%) rose after reporting profits and revenue well above analyst forecasts. The Materials group underperformed on a relative basis, with PPG Industries (PPG -2.55%) fell after the paint supplier released an underwhelming earnings report citing weak industrial markets. Alcoa (AA -11.89%) fell after the aluminum maker revealed a larger-than-expected loss. Elsewhere, Signet Jewelers (SIG +40.20%) soared after reporting upbeat holiday sales.
In commodities, WTI crude added 1.2% to $58.49/barrel. COMEX gold fell 0.1% to $1,553.10/ounce.
|
 Kenneth J. Gruneisen started out as a licensed stockbroker in August 1987, a couple of months prior to the historic stock market crash that took the Dow Jones Industrial Average down -22.6% in a single day. He has published daily fact-based fundamental and technical analysis on high-ranked stocks online for two decades. Through FACTBASEDINVESTING.COM, Kenneth provides educational articles, news, market commentary, and other information regarding proven investment systems that work in good times and bad.
Comments contained in the body of this report are technical opinions only and are not necessarily those of Gruneisen Growth Corp. The material herein has been obtained from sources believed to be reliable and accurate, however, its accuracy and completeness cannot be guaranteed. Our firm, employees, and customers may effect transactions, including transactions contrary to any recommendation herein, or have positions in the securities mentioned herein or options with respect thereto. Any recommendation contained in this report may not be suitable for all investors and it is not to be deemed an offer or solicitation on our part with respect to the purchase or sale of any securities. |
|
 |
Financial, Tech, and Retail Indexes Rose
Kenneth J. Gruneisen - Passed the CAN SLIM® Master's Exam
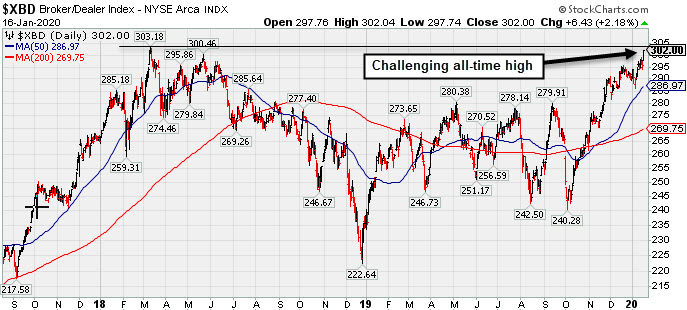
The Broker/Dealer Index ($XBD +2.18%) outpaced the Bank Index ($BKX +0.41%) and the Retail Index ($RLX +0.87%). The Networking Index ($NWX +1.47%) and the Semiconductor Index ($SOX +1.70%) both outpaced the Biotech Index ($BTK +0.31%). The Oil Services Index ($OSX +0.39%) edged higher while the Integrated Oil Index ($XOI -0.07%) finished flat and the Gold & Silver Index ($XAU -0.56%) was a standout decliner.
PICTURED: The Broker/Dealer Index ($XBD +2.18%) is challenging its all-time high.
| Oil Services |
$OSX |
75.65 |
+0.29 |
+0.38% |
-3.37% |
| Integrated Oil |
$XOI |
1,263.58 |
-0.94 |
-0.07% |
-0.55% |
| Semiconductor |
$SOX |
1,903.93 |
+31.77 |
+1.70% |
+2.94% |
| Networking |
$NWX |
595.19 |
+8.62 |
+1.47% |
+2.02% |
| Broker/Dealer |
$XBD |
302.00 |
+6.43 |
+2.18% |
+4.00% |
| Retail |
$RLX |
2,479.73 |
+21.40 |
+0.87% |
+1.24% |
| Gold & Silver |
$XAU |
102.82 |
-0.58 |
-0.56% |
-3.83% |
| Bank |
$BKX |
110.52 |
+0.45 |
+0.41% |
-2.51% |
| Biotech |
$BTK |
5,215.19 |
+16.29 |
+0.31% |
+2.92% |
|
|
|
 |
Rebound Near 50-Day Average But Concerns Remain
Kenneth J. Gruneisen - Passed the CAN SLIM® Master's Exam
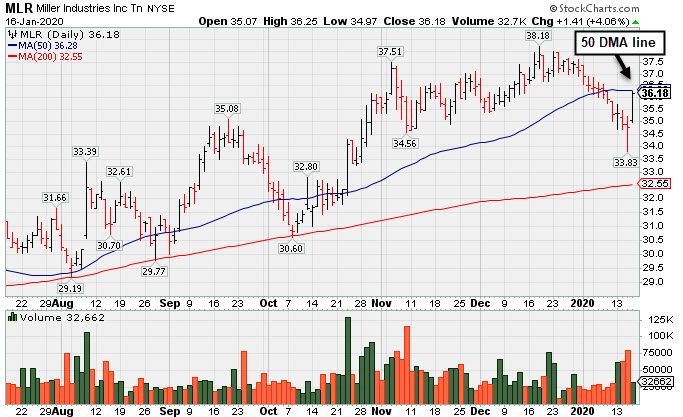
Miller Industries Inc (MLR +$1.41 or +4.06% to $36.18) posted a big gain today with below average volume. It rebounded near its 50-day moving average (DMA) line ($36.36) which may act as resistance. Its current Relative Strength Rating of 76 is below the 80+ minimum guideline for buy candidates. It will be dropped from the Featured Stocks list tonight.
MLR has sputtered since reporting earnings which were below the fundamental guidelines of the fact-based investment system. It reported earnings -7% on +0% sales revenues for the Sep '19 quarter versus the year ago period, below the +25% minimum guideline (C criteria) raising fundamental concerns.
MLR's annual earnings history (A criteria) has been good. The very small supply of only 11.4 million shares outstanding (S criteria) can contribute to greater price volatility in the event of institutional buying or selling. It returned to the Featured Stocks list on 9/24/19 when highlighted in yellow in the mid-day report (read here). It was last shown in this FSU section on 12/27/19 with an annotated graph under the headline, "Towing/Recovery Equipment Firm Remains Perched Near Record High".
The number of top-rated funds owning its shares rose from 196 in Mar '18 to 251 in Dec '19, a reassuring sign concerning the I criteria. The current Up/Down Volume Ratio of 0.9 is an unbiased indication its shares have been under slight distributional pressure over the past 50 days. It has earned a C Timeliness rating and a D Sponsorship Rating.
Charts courtesy of www.stockcharts.com
|
|
|
Color Codes Explained :
Y - Better candidates highlighted by our
staff of experts.
G - Previously featured
in past reports as yellow but may no longer be buyable under the
guidelines.
***Last / Change / Volume data in this table is the closing quote data***
Symbol/Exchange
Company Name
Industry Group |
PRICE |
CHANGE
(%Change) |
Day High |
Volume
(% DAV)
(% 50 day avg vol) |
52 Wk Hi
% From Hi |
Featured
Date |
Price
Featured |
Pivot Featured |
|
Max Buy |
 MLR
-
NYSE
MLR
-
NYSE
Miller Industries Inc
AUTOMOTIVE - Auto Parts
|
$36.18
|
+1.41
4.06% |
$36.25
|
32,662
77.03% of 50 DAV
50 DAV is 42,400
|
$38.18
-5.24%
|
9/24/2019
|
$34.00
|
PP = $35.36
|
|
MB = $37.13
|
 Most Recent Note - 1/16/2020 6:14:10 PM
Posted a big gain with light volume today, rebounding near its 50 DMA line ($36.36) which may act as resistance. Reported Sep '19 earnings which were below the fundamental guidelines of the fact-based investment system. It will be dropped from the Featured Stocks list tonight. See the latest FSU analysis for additional details and a new annotated graph.
>>> FEATURED STOCK ARTICLE : Rebound Near 50-Day Average But Concerns Remain - 1/16/2020 |
View all notes |
Set NEW NOTE alert |
Company Profile |
SEC
News |
Chart |
Request a new note
C
A
S
I |
CCBG
-
NASDAQ
Capital City Bk Gp
BANKING - Regional - Mid-Atlantic Banks
|
$29.00
|
+0.35
1.22% |
$29.07
|
43,631
96.53% of 50 DAV
50 DAV is 45,200
|
$30.95
-6.30%
|
12/16/2019
|
$30.07
|
PP = $30.95
|
|
MB = $32.50
|
Most Recent Note - 1/14/2020 5:05:15 PM
G - Color code is changed to green while slumping below its 50 DMA line ($29.61) raising concerns after meeting resistance at its 52-week high. Prior low ($28.16 on 12/03/19) defines the next important support level.
>>> FEATURED STOCK ARTICLE : Perched Near 52-Week High After Forming an Orderly Base - 1/2/2020 |
View all notes |
Set NEW NOTE alert |
Company Profile |
SEC
News |
Chart |
Request a new note
C
A
S
I |
FTNT
-
NASDAQ
Fortinet Inc
Computer Sftwr-Security
|
$119.09
|
+2.04
1.74% |
$119.23
|
842,117
67.21% of 50 DAV
50 DAV is 1,253,000
|
$117.74
1.15%
|
12/9/2019
|
$103.85
|
PP = $106.10
|
|
MB = $111.41
|
Most Recent Note - 1/14/2020 5:08:51 PM
G - Hit yet another new 52-week high with below average volume behind today's gain, wedging higher and getting very extended from any sound base. Its 50 DMA line ($104.75) defines important near-term support to watch. See the latest FSU analysis for more details and a new annotated graph.
>>> FEATURED STOCK ARTICLE : Extended From Base After Wedging Higher - 1/14/2020 |
View all notes |
Set NEW NOTE alert |
Company Profile |
SEC
News |
Chart |
Request a new note
C
A
S
I |
SPSC
-
NASDAQ
S P S Commerce Inc
COMPUTER SOFTWARE and SERVICES - Application Software
|
$58.43
|
+0.65
1.12% |
$58.64
|
185,761
108.00% of 50 DAV
50 DAV is 172,000
|
$59.14
-1.20%
|
11/29/2019
|
$56.59
|
PP = $59.24
|
|
MB = $62.20
|
Most Recent Note - 1/13/2020 6:31:39 PM
Y - Still perched only -3% off its all-time high. Subsequent gains above its pivot point backed by at least +40% above average volume are needed to trigger a new technical buy signal. Fundamentals remain strong. Its Relative Strength Rating of 81 is just above the 80+ minimum guideline for buy candidates. See the latest FSU analysis for more details and a new annotated graph.
>>> FEATURED STOCK ARTICLE : Still Lingering Below Prior Resistance - 1/13/2020 |
View all notes |
Set NEW NOTE alert |
Company Profile |
SEC
News |
Chart |
Request a new note
C
A
S
I |
AUDC
-
NASDAQ
Audiocodes Ltd
ELECTRONICS - Scientific and Technical Instrum
|
$28.15
|
+1.03
3.80% |
$28.21
|
256,990
98.09% of 50 DAV
50 DAV is 262,000
|
$27.91
0.86%
|
9/13/2019
|
$19.68
|
PP = $19.84
|
|
MB = $20.83
|
Most Recent Note - 1/16/2020 6:16:20 PM
G - Hit another new all-time high with average volume behind today's big gain. Very extended from the previously noted base. Its 50 DMA line ($24.31) defines support above with prior highs in the $22 area. Fundamentals remain strong.
>>> FEATURED STOCK ARTICLE : Large Loss With Higher Volume Indicates Distributional Pressure - 1/6/2020 |
View all notes |
Set NEW NOTE alert |
Company Profile |
SEC
News |
Chart |
Request a new note
C
A
S
I |
Symbol/Exchange
Company Name
Industry Group |
PRICE |
CHANGE
(%Change) |
Day High |
Volume
(% DAV)
(% 50 day avg vol) |
52 Wk Hi
% From Hi |
Featured
Date |
Price
Featured |
Pivot Featured |
|
Max Buy |
CHDN
-
NASDAQ
Churchill Downs Inc
LEISURE - Gaming Activities
|
$143.97
|
+3.28
2.33% |
$144.18
|
177,942
73.83% of 50 DAV
50 DAV is 241,000
|
$143.22
0.52%
|
10/8/2019
|
$129.77
|
PP = $132.83
|
|
MB = $139.47
|
Most Recent Note - 1/16/2020 6:18:23 PM
G - Hit another new 52-week high with light volume behind today's 4th consecutive gain. Its 50 DMA line ($132.15) defines near-term support above the prior low ($121.81 on 11/07/19) The Jun and Sep '19 quarterly earnings versus the year ago periods were both below the +25% minimum guideline (C criteria) and raised fundamental concerns.
>>> FEATURED STOCK ARTICLE : Touched a New HIgh With Gains Backed by Light Volume - 12/30/2019 |
View all notes |
Set NEW NOTE alert |
Company Profile |
SEC
News |
Chart |
Request a new note
C
A
S
I |
LULU
-
NASDAQ
Lululemon Athletica
MANUFACTURING - Textile Manufacturing
|
$243.71
|
+0.22
0.09% |
$245.52
|
1,408,525
68.38% of 50 DAV
50 DAV is 2,060,000
|
$247.51
-1.54%
|
9/6/2019
|
$201.25
|
PP = $194.35
|
|
MB = $204.07
|
Most Recent Note - 1/13/2020 12:56:03 PM
G - Powering to a new all-time high with today's gap up and big gain backed by heavier volume, getting more extended from any sound base. Its 50 DMA line and prior low ($218.18 on 12/12/19) define important near-term support to watch. Recently reported earnings +28% on +23% sales revenues for the Oct '19 quarter.
>>> FEATURED STOCK ARTICLE : Perched at All-Time High After Gains Lacking Great Volume - 1/9/2020 |
View all notes |
Set NEW NOTE alert |
Company Profile |
SEC
News |
Chart |
Request a new note
C
A
S
I |
CPRT
-
NASDAQ
Copart Inc
SPECIALTY RETAIL - Auto Dealerships
|
$97.21
|
+0.54
0.56% |
$97.36
|
926,105
50.30% of 50 DAV
50 DAV is 1,841,000
|
$97.16
0.05%
|
1/2/2020
|
$92.80
|
PP = $92.51
|
|
MB = $97.14
|
Most Recent Note - 1/13/2020 6:34:04 PM
Y - Posted a 4th consecutive gain with light volume, wedging further into new all-time high territory. Its 50 DMA line ($88.40) defines near-term support. Fundamentals remain strong.
>>> FEATURED STOCK ARTICLE : Perched at All-Time HIgh Following Recent Volume-Driven Gain - 1/7/2020 |
View all notes |
Set NEW NOTE alert |
Company Profile |
SEC
News |
Chart |
Request a new note
C
A
S
I |
NMIH
-
NASDAQ
N M I Holdings Inc Cl A
Finance-MrtgandRel Svc
|
$33.15
|
+0.37
1.13% |
$33.23
|
431,511
81.88% of 50 DAV
50 DAV is 527,000
|
$35.79
-7.38%
|
11/8/2019
|
$32.89
|
PP = $31.44
|
|
MB = $33.01
|
Most Recent Note - 1/14/2020 5:11:33 PM
G - A rebound above the 50 DMA line ($32.89) still is needed for its outlook to improve. Prior highs in the $30-31 area define the next important near-term support. Fundamentals remain strong.
>>> FEATURED STOCK ARTICLE : Outlook Hurt by Slump Below 50-Day Moving Average - 1/10/2020 |
View all notes |
Set NEW NOTE alert |
Company Profile |
SEC
News |
Chart |
Request a new note
C
A
S
I |
SPLK
-
NASDAQ
Splunk Inc
Computer Sftwr-Database
|
$160.32
|
+4.30
2.76% |
$160.43
|
1,509,035
74.82% of 50 DAV
50 DAV is 2,017,000
|
$158.70
1.02%
|
11/25/2019
|
$147.79
|
PP = $142.16
|
|
MB = $149.27
|
Most Recent Note - 1/16/2020 6:20:22 PM
G - Hit yet another new high with today's gain backed by below average volume, getting more extended from the previously noted base. Prior highs in the $142-143 area define important support to watch coinciding with its 50 DMA line ($143).
>>> FEATURED STOCK ARTICLE : New High Hit With Another Gain on Near Average Volume - 1/8/2020 |
View all notes |
Set NEW NOTE alert |
Company Profile |
SEC
News |
Chart |
Request a new note
C
A
S
I |
Symbol/Exchange
Company Name
Industry Group |
PRICE |
CHANGE
(%Change) |
Day High |
Volume
(% DAV)
(% 50 day avg vol) |
52 Wk Hi
% From Hi |
Featured
Date |
Price
Featured |
Pivot Featured |
|
Max Buy |
PAYC
-
NYSE
Paycom Software Inc
COMPUTER SOFTWARE and SERVICES - Application Software
|
$294.31
|
+5.22
1.81% |
$294.40
|
326,582
62.80% of 50 DAV
50 DAV is 520,000
|
$297.53
-1.08%
|
11/20/2019
|
$252.97
|
PP = $259.81
|
|
MB = $272.80
|
Most Recent Note - 1/13/2020 6:30:02 PM
G - Hit another new high with today's 9th consecutive gain, very extended from any sound base. Its 50 DMA line ($256) defines important near-term support to watch. Fundamentals remain strong.
>>> FEATURED STOCK ARTICLE : Perched Near High and Near the Max Buy Level - 1/3/2020 |
View all notes |
Set NEW NOTE alert |
Company Profile |
SEC
News |
Chart |
Request a new note
C
A
S
I |
BLD
-
NYSE
Topbuild Corp
Bldg-Constr Prds/Misc
|
$110.41
|
+1.09
1.00% |
$111.52
|
317,971
115.63% of 50 DAV
50 DAV is 275,000
|
$113.74
-2.93%
|
12/9/2019
|
$109.71
|
PP = $113.84
|
|
MB = $119.53
|
Most Recent Note - 1/15/2020 5:28:10 PM
Y - Color code is changed to yellow after today's 3rd consecutive gain helped it rebound above its 50 DMA line ($106.78) helping its outlook to improve.
>>> FEATURED STOCK ARTICLE : Recent Slump Below 50-Day Moving Average Did Technical Damage - 12/24/2019 |
View all notes |
Set NEW NOTE alert |
Company Profile |
SEC
News |
Chart |
Request a new note
C
A
S
I |
GLOB
-
NYSE
Globant SA
Computer-Tech Services
|
$116.66
|
+0.00
0.00% |
$118.41
|
177,609
65.30% of 50 DAV
50 DAV is 272,000
|
$118.84
-1.83%
|
11/14/2019
|
$106.87
|
PP = $112.43
|
|
MB = $118.05
|
Most Recent Note - 1/15/2020 5:25:17 PM
Y - Posted a solid gain with +12% above average volume today for a new high. Gains above the pivot point backed by at least +40% above average volume are needed to trigger a proper technical buy signal. Its 50 DMA line ($104) defines important near-term support to watch on pullbacks. Fundamentals remain strong. See the latest FSU analysis for more details and a new annotated graph.
>>> FEATURED STOCK ARTICLE : Gain for New High Today Backed by Only +12% Above Average Volume - 1/15/2020 |
View all notes |
Set NEW NOTE alert |
Company Profile |
SEC
News |
Chart |
Request a new note
C
A
S
I |
|
|
|
THESE ARE NOT BUY RECOMMENDATIONS!
Comments contained in the body of this report are technical
opinions only. The material herein has been obtained
from sources believed to be reliable and accurate, however,
its accuracy and completeness cannot be guaranteed.
This site is not an investment advisor, hence it does
not endorse or recommend any securities or other investments.
Any recommendation contained in this report may not
be suitable for all investors and it is not to be deemed
an offer or solicitation on our part with respect to
the purchase or sale of any securities. All trademarks,
service marks and trade names appearing in this report
are the property of their respective owners, and are
likewise used for identification purposes only.
This report is a service available
only to active Paid Premium Members.
You may opt-out of receiving report notifications
at any time. Questions or comments may be submitted
by writing to Premium Membership Services 665 S.E. 10 Street, Suite 201 Deerfield Beach, FL 33441-5634 or by calling 1-800-965-8307
or 954-785-1121.
|
|
|