You are not logged in.
This means you
CAN ONLY VIEW reports that were published prior to Tuesday, February 20, 2024.
You
MUST UPGRADE YOUR MEMBERSHIP if you want to see any current reports.
AFTER MARKET UPDATE - WEDNESDAY, JANUARY 16TH, 2019
Previous After Market Report Next After Market Report >>>
|
|
|
|
DOW |
+141.57 |
24,207.16 |
+0.59% |
|
Volume |
863,043,680 |
-1% |
|
Volume |
2,170,270,290 |
+7% |
|
NASDAQ |
+10.86 |
7,034.69 |
+0.15% |
|
Advancers |
1,816 |
62% |
|
Advancers |
1,898 |
62% |
|
S&P 500 |
+5.80 |
2,616.10 |
+0.22% |
|
Decliners |
1,116 |
38% |
|
Decliners |
1,172 |
38% |
|
Russell 2000 |
+9.48 |
1,454.70 |
+0.66% |
|
52 Wk Highs |
22 |
|
|
52 Wk Highs |
30 |
|
|
S&P 600 |
+7.07 |
906.84 |
+0.79% |
|
52 Wk Lows |
9 |
|
|
52 Wk Lows |
16 |
|
|
 |
Indices Were Underpinned by Leading Financial Stocks
Kenneth J. Gruneisen - Passed the CAN SLIM® Master's Exam
Stocks finished higher Wednesday. The Dow added 141 points to 24,207 while the S&P 500 climbed 5 points to 2,616. The Nasdaq Composite was up 10 points to 7,034. The volume totals were mixed, lighter than the prior session on the NYSE and higher on the Nasdaq exchange. Breadth was positive as advancers led decliners by a 3-2 margin on the NYSE and on the Nasdaq exchange. There was only 1 high-ranked company from the Leaders List that made a new 52-week high and was listed on the BreakOuts Page, versus the prior session total of 3 stocks. New 52-week highs outnumbered new 52-week lows on the NYSE and on the Nasdaq exchange versus the prior session. The major indices are in a confirmed uptrend after recently noted improvements helped to signal a change in market direction (M criteria) back to a bullish stance. The Featured Stocks Page provides the most timely analysis on high-ranked leaders. Charts used courtesy of www.stockcharts.com
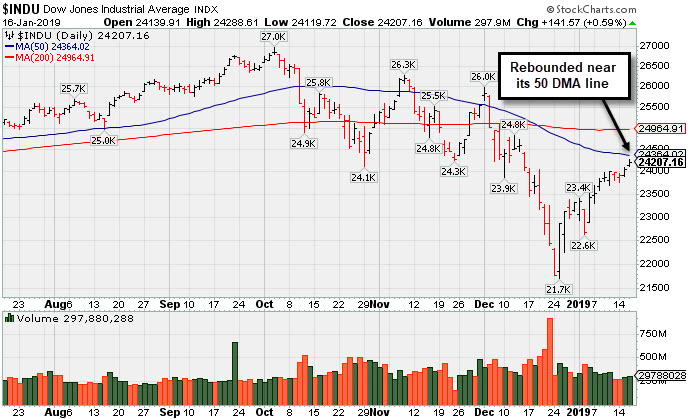
PICTURED: The Dow Jones Industrial Average rose near its 50-day moving average (DMA) line on Wednesday.
The major averages extended gains as strong earnings reports from several large-cap banks boosted investor sentiment. On the data front, a report showed mortgage applications spiked 13.5% in the most recent week as interest rates eased. An additional update showed home builder sentiment rebounded in January after posting losses in the prior two months. A separate release revealed import prices dipped 1.0% in December, which led to the largest year-over-year decline since 2016 of 0.6%.
Six of 11 S&P 500 sectors finished in positive territory as Financials paced gains. Shares of Bank of America (BAC +7.16%) rose after besting profit projections. Goldman Sachs (GS +9.54%) rose, its best day in ten-years as the investment bank beat forecasts on the top and bottom line. In Industrials, United Continental (UAL +6.35%) rose after topping revenue projections. However, not all corporate updates were positive as shares of Ford (F -6.33%) fell after the automaker pre-announced earnings that fell short of analyst expectations. Elsewhere, Nordstrom (JWN -4.76%) fell after the retailer revealed disappointing holiday sales figures.
Treasuries weakened as the yield of the 10-year note advanced one basis point to 2.72%. In commodities, WTI crude declined 0.2% to $52.02/barrel. COMEX gold gained 0.4% to $1,294.00/ounce. |
 Kenneth J. Gruneisen started out as a licensed stockbroker in August 1987, a couple of months prior to the historic stock market crash that took the Dow Jones Industrial Average down -22.6% in a single day. He has published daily fact-based fundamental and technical analysis on high-ranked stocks online for two decades. Through FACTBASEDINVESTING.COM, Kenneth provides educational articles, news, market commentary, and other information regarding proven investment systems that work in good times and bad.
Comments contained in the body of this report are technical opinions only and are not necessarily those of Gruneisen Growth Corp. The material herein has been obtained from sources believed to be reliable and accurate, however, its accuracy and completeness cannot be guaranteed. Our firm, employees, and customers may effect transactions, including transactions contrary to any recommendation herein, or have positions in the securities mentioned herein or options with respect thereto. Any recommendation contained in this report may not be suitable for all investors and it is not to be deemed an offer or solicitation on our part with respect to the purchase or sale of any securities. |
|
 |
Financial Indexes Posted Big Gains
Kenneth J. Gruneisen - Passed the CAN SLIM® Master's Exam
Financials did the heavy lifting as the Bank Index ($BKX +2.52%) and the Broker/Dealer Index ($XBD +2.93%) both posted big gains. The Retail Index ($RLX +0.11%) edged higher. The tech sector had a negative bias as the Biotech Index ($BTK -0.16%), Networking Index ($NWX -0.35%), and the Semiconductor Index ($SOX -0.85%) each lost ground. Energy-linked groups also had a negative tilt as the Oil Services Index ($OSX -0.80%) and the Integrated Oil Index ($XOI -0.26%) both fell. Meanwhile, the Gold & Silver Index ($XAU +0.24%) edged higher.
Charts courtesy of www.stockcharts.com
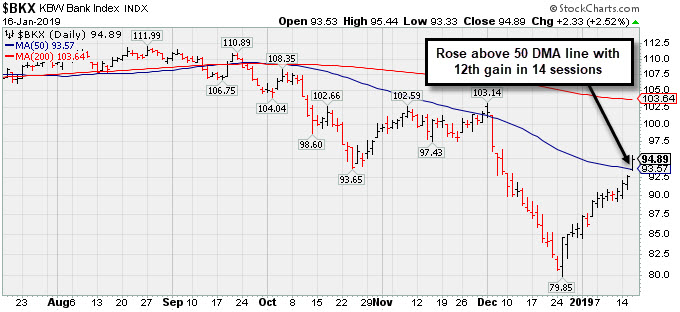 PICTURED: The Bank Index ($BKX +2.52%) rebounded above its 50-day moving average (DMA) line with the 12th gain in 14 sessions.
| Oil Services |
$OSX |
93.91 |
-0.75 |
-0.79% |
+16.51% |
| Integrated Oil |
$XOI |
1,246.62 |
-3.20 |
-0.26% |
+7.55% |
| Semiconductor |
$SOX |
1,187.19 |
-9.84 |
-0.82% |
+2.77% |
| Networking |
$NWX |
515.39 |
-1.80 |
-0.35% |
+5.47% |
| Broker/Dealer |
$XBD |
259.01 |
+7.38 |
+2.93% |
+9.13% |
| Retail |
$RLX |
2,088.43 |
+2.23 |
+0.11% |
+7.02% |
| Gold & Silver |
$XAU |
69.54 |
+0.17 |
+0.25% |
-1.59% |
| Bank |
$BKX |
94.89 |
+2.33 |
+2.52% |
+10.61% |
| Biotech |
$BTK |
4,795.83 |
-7.90 |
-0.16% |
+13.62% |
|
|
|
 |
|
|
|
Color Codes Explained :
Y - Better candidates highlighted by our
staff of experts.
G - Previously featured
in past reports as yellow but may no longer be buyable under the
guidelines.
***Last / Change / Volume data in this table is the closing quote data***
Symbol/Exchange
Company Name
Industry Group |
PRICE |
CHANGE
(%Change) |
Day High |
Volume
(% DAV)
(% 50 day avg vol) |
52 Wk Hi
% From Hi |
Featured
Date |
Price
Featured |
Pivot Featured |
|
Max Buy |
MLR
-
NYSE
Miller Industries Inc
AUTOMOTIVE - Auto Parts
|
$28.63
|
+0.34
1.20% |
$28.63
|
17,035
44.83% of 50 DAV
50 DAV is 38,000
|
$29.40
-2.62%
|
11/30/2018
|
$28.35
|
PP = $29.50
|
|
MB = $30.98
|
Most Recent Note - 1/15/2019 3:53:01 PM
Y - Volume totals have still been cooling while perched within close striking distance of prior highs. Little resistance remains due to overhead supply up to the $29 level. Its 50 DMA line and recent low define near-term support to watch on pullbacks.
>>> FEATURED STOCK ARTICLE : Perched Within Close Striking Distance of Prior High - 1/8/2019 |
View all notes |
Set NEW NOTE alert |
Company Profile |
SEC
News |
Chart |
Request a new note
C
A
S
I |
UBNT
-
NASDAQ
Ubiquiti Networks
TELECOMMUNICATIONS - Diversified Communication Serv
|
$101.79
|
-1.14
-1.11% |
$103.89
|
334,666
77.47% of 50 DAV
50 DAV is 432,000
|
$115.44
-11.82%
|
11/9/2018
|
$108.20
|
PP = $101.43
|
|
MB = $106.50
|
Most Recent Note - 1/15/2019 5:10:15 PM
G - Posted a small gain today. Color code was changed to green after slumping back below its 50 DMA line ($103.78) on the prior session hurting its outlook. Prior low ($92.08 on 12/24/18) defines the next important support. Fundamentals remain strong. See the latest FSU analysis for more details and a new annotated graph.
>>> FEATURED STOCK ARTICLE : Sputtering Below 50-Day Moving Average Again - 1/15/2019 |
View all notes |
Set NEW NOTE alert |
Company Profile |
SEC
News |
Chart |
Request a new note
C
A
S
I |
PLNT
-
NYSE
Planet Fitness Inc Cl A
Leisure-Services
|
$57.90
|
-0.10
-0.17% |
$58.71
|
1,101,816
83.53% of 50 DAV
50 DAV is 1,319,000
|
$59.23
-2.25%
|
11/7/2018
|
$57.10
|
PP = $55.45
|
|
MB = $58.22
|
Most Recent Note - 1/14/2019 5:02:38 PM
Y - Pulled back below its "max buy" level today and its color code is changed to yellow. Its 50 DMA line ($53.57) defines important near-term support to watch above the recent low ($48).
>>> FEATURED STOCK ARTICLE : Found Prompt Support Near 50-Day Moving Average Line - 1/4/2019 |
View all notes |
Set NEW NOTE alert |
Company Profile |
SEC
News |
Chart |
Request a new note
C
A
S
I |
TEAM
-
NASDAQ
Atlassian Corp Plc Cl A
Comp Sftwr-Spec Enterprs
|
$94.32
|
-1.06
-1.11% |
$96.69
|
1,659,061
114.10% of 50 DAV
50 DAV is 1,454,000
|
$98.21
-3.96%
|
1/7/2019
|
$94.68
|
PP = $98.31
|
|
MB = $103.23
|
Most Recent Note - 1/15/2019 12:45:24 PM
Y - Managed a "positive reversal" after early weakness today. Stubbornly holding its ground perched within close striking distance of its prior high. Due to report earnings news after market close on Thursday, January 17, 2019. Color code was changed to yellow with new pivot point cited based on its 10/01/18 high plus 10 cents. Subsequent gains above the pivot point backed by at least +40% above average volume may trigger a technical buy signal. Fundamentals remain strong. Found support at its 200 DMA line during its consolidation in recent months.
>>> FEATURED STOCK ARTICLE : Rebounding Near Prior High Which May Act as Resistance - 1/7/2019 |
View all notes |
Set NEW NOTE alert |
Company Profile |
SEC
News |
Chart |
Request a new note
C
A
S
I |
INVA
-
NASDAQ
Innoviva Inc
Medical-Biomed/Biotech
|
$19.43
|
+0.20
1.04% |
$19.57
|
673,959
56.78% of 50 DAV
50 DAV is 1,187,000
|
$19.82
-1.97%
|
11/23/2018
|
$17.74
|
PP = $18.09
|
|
MB = $18.99
|
Most Recent Note - 1/15/2019 3:52:14 PM
G - Holding its ground perched near its 52-week high after a streak of gains with volume totals cooling. The 50 DMA line ($17.19) and prior low ($15.55 on 12/24/18) define near-term support.
>>> FEATURED STOCK ARTICLE : Consolidating Above 50-Day Average Line Near High - 1/3/2019 |
View all notes |
Set NEW NOTE alert |
Company Profile |
SEC
News |
Chart |
Request a new note
C
A
S
I |
Symbol/Exchange
Company Name
Industry Group |
PRICE |
CHANGE
(%Change) |
Day High |
Volume
(% DAV)
(% 50 day avg vol) |
52 Wk Hi
% From Hi |
Featured
Date |
Price
Featured |
Pivot Featured |
|
Max Buy |
|
|
|
THESE ARE NOT BUY RECOMMENDATIONS!
Comments contained in the body of this report are technical
opinions only. The material herein has been obtained
from sources believed to be reliable and accurate, however,
its accuracy and completeness cannot be guaranteed.
This site is not an investment advisor, hence it does
not endorse or recommend any securities or other investments.
Any recommendation contained in this report may not
be suitable for all investors and it is not to be deemed
an offer or solicitation on our part with respect to
the purchase or sale of any securities. All trademarks,
service marks and trade names appearing in this report
are the property of their respective owners, and are
likewise used for identification purposes only.
This report is a service available
only to active Paid Premium Members.
You may opt-out of receiving report notifications
at any time. Questions or comments may be submitted
by writing to Premium Membership Services 665 S.E. 10 Street, Suite 201 Deerfield Beach, FL 33441-5634 or by calling 1-800-965-8307
or 954-785-1121.
|
|
|

