You are not logged in.
This means you
CAN ONLY VIEW reports that were published prior to Monday, February 19, 2024.
You
MUST UPGRADE YOUR MEMBERSHIP if you want to see any current reports.
AFTER MARKET UPDATE - WEDNESDAY, JANUARY 15TH, 2020
Previous After Market Report Next After Market Report >>>
|
|
|
|
DOW |
+90.55 |
29,030.22 |
+0.31% |
|
Volume |
871,774,070 |
-5% |
|
Volume |
2,419,930,640 |
-5% |
|
NASDAQ |
+7.37 |
9,258.70 |
+0.08% |
|
Advancers |
1,578 |
56% |
|
Advancers |
1,785 |
56% |
|
S&P 500 |
+6.14 |
3,289.29 |
+0.19% |
|
Decliners |
1,262 |
44% |
|
Decliners |
1,377 |
44% |
|
Russell 2000 |
+6.66 |
1,682.40 |
+0.40% |
|
52 Wk Highs |
271 |
|
|
52 Wk Highs |
287 |
|
|
S&P 600 |
+3.93 |
1,027.61 |
+0.38% |
|
52 Wk Lows |
7 |
|
|
52 Wk Lows |
24 |
|
|
 |
Major Indices Inched Higher and Remain at Record Highs
Kenneth J. Gruneisen - Passed the CAN SLIM® Master's Exam
The S&P 500 ticked up 0.2%, recording its second record close this week. The Nasdaq Composite rose less than 0.1%. The Dow advanced 90 points to close above the 29,000 mark for the first time. Breadth was slightly positive as advancers led decliners by about a 9-7 margin on the NYSE and on the Nasdaq exchange. The reported volume totals were lighter than the prior session totals on the NYSE and on the Nasdaq exchange. There were 83 high-ranked companies from the Leaders List that hit a new 52-week high and were listed on the BreakOuts Page, matching the total of 83 on the prior session. New 52-week highs totals easily outnumbered new 52-week lows totals on the NYSE and on the Nasdaq exchange. The major indices (M criteria) are in a "confirmed uptrend" after enduring distributional pressure in recent weeks. The Featured Stocks Page provides the most timely analysis on high-ranked leaders. Charts used courtesy of www.stockcharts.com
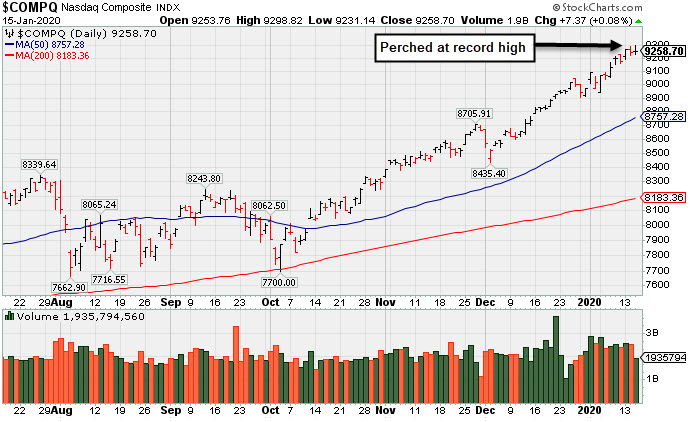
PICTURED: The Nasdaq Composite Index is perched at its record high
Stocks finished higher Wednesday, as investors digested corporate earnings reports and the official signing of the U.S.-China “phase one” trade pact. The terms of the agreement aims to curb intellectual property theft and boost U.S. exports to $200 billion in an effort to close the trade imbalance. The Trump administration said the enforcement mechanism in place sets the deal apart from past agreements between the two countries.
Eight of 11 S&P 500 sectors finished in positive territory. In earnings news, Goldman Sachs (GS -0.18%) sputtered after profits falling short of analyst expectations. The bank’s $1 billion litigation charges are seemingly overshadowing a 63% surge in fixed income revenue. Bank of America (BAC -1.84%) fell following a 4% decline in fourth-quarter profits. Shares of BlackRock (BLK +2.30%) rose% after revealing its assets surpassed the $7 trillion mark for the first time. Elsewhere, UnitedHealth Group (UNH 2.83%) rose following its positive quarterly results. Target (TGT -6.59%) fell after reporting disappointing holiday sales, as the retailer struggled in some key merchandise categories.
Treasuries strengthened, with the yield on the 10-year note down three basis points to 1.78%. On the data front, core PPI (excluding food and energy) rose 1.1% year-over year, slower than the prior 1.3% pace. Another update showed manufacturing activity in the New York region improved last month.
|
 Kenneth J. Gruneisen started out as a licensed stockbroker in August 1987, a couple of months prior to the historic stock market crash that took the Dow Jones Industrial Average down -22.6% in a single day. He has published daily fact-based fundamental and technical analysis on high-ranked stocks online for two decades. Through FACTBASEDINVESTING.COM, Kenneth provides educational articles, news, market commentary, and other information regarding proven investment systems that work in good times and bad.
Comments contained in the body of this report are technical opinions only and are not necessarily those of Gruneisen Growth Corp. The material herein has been obtained from sources believed to be reliable and accurate, however, its accuracy and completeness cannot be guaranteed. Our firm, employees, and customers may effect transactions, including transactions contrary to any recommendation herein, or have positions in the securities mentioned herein or options with respect thereto. Any recommendation contained in this report may not be suitable for all investors and it is not to be deemed an offer or solicitation on our part with respect to the purchase or sale of any securities. |
|
 |
Gold & Silver Index Posts Standout Gain
Kenneth J. Gruneisen - Passed the CAN SLIM® Master's Exam
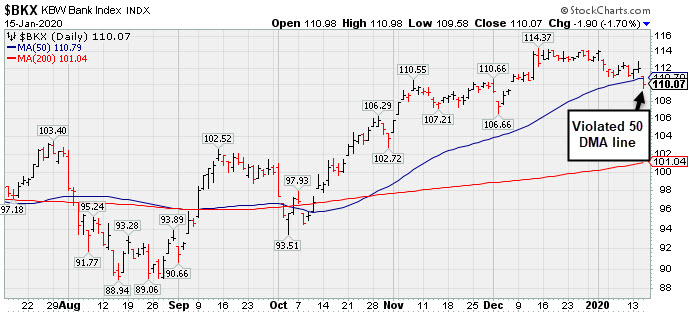
The Bank Index ($BKX -1.70%) outpaced the were mixed as the Broker/Dealer Index ($XBD -0.34%) and the Retail Index ($RLX -0.53%) to the downside. The Semiconductor Index ($SOX -1.19%) led the tech sector lower as the Biotech Index ($BTK -0.60%) and Networking Index ($NWX -0.35%) both posted smaller losses. The Oil Services Index ($OSX -1.78%) and the Integrated Oil Index ($XOI -0.74%) also lost ground, meanwhile, the Gold & Silver Index ($XAU +2.01%) was a standout gainer.
PICTURED: The Bank Index ($BKX -1.70%) violated its 50-day moving average (DMA) line.
| Oil Services |
$OSX |
75.36 |
-1.36 |
-1.77% |
-3.74% |
| Integrated Oil |
$XOI |
1,264.52 |
-9.37 |
-0.74% |
-0.47% |
| Semiconductor |
$SOX |
1,872.16 |
-22.48 |
-1.19% |
+1.22% |
| Networking |
$NWX |
586.57 |
-2.08 |
-0.35% |
+0.54% |
| Broker/Dealer |
$XBD |
295.57 |
-1.02 |
-0.34% |
+1.79% |
| Retail |
$RLX |
2,458.33 |
-13.09 |
-0.53% |
+0.37% |
| Gold & Silver |
$XAU |
103.40 |
+2.04 |
+2.01% |
-3.29% |
| Bank |
$BKX |
110.07 |
-1.90 |
-1.70% |
-2.90% |
| Biotech |
$BTK |
5,198.89 |
-31.49 |
-0.60% |
+2.59% |
|
|
|
 |
Gain for New High Today Backed by Only +12% Above Average Volume
Kenneth J. Gruneisen - Passed the CAN SLIM® Master's Exam
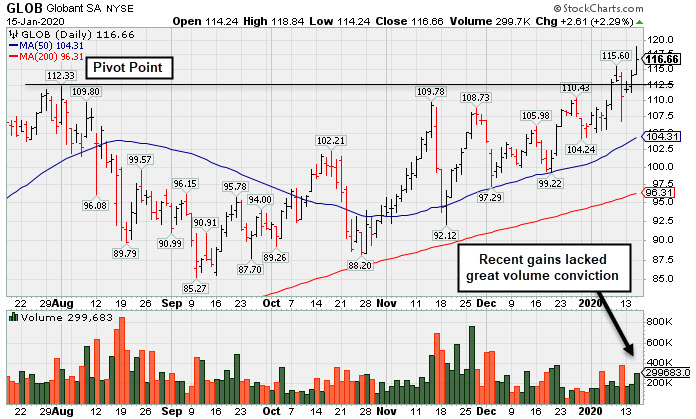
Globant SA (GLOB +$2.61 or +2.29% to $116.66) posted a solid gain with +12% above average volume today for a new high. Gains above the pivot point must be backed by at least +40% above average volume to trigger a proper technical buy signal, so disciplined investors may watch for confirming gains with heavier volume. Its 50-day moving average (DMA) line ($104.31) defines important near-term support to watch on pullbacks.
GLOB went through a choppy consolidation after highlighted in yellow with pivot point cited based on its 8/01/19 high plus 10 cents in the 11/14/19 mid-day report (read here). It made gradual progress since last shown in this FSU section on 12/26/19 with an annotated graph under the headline, "Rebound Has Globant Perched Within Striking Distance of High".
It reported earnings +35% on +27% sales revenues for the Sep '19 quarter versus the year ago period, continuing its strong earning track record above the +25% minimum earnings guideline (C criteria). It has a strong annual earnings (A criteria) history and has a 97 Earnings Per Share Rating.
This Luxembourg-based Computer - Tech Services firm completed a Secondary Offering on 6/21/18. The number of top-rated funds owning its shares rose from 235 in Mar '18 to 539 in Sep '19, a reassuring sign concerning the I criteria. Its current Up/Down Volume Ratio of 1.7 is an unbiased indication its shares have been under accumulation over the past 50 days. It has a Timeliness rating of A and Sponsorship Rating of C. Its small supply of 36.8 million shares outstanding (S criteria) can contribute to greater volatility in the event of institutional buying or selling.
Charts courtesy of www.stockcharts.com
 |
|
|
Color Codes Explained :
Y - Better candidates highlighted by our
staff of experts.
G - Previously featured
in past reports as yellow but may no longer be buyable under the
guidelines.
***Last / Change / Volume data in this table is the closing quote data***
Symbol/Exchange
Company Name
Industry Group |
PRICE |
CHANGE
(%Change) |
Day High |
Volume
(% DAV)
(% 50 day avg vol) |
52 Wk Hi
% From Hi |
Featured
Date |
Price
Featured |
Pivot Featured |
|
Max Buy |
 MLR
-
NYSE
MLR
-
NYSE
Miller Industries Inc
AUTOMOTIVE - Auto Parts
|
$34.77
|
-0.13
-0.37% |
$35.23
|
79,262
190.53% of 50 DAV
50 DAV is 41,600
|
$38.18
-8.93%
|
9/24/2019
|
$34.00
|
PP = $35.36
|
|
MB = $37.13
|
 Most Recent Note - 1/15/2020 12:58:49 PM
G -Sputtering below its 50 DMA line ($36.37) and testing prior highs in the $35 area. Reported Sep '19 earnings which were below the fundamental guidelines of the fact-based investment system.
>>> FEATURED STOCK ARTICLE : Towing/Recovery Equipment Firm Remains Perched Near Record High - 12/27/2019 |
View all notes |
Set NEW NOTE alert |
Company Profile |
SEC
News |
Chart |
Request a new note
C
A
S
I |
CCBG
-
NASDAQ
Capital City Bk Gp
BANKING - Regional - Mid-Atlantic Banks
|
$28.65
|
-0.13
-0.45% |
$28.79
|
32,306
70.69% of 50 DAV
50 DAV is 45,700
|
$30.95
-7.43%
|
12/16/2019
|
$30.07
|
PP = $30.95
|
|
MB = $32.50
|
Most Recent Note - 1/14/2020 5:05:15 PM
G - Color code is changed to green while slumping below its 50 DMA line ($29.61) raising concerns after meeting resistance at its 52-week high. Prior low ($28.16 on 12/03/19) defines the next important support level.
>>> FEATURED STOCK ARTICLE : Perched Near 52-Week High After Forming an Orderly Base - 1/2/2020 |
View all notes |
Set NEW NOTE alert |
Company Profile |
SEC
News |
Chart |
Request a new note
C
A
S
I |
FTNT
-
NASDAQ
Fortinet Inc
Computer Sftwr-Security
|
$117.05
|
+0.33
0.28% |
$117.74
|
770,918
58.27% of 50 DAV
50 DAV is 1,323,000
|
$117.67
-0.53%
|
12/9/2019
|
$103.85
|
PP = $106.10
|
|
MB = $111.41
|
Most Recent Note - 1/14/2020 5:08:51 PM
G - Hit yet another new 52-week high with below average volume behind today's gain, wedging higher and getting very extended from any sound base. Its 50 DMA line ($104.75) defines important near-term support to watch. See the latest FSU analysis for more details and a new annotated graph.
>>> FEATURED STOCK ARTICLE : Extended From Base After Wedging Higher - 1/14/2020 |
View all notes |
Set NEW NOTE alert |
Company Profile |
SEC
News |
Chart |
Request a new note
C
A
S
I |
SPSC
-
NASDAQ
S P S Commerce Inc
COMPUTER SOFTWARE and SERVICES - Application Software
|
$57.78
|
+0.62
1.08% |
$58.24
|
108,175
62.46% of 50 DAV
50 DAV is 173,200
|
$59.14
-2.30%
|
11/29/2019
|
$56.59
|
PP = $59.24
|
|
MB = $62.20
|
Most Recent Note - 1/13/2020 6:31:39 PM
Y - Still perched only -3% off its all-time high. Subsequent gains above its pivot point backed by at least +40% above average volume are needed to trigger a new technical buy signal. Fundamentals remain strong. Its Relative Strength Rating of 81 is just above the 80+ minimum guideline for buy candidates. See the latest FSU analysis for more details and a new annotated graph.
>>> FEATURED STOCK ARTICLE : Still Lingering Below Prior Resistance - 1/13/2020 |
View all notes |
Set NEW NOTE alert |
Company Profile |
SEC
News |
Chart |
Request a new note
C
A
S
I |
AUDC
-
NASDAQ
Audiocodes Ltd
ELECTRONICS - Scientific and Technical Instrum
|
$27.12
|
-0.21
-0.77% |
$27.53
|
150,521
57.23% of 50 DAV
50 DAV is 263,000
|
$27.91
-2.83%
|
9/13/2019
|
$19.68
|
PP = $19.84
|
|
MB = $20.83
|
Most Recent Note - 1/13/2020 12:39:30 PM
G - Hitting a new all-time high with heavier volume behind today's 5th consecutive gain. Very extended from the previously noted base. Its 50 DMA line ($23.91) defines support above with prior highs in the $22 area. Fundamentals remain strong.
>>> FEATURED STOCK ARTICLE : Large Loss With Higher Volume Indicates Distributional Pressure - 1/6/2020 |
View all notes |
Set NEW NOTE alert |
Company Profile |
SEC
News |
Chart |
Request a new note
C
A
S
I |
Symbol/Exchange
Company Name
Industry Group |
PRICE |
CHANGE
(%Change) |
Day High |
Volume
(% DAV)
(% 50 day avg vol) |
52 Wk Hi
% From Hi |
Featured
Date |
Price
Featured |
Pivot Featured |
|
Max Buy |
CHDN
-
NASDAQ
Churchill Downs Inc
LEISURE - Gaming Activities
|
$140.69
|
+0.60
0.43% |
$143.22
|
233,604
96.53% of 50 DAV
50 DAV is 242,000
|
$141.00
-0.22%
|
10/8/2019
|
$129.77
|
PP = $132.83
|
|
MB = $139.47
|
Most Recent Note - 1/13/2020 6:25:11 PM
G - Rallied for a new 52-week high with today's gain backed by higher volume. Its 50 DMA line ($131) defines near-term support above the prior low ($121.81 on 11/07/19) The Jun and Sep '19 quarterly earnings versus the year ago periods were both below the +25% minimum guideline (C criteria) and raised fundamental concerns.
>>> FEATURED STOCK ARTICLE : Touched a New HIgh With Gains Backed by Light Volume - 12/30/2019 |
View all notes |
Set NEW NOTE alert |
Company Profile |
SEC
News |
Chart |
Request a new note
C
A
S
I |
LULU
-
NASDAQ
Lululemon Athletica
MANUFACTURING - Textile Manufacturing
|
$243.49
|
-0.28
-0.11% |
$246.04
|
981,141
47.17% of 50 DAV
50 DAV is 2,080,000
|
$247.51
-1.62%
|
9/6/2019
|
$201.25
|
PP = $194.35
|
|
MB = $204.07
|
Most Recent Note - 1/13/2020 12:56:03 PM
G - Powering to a new all-time high with today's gap up and big gain backed by heavier volume, getting more extended from any sound base. Its 50 DMA line and prior low ($218.18 on 12/12/19) define important near-term support to watch. Recently reported earnings +28% on +23% sales revenues for the Oct '19 quarter.
>>> FEATURED STOCK ARTICLE : Perched at All-Time High After Gains Lacking Great Volume - 1/9/2020 |
View all notes |
Set NEW NOTE alert |
Company Profile |
SEC
News |
Chart |
Request a new note
C
A
S
I |
CPRT
-
NASDAQ
Copart Inc
SPECIALTY RETAIL - Auto Dealerships
|
$96.67
|
+0.33
0.34% |
$97.16
|
1,205,447
65.23% of 50 DAV
50 DAV is 1,848,000
|
$97.04
-0.38%
|
1/2/2020
|
$92.80
|
PP = $92.51
|
|
MB = $97.14
|
Most Recent Note - 1/13/2020 6:34:04 PM
Y - Posted a 4th consecutive gain with light volume, wedging further into new all-time high territory. Its 50 DMA line ($88.40) defines near-term support. Fundamentals remain strong.
>>> FEATURED STOCK ARTICLE : Perched at All-Time HIgh Following Recent Volume-Driven Gain - 1/7/2020 |
View all notes |
Set NEW NOTE alert |
Company Profile |
SEC
News |
Chart |
Request a new note
C
A
S
I |
NMIH
-
NASDAQ
N M I Holdings Inc Cl A
Finance-MrtgandRel Svc
|
$32.78
|
+0.63
1.96% |
$32.79
|
459,876
87.76% of 50 DAV
50 DAV is 524,000
|
$35.79
-8.41%
|
11/8/2019
|
$32.89
|
PP = $31.44
|
|
MB = $33.01
|
Most Recent Note - 1/14/2020 5:11:33 PM
G - A rebound above the 50 DMA line ($32.89) still is needed for its outlook to improve. Prior highs in the $30-31 area define the next important near-term support. Fundamentals remain strong.
>>> FEATURED STOCK ARTICLE : Outlook Hurt by Slump Below 50-Day Moving Average - 1/10/2020 |
View all notes |
Set NEW NOTE alert |
Company Profile |
SEC
News |
Chart |
Request a new note
C
A
S
I |
SPLK
-
NASDAQ
Splunk Inc
Computer Sftwr-Database
|
$156.02
|
-1.02
-0.65% |
$158.37
|
1,446,790
71.84% of 50 DAV
50 DAV is 2,014,000
|
$158.70
-1.69%
|
11/25/2019
|
$147.79
|
PP = $142.16
|
|
MB = $149.27
|
Most Recent Note - 1/14/2020 5:07:16 PM
G - Hit yet another new high with today's 3rd consecutive small gain backed by below average volume, getting more extended from the previously noted base. Prior highs in the $142-143 area define important support to watch coinciding with its 50 DMA line ($141.79).
>>> FEATURED STOCK ARTICLE : New High Hit With Another Gain on Near Average Volume - 1/8/2020 |
View all notes |
Set NEW NOTE alert |
Company Profile |
SEC
News |
Chart |
Request a new note
C
A
S
I |
Symbol/Exchange
Company Name
Industry Group |
PRICE |
CHANGE
(%Change) |
Day High |
Volume
(% DAV)
(% 50 day avg vol) |
52 Wk Hi
% From Hi |
Featured
Date |
Price
Featured |
Pivot Featured |
|
Max Buy |
PAYC
-
NYSE
Paycom Software Inc
COMPUTER SOFTWARE and SERVICES - Application Software
|
$289.09
|
+2.58
0.90% |
$292.50
|
392,092
75.26% of 50 DAV
50 DAV is 521,000
|
$297.53
-2.84%
|
11/20/2019
|
$252.97
|
PP = $259.81
|
|
MB = $272.80
|
Most Recent Note - 1/13/2020 6:30:02 PM
G - Hit another new high with today's 9th consecutive gain, very extended from any sound base. Its 50 DMA line ($256) defines important near-term support to watch. Fundamentals remain strong.
>>> FEATURED STOCK ARTICLE : Perched Near High and Near the Max Buy Level - 1/3/2020 |
View all notes |
Set NEW NOTE alert |
Company Profile |
SEC
News |
Chart |
Request a new note
C
A
S
I |
BLD
-
NYSE
Topbuild Corp
Bldg-Constr Prds/Misc
|
$109.32
|
+3.80
3.60% |
$109.46
|
319,298
114.04% of 50 DAV
50 DAV is 280,000
|
$113.74
-3.89%
|
12/9/2019
|
$109.71
|
PP = $113.84
|
|
MB = $119.53
|
Most Recent Note - 1/15/2020 5:28:10 PM
Y - Color code is changed to yellow after today's 3rd consecutive gain helped it rebound above its 50 DMA line ($106.78) helping its outlook to improve.
>>> FEATURED STOCK ARTICLE : Recent Slump Below 50-Day Moving Average Did Technical Damage - 12/24/2019 |
View all notes |
Set NEW NOTE alert |
Company Profile |
SEC
News |
Chart |
Request a new note
C
A
S
I |
GLOB
-
NYSE
Globant SA
Computer-Tech Services
|
$116.66
|
+2.61
2.29% |
$118.84
|
299,207
111.64% of 50 DAV
50 DAV is 268,000
|
$115.60
0.92%
|
11/14/2019
|
$106.87
|
PP = $112.43
|
|
MB = $118.05
|
Most Recent Note - 1/15/2020 5:25:17 PM
Y - Posted a solid gain with +12% above average volume today for a new high. Gains above the pivot point backed by at least +40% above average volume are needed to trigger a proper technical buy signal. Its 50 DMA line ($104) defines important near-term support to watch on pullbacks. Fundamentals remain strong. See the latest FSU analysis for more details and a new annotated graph.
>>> FEATURED STOCK ARTICLE : Gain for New High Today Backed by Only +12% Above Average Volume - 1/15/2020 |
View all notes |
Set NEW NOTE alert |
Company Profile |
SEC
News |
Chart |
Request a new note
C
A
S
I |
|
|
|
THESE ARE NOT BUY RECOMMENDATIONS!
Comments contained in the body of this report are technical
opinions only. The material herein has been obtained
from sources believed to be reliable and accurate, however,
its accuracy and completeness cannot be guaranteed.
This site is not an investment advisor, hence it does
not endorse or recommend any securities or other investments.
Any recommendation contained in this report may not
be suitable for all investors and it is not to be deemed
an offer or solicitation on our part with respect to
the purchase or sale of any securities. All trademarks,
service marks and trade names appearing in this report
are the property of their respective owners, and are
likewise used for identification purposes only.
This report is a service available
only to active Paid Premium Members.
You may opt-out of receiving report notifications
at any time. Questions or comments may be submitted
by writing to Premium Membership Services 665 S.E. 10 Street, Suite 201 Deerfield Beach, FL 33441-5634 or by calling 1-800-965-8307
or 954-785-1121.
|
|
|