You are not logged in.
This means you
CAN ONLY VIEW reports that were published prior to Friday, February 23, 2024.
You
MUST UPGRADE YOUR MEMBERSHIP if you want to see any current reports.
AFTER MARKET UPDATE - TUESDAY, JANUARY 15TH, 2019
Previous After Market Report Next After Market Report >>>
|
|
|
|
DOW |
+155.75 |
24,065.59 |
+0.65% |
|
Volume |
870,105,360 |
-2% |
|
Volume |
2,032,556,369 |
+6% |
|
NASDAQ |
+117.91 |
7,023.83 |
+1.71% |
|
Advancers |
1,891 |
64% |
|
Advancers |
2,092 |
68% |
|
S&P 500 |
+27.69 |
2,610.30 |
+1.07% |
|
Decliners |
1,070 |
36% |
|
Decliners |
976 |
32% |
|
Russell 2000 |
+12.40 |
1,445.22 |
+0.87% |
|
52 Wk Highs |
13 |
|
|
52 Wk Highs |
26 |
|
|
S&P 600 |
+5.71 |
899.77 |
+0.64% |
|
52 Wk Lows |
12 |
|
|
52 Wk Lows |
19 |
|
|
 |
Breadth Positive as Major Indices Rose
Kenneth J. Gruneisen - Passed the CAN SLIM® Master's Exam
Stocks finished higher Tuesday. The Dow added 155 points to 24,065 while the S&P 500 climbed 27 points to 2,610. The Nasdaq Composite gained 117 points to 7,023. The volume totals were mixed, lighter than the prior session on the NYSE and higher on the Nasdaq exchange. Breadth was positive as advancers led decliners by almost a 2-1 margin on the NYSE and by more than 2-1 on the Nasdaq exchange. There were only 3 high-ranked companies from the Leaders List that made a new 52-week high and were listed on the BreakOuts Page, matching the prior session total. New 52-week highs outnumbered new 52-week lows on the NYSE and on the Nasdaq exchange versus the prior session. The major indices are in a confirmed uptrend after recently noted improvements helped to signal a change in market direction (M criteria) back to a bullish stance. The Featured Stocks Page provides the most timely analysis on high-ranked leaders. Charts used courtesy of www.stockcharts.com
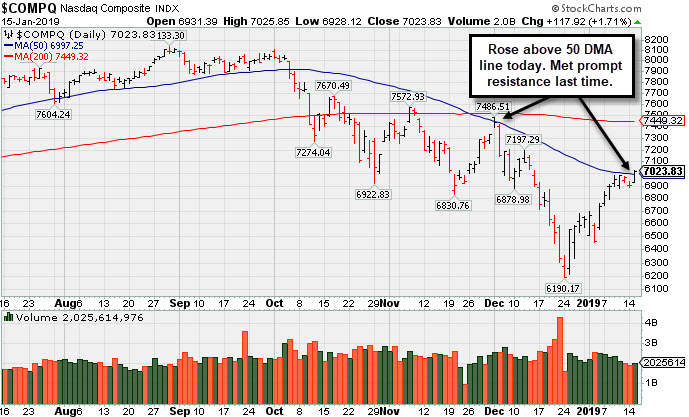
PICTURED: The Nasdaq Composite Index rose and finished above its 50-day moving average (DMA) line on Tuesday. Previously it met prompt resistance at that important short-term average.
The major averages snapped a two-day losing streak amid broad strength in the Tech and Healthcare sectors. News that China’s central bank will boost efforts to foster economic growth also lifted investor sentiment. On the data front, an update on inflation revealed the Producer Price Index (PPI) decreased 0.2% in December. Core PPI, which excludes food and energy, showed wholesale prices rose 2.7% from the same period last year. In a separate release, manufacturing in the New York Fed region expanded at the slowest pace since 2017 in January.
Nine of 11 S&P 500 sectors finished higher. The Communication Services group paced gains with Netflix (NFLX +6.52%) rose after the streaming giant announced its largest ever monthly service charge increase. Health Care also outperformed with shares of UnitedHealth (UNH +3.54%) rose after topping profit and revenue expectations. Technology stocks were also broadly higher with Microsoft (MSFT +2.90%) rose. In other earnings news, JPMorgan Chase & Co (JPM +0.73%) edged higher despite missing profit expectations for the first time in 15 quarters.
Treasuries were mixed with the yield of the benchmark 10-year note advancing one basis point to 2.71%. In commodities, WTI crude added 3.2% to $52.11/barrel. COMEX gold was down 0.2% to $1,288.90/ounce amid a stronger dollar. |
 Kenneth J. Gruneisen started out as a licensed stockbroker in August 1987, a couple of months prior to the historic stock market crash that took the Dow Jones Industrial Average down -22.6% in a single day. He has published daily fact-based fundamental and technical analysis on high-ranked stocks online for two decades. Through FACTBASEDINVESTING.COM, Kenneth provides educational articles, news, market commentary, and other information regarding proven investment systems that work in good times and bad.
Comments contained in the body of this report are technical opinions only and are not necessarily those of Gruneisen Growth Corp. The material herein has been obtained from sources believed to be reliable and accurate, however, its accuracy and completeness cannot be guaranteed. Our firm, employees, and customers may effect transactions, including transactions contrary to any recommendation herein, or have positions in the securities mentioned herein or options with respect thereto. Any recommendation contained in this report may not be suitable for all investors and it is not to be deemed an offer or solicitation on our part with respect to the purchase or sale of any securities. |
|
 |
Retail, Financial, and Tech Indexes Rose
Kenneth J. Gruneisen - Passed the CAN SLIM® Master's Exam
The Retail Index ($RLX +1.45%), Bank Index ($BKX +1.01%), and the Broker/Dealer Index ($XBD +0.65%) rose. The Biotech Index ($BTK +2.46%) led the tech sector while the Networking Index ($NWX +1.45%) followed and the Semiconductor Index ($SOX +0.23%) posted a smaller gain. Energy-linked groups had a slightly positive tilt as the Oil Services Index ($OSX +0.40%) and the Integrated Oil Index ($XOI +0.27%) both edged higher. Meanwhile, the Gold & Silver Index ($XAU -2.50%) lost ground.
Charts courtesy of www.stockcharts.com
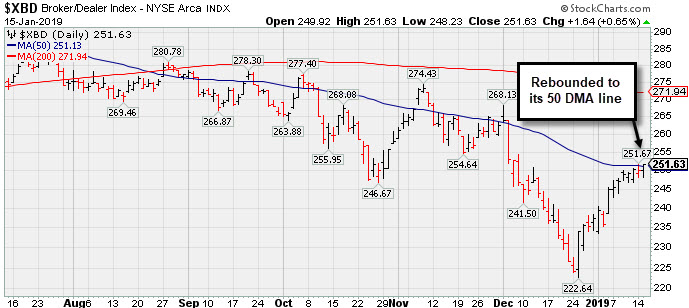 PICTURED: The Broker/Dealer Index ($XBD +0.65%) has rebounded to its 50-day moving average (DMA) line.
| Oil Services |
$OSX |
94.66 |
+0.38 |
+0.40% |
+17.44% |
| Integrated Oil |
$XOI |
1,249.82 |
+3.41 |
+0.27% |
+7.83% |
| Semiconductor |
$SOX |
1,197.03 |
+2.75 |
+0.23% |
+3.62% |
| Networking |
$NWX |
517.19 |
+7.41 |
+1.45% |
+5.84% |
| Broker/Dealer |
$XBD |
251.63 |
+1.64 |
+0.65% |
+6.02% |
| Retail |
$RLX |
2,086.20 |
+29.82 |
+1.45% |
+6.91% |
| Gold & Silver |
$XAU |
69.37 |
-1.78 |
-2.50% |
-1.83% |
| Bank |
$BKX |
92.56 |
+0.93 |
+1.01% |
+7.89% |
| Biotech |
$BTK |
4,803.73 |
+115.21 |
+2.46% |
+13.81% |
|
|
|
 |
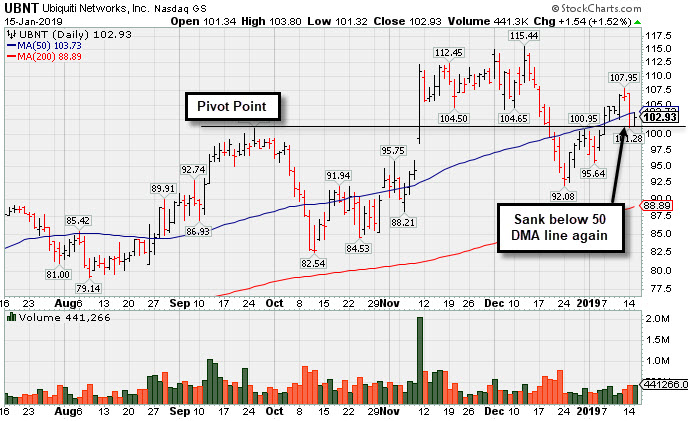
Sputtering Below 50-Day Moving Average Again
Kenneth J. Gruneisen - Passed the CAN SLIM® Master's Exam
Ubiquiti Networks Inc (UBNT +$1.54 or 1.52% to $102.93) posted a small gain. It slumped back below its 50-day moving average (DMA) line ($103.78) on the prior session hurting its outlook. A prompt rebound is needed for its outlook to improve, Meanwhile, the prior low ($92.08 on 12/24/18) defines the next important support. It was last shown in this FSU section on 1/02/19 with an annotated graph under the headline, "Needs Rebound Above 50-Day Average to Help Outlook". It quickly got extended more than +5% above the prior high and finished strong after highlighted in yellow in the 11/09/18 mid-day report with new pivot point cited based on its 9/25/18 high plus 10 cents (read here). The big gain for a new high with nearly 4 times average volume triggered a technical buy signal. Fundamentals remain strong. Bullish action came after it reported earnings +27% on +15% sales revenues for the Sep '18 quarter, marking its 3rd consecutive quarterly comparison above the +25% minimum earnings guideline (C criteria), helping it better match the fact-based investment system's fundamental guidelines. The number of top-rated funds owning its shares rose from 262 in Dec '17 to 295 in Dec '18, a reassuring sign concerning the I criteria. Its current Up/Down Volume ratio of 1.2 is an unbiased indication its shares have been under slight accumulation over the past 50 days. Its small supply of only 14.9 million shares (S criteria) in the public float can contribute to greater price volatility in the event of institutional buying or selling. It has earned an A Timeliness Rating and B Sponsorship Rating. It hails from the Telecom - Infrastructure Industry Group which has an A- Group Relative Strength Rating, a reassuring sign concerning the L criteria. After a small downturn in FY '15 its annual earnings (A criteria) growth has been strong. That fundamental shortcoming had a role in limiting its appearances since UBNT was shown in this FSU section on 4/20/12 with an annotated graph under the headline, "Formed a New Ascending Base But Did Not Confirm New Buy Signal".
Chart courtesy of www.stockcharts.com
 |
|
|
Color Codes Explained :
Y - Better candidates highlighted by our
staff of experts.
G - Previously featured
in past reports as yellow but may no longer be buyable under the
guidelines.
***Last / Change / Volume data in this table is the closing quote data***
Symbol/Exchange
Company Name
Industry Group |
PRICE |
CHANGE
(%Change) |
Day High |
Volume
(% DAV)
(% 50 day avg vol) |
52 Wk Hi
% From Hi |
Featured
Date |
Price
Featured |
Pivot Featured |
|
Max Buy |
MLR
-
NYSE
Miller Industries Inc
AUTOMOTIVE - Auto Parts
|
$28.29
|
+0.59
2.13% |
$28.36
|
23,667
62.28% of 50 DAV
50 DAV is 38,000
|
$29.40
-3.78%
|
11/30/2018
|
$28.35
|
PP = $29.50
|
|
MB = $30.98
|
 Most Recent Note - 1/15/2019 3:53:01 PM
Y - Volume totals have still been cooling while perched within close striking distance of prior highs. Little resistance remains due to overhead supply up to the $29 level. Its 50 DMA line and recent low define near-term support to watch on pullbacks.
>>> FEATURED STOCK ARTICLE : Perched Within Close Striking Distance of Prior High - 1/8/2019 |
View all notes |
Set NEW NOTE alert |
Company Profile |
SEC
News |
Chart |
Request a new note
C
A
S
I |
UBNT
-
NASDAQ
Ubiquiti Networks
TELECOMMUNICATIONS - Diversified Communication Serv
|
$102.93
|
+1.54
1.52% |
$103.80
|
441,294
102.39% of 50 DAV
50 DAV is 431,000
|
$115.44
-10.84%
|
11/9/2018
|
$108.20
|
PP = $101.43
|
|
MB = $106.50
|
Most Recent Note - 1/15/2019 5:10:15 PM
G - Posted a small gain today. Color code was changed to green after slumping back below its 50 DMA line ($103.78) on the prior session hurting its outlook. Prior low ($92.08 on 12/24/18) defines the next important support. Fundamentals remain strong. See the latest FSU analysis for more details and a new annotated graph.
>>> FEATURED STOCK ARTICLE : Sputtering Below 50-Day Moving Average Again - 1/15/2019 |
View all notes |
Set NEW NOTE alert |
Company Profile |
SEC
News |
Chart |
Request a new note
C
A
S
I |
PLNT
-
NYSE
Planet Fitness Inc Cl A
Leisure-Services
|
$58.00
|
+0.78
1.36% |
$58.56
|
853,522
64.61% of 50 DAV
50 DAV is 1,321,000
|
$59.23
-2.08%
|
11/7/2018
|
$57.10
|
PP = $55.45
|
|
MB = $58.22
|
Most Recent Note - 1/14/2019 5:02:38 PM
Y - Pulled back below its "max buy" level today and its color code is changed to yellow. Its 50 DMA line ($53.57) defines important near-term support to watch above the recent low ($48).
>>> FEATURED STOCK ARTICLE : Found Prompt Support Near 50-Day Moving Average Line - 1/4/2019 |
View all notes |
Set NEW NOTE alert |
Company Profile |
SEC
News |
Chart |
Request a new note
C
A
S
I |
TEAM
-
NASDAQ
Atlassian Corp Plc Cl A
Comp Sftwr-Spec Enterprs
|
$95.38
|
+1.67
1.78% |
$95.41
|
1,786,825
122.05% of 50 DAV
50 DAV is 1,464,000
|
$98.21
-2.88%
|
1/7/2019
|
$94.68
|
PP = $98.31
|
|
MB = $103.23
|
Most Recent Note - 1/15/2019 12:45:24 PM
Y - Managed a "positive reversal" after early weakness today. Stubbornly holding its ground perched within close striking distance of its prior high. Due to report earnings news after market close on Thursday, January 17, 2019. Color code was changed to yellow with new pivot point cited based on its 10/01/18 high plus 10 cents. Subsequent gains above the pivot point backed by at least +40% above average volume may trigger a technical buy signal. Fundamentals remain strong. Found support at its 200 DMA line during its consolidation in recent months.
>>> FEATURED STOCK ARTICLE : Rebounding Near Prior High Which May Act as Resistance - 1/7/2019 |
View all notes |
Set NEW NOTE alert |
Company Profile |
SEC
News |
Chart |
Request a new note
C
A
S
I |
INVA
-
NASDAQ
Innoviva Inc
Medical-Biomed/Biotech
|
$19.23
|
+0.07
0.37% |
$19.44
|
505,548
41.78% of 50 DAV
50 DAV is 1,210,000
|
$19.82
-2.98%
|
11/23/2018
|
$17.74
|
PP = $18.09
|
|
MB = $18.99
|
Most Recent Note - 1/15/2019 3:52:14 PM
G - Holding its ground perched near its 52-week high after a streak of gains with volume totals cooling. The 50 DMA line ($17.19) and prior low ($15.55 on 12/24/18) define near-term support.
>>> FEATURED STOCK ARTICLE : Consolidating Above 50-Day Average Line Near High - 1/3/2019 |
View all notes |
Set NEW NOTE alert |
Company Profile |
SEC
News |
Chart |
Request a new note
C
A
S
I |
Symbol/Exchange
Company Name
Industry Group |
PRICE |
CHANGE
(%Change) |
Day High |
Volume
(% DAV)
(% 50 day avg vol) |
52 Wk Hi
% From Hi |
Featured
Date |
Price
Featured |
Pivot Featured |
|
Max Buy |
|
|
|
THESE ARE NOT BUY RECOMMENDATIONS!
Comments contained in the body of this report are technical
opinions only. The material herein has been obtained
from sources believed to be reliable and accurate, however,
its accuracy and completeness cannot be guaranteed.
This site is not an investment advisor, hence it does
not endorse or recommend any securities or other investments.
Any recommendation contained in this report may not
be suitable for all investors and it is not to be deemed
an offer or solicitation on our part with respect to
the purchase or sale of any securities. All trademarks,
service marks and trade names appearing in this report
are the property of their respective owners, and are
likewise used for identification purposes only.
This report is a service available
only to active Paid Premium Members.
You may opt-out of receiving report notifications
at any time. Questions or comments may be submitted
by writing to Premium Membership Services 665 S.E. 10 Street, Suite 201 Deerfield Beach, FL 33441-5634 or by calling 1-800-965-8307
or 954-785-1121.
|
|
|

