You are not logged in.
This means you
CAN ONLY VIEW reports that were published prior to Monday, February 19, 2024.
You
MUST UPGRADE YOUR MEMBERSHIP if you want to see any current reports.
AFTER MARKET UPDATE - MONDAY, JANUARY 14TH, 2019
Previous After Market Report Next After Market Report >>>
|
|
|
|
DOW |
-86.11 |
23,909.84 |
-0.36% |
|
Volume |
892,243,340 |
+11% |
|
Volume |
1,924,891,327 |
-7% |
|
NASDAQ |
-65.56 |
6,905.92 |
-0.94% |
|
Advancers |
1,104 |
37% |
|
Advancers |
965 |
31% |
|
S&P 500 |
-13.65 |
2,582.61 |
-0.53% |
|
Decliners |
1,873 |
63% |
|
Decliners |
2,100 |
68% |
|
Russell 2000 |
-14.57 |
1,432.81 |
-1.01% |
|
52 Wk Highs |
14 |
|
|
52 Wk Highs |
22 |
|
|
S&P 600 |
-7.97 |
894.06 |
-0.88% |
|
52 Wk Lows |
22 |
|
|
52 Wk Lows |
21 |
|
|
 |
Major Indices Sputter as Leadership Remains Thin
Kenneth J. Gruneisen - Passed the CAN SLIM® Master's Exam
Stocks finished lower Monday. The Dow fell 86 points to 23,909. The S&P 500 slipped 13 points to 2,582 while the Nasdaq Composite was off 65 points to 6,905. The volume totals were mixed, higher than the prior session on the NYSE and lower on the Nasdaq exchange. Decliners led advancers by a 3-2 margin on the NYSE and 2-1 on the Nasdaq exchange. There were 3 high-ranked companies from the Leaders List that made a new 52-week high and were listed on the BreakOuts Page, versus 4 on the prior session total. New 52-week lows outnumbered new 52-week highs on the NYSE while new highs barely outnumbered new lows on the Nasdaq exchange versus the prior session. The major indices are in a confirmed uptrend after recently noted improvements helped to signal a change in market direction (M criteria) back to a bullish stance. The Featured Stocks Page provides the most timely analysis on high-ranked leaders. Charts used courtesy of www.stockcharts.com
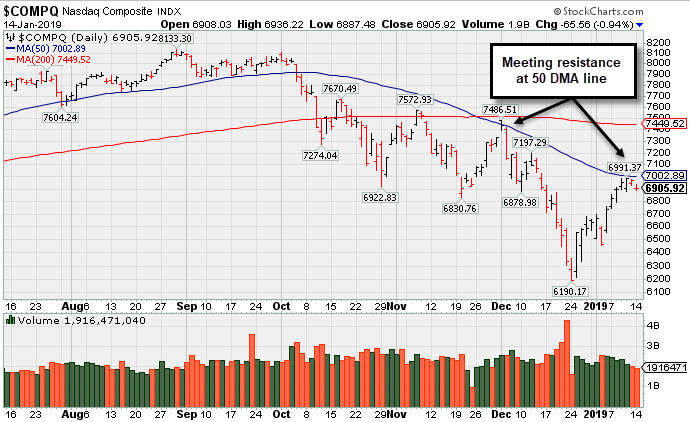
PICTURED: The Nasdaq Composite Index has rebounded near its 50-day moving average (DMA) line which previously acted as resistance.
The major averages declined in back-to-back sessions for the first time in 2019 amid renewed fears of slowing global economic growth. Overnight, an update out of China revealed exports unexpectedly fell 4.4% from the same time last year in December, well below expectations of a 2.5% increase. Corporate announcements will garner an outsized focus this week as this morning marked the “unofficial” start of fourth quarter earnings season. There were no notable data releases today as the economic calendar remains light, due to the lingering partial government shutdown.
Ten of 11 S&P 500 sectors finished in negative territory. Utilities were the laggard as PG&E (PCG -52.36%) was slammed after announcing plans to file for bankruptcy protection. Technology shares also underperformed as Apple (AAPL -1.50%) fell. Financials bucked the downtrend as Citigroup (C +3.95%) rose after topping analyst earnings estimates. In other earnings news, shares of Lulu Lemon (LULU +5.73%) rose after the woman’s athletic apparel maker topped analyst profit projections and raised its forward guidance.
Treasuries finished mixed as the yield on the 10-year note advanced one basis point to 2.70%. In commodities, WTI crude slipped 1.8% to $50.65/barrel. COMEX gold added 0.2% to $1291.80/ounce. |
 Kenneth J. Gruneisen started out as a licensed stockbroker in August 1987, a couple of months prior to the historic stock market crash that took the Dow Jones Industrial Average down -22.6% in a single day. He has published daily fact-based fundamental and technical analysis on high-ranked stocks online for two decades. Through FACTBASEDINVESTING.COM, Kenneth provides educational articles, news, market commentary, and other information regarding proven investment systems that work in good times and bad.
Comments contained in the body of this report are technical opinions only and are not necessarily those of Gruneisen Growth Corp. The material herein has been obtained from sources believed to be reliable and accurate, however, its accuracy and completeness cannot be guaranteed. Our firm, employees, and customers may effect transactions, including transactions contrary to any recommendation herein, or have positions in the securities mentioned herein or options with respect thereto. Any recommendation contained in this report may not be suitable for all investors and it is not to be deemed an offer or solicitation on our part with respect to the purchase or sale of any securities. |
|
 |
Bank Index Rose and Tech Sector Slumped
Kenneth J. Gruneisen - Passed the CAN SLIM® Master's Exam
The Bank Index ($BKX +1.19%) rose while the Broker/Dealer Index ($XBD -0.14%) edged lower. The Retail Index ($RLX -0.83%) slumped. The Semiconductor Index ($SOX -1.55%) and Biotech Index ($BTK -1.57%) led the tech sector lower while the Networking Index ($NWX -0.90%) suffered a smaller loss. The Gold & Silver Index ($XAU -0.77%) also lost ground. Energy-linked groups were little changed as the Oil Services Index ($OSX +0.11%) inched higher and the Integrated Oil Index ($XOI -0.19%) fell slightly.
Charts courtesy of www.stockcharts.com
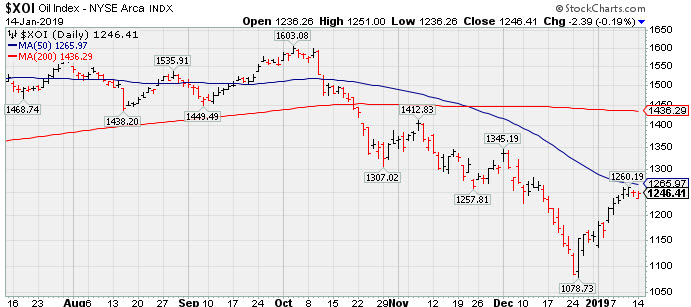 PICTURED: The Integrated Oil Index ($XOI -0.19%) remains below its 50-day moving average (DMA) line.
| Oil Services |
$OSX |
94.28 |
+0.10 |
+0.11% |
+16.97% |
| Integrated Oil |
$XOI |
1,246.41 |
-2.39 |
-0.19% |
+7.53% |
| Semiconductor |
$SOX |
1,194.28 |
-18.76 |
-1.55% |
+3.39% |
| Networking |
$NWX |
509.78 |
-4.62 |
-0.90% |
+4.32% |
| Broker/Dealer |
$XBD |
249.99 |
-0.36 |
-0.14% |
+5.33% |
| Retail |
$RLX |
2,056.38 |
-17.18 |
-0.83% |
+5.38% |
| Gold & Silver |
$XAU |
71.15 |
-0.56 |
-0.78% |
+0.69% |
| Bank |
$BKX |
91.63 |
+1.08 |
+1.19% |
+6.81% |
| Biotech |
$BTK |
4,688.52 |
-74.66 |
-1.57% |
+11.08% |
|
|
|
 |
|
|
|
Color Codes Explained :
Y - Better candidates highlighted by our
staff of experts.
G - Previously featured
in past reports as yellow but may no longer be buyable under the
guidelines.
***Last / Change / Volume data in this table is the closing quote data***
Symbol/Exchange
Company Name
Industry Group |
PRICE |
CHANGE
(%Change) |
Day High |
Volume
(% DAV)
(% 50 day avg vol) |
52 Wk Hi
% From Hi |
Featured
Date |
Price
Featured |
Pivot Featured |
|
Max Buy |
MLR
-
NYSE
Miller Industries Inc
AUTOMOTIVE - Auto Parts
|
$27.70
|
-0.41
-1.46% |
$28.59
|
18,766
49.38% of 50 DAV
50 DAV is 38,000
|
$29.40
-5.78%
|
11/30/2018
|
$28.35
|
PP = $29.50
|
|
MB = $30.98
|
Most Recent Note - 1/11/2019 5:10:22 PM
Y - Volume totals have been cooling while holding its ground perched within close striking distance of prior highs. Little resistance remains due to overhead supply up to the $29 level. Its 50 DMA line and recent low define near-term support to watch on pullbacks.
>>> FEATURED STOCK ARTICLE : Perched Within Close Striking Distance of Prior High - 1/8/2019 |
View all notes |
Set NEW NOTE alert |
Company Profile |
SEC
News |
Chart |
Request a new note
C
A
S
I |
UBNT
-
NASDAQ
Ubiquiti Networks
TELECOMMUNICATIONS - Diversified Communication Serv
|
$101.39
|
-5.10
-4.79% |
$106.98
|
426,415
98.03% of 50 DAV
50 DAV is 435,000
|
$115.44
-12.17%
|
11/9/2018
|
$108.20
|
PP = $101.43
|
|
MB = $106.50
|
 Most Recent Note - 1/14/2019 5:00:32 PM
G - Color code is changed to green after slumping back below its 50 DMA line ($103.58) hurting its outlook. Prior low ($92.08 on 12/24/18) defines the next important support. Fundamentals remain strong.
>>> FEATURED STOCK ARTICLE : Needs Rebound Above 50-Day Average to Help Outlook - 1/2/2019 |
View all notes |
Set NEW NOTE alert |
Company Profile |
SEC
News |
Chart |
Request a new note
C
A
S
I |
PLNT
-
NYSE
Planet Fitness Inc Cl A
Leisure-Services
|
$57.22
|
-1.58
-2.69% |
$58.56
|
1,258,071
95.09% of 50 DAV
50 DAV is 1,323,000
|
$59.23
-3.39%
|
11/7/2018
|
$57.10
|
PP = $55.45
|
|
MB = $58.22
|
Most Recent Note - 1/14/2019 5:02:38 PM
Y - Pulled back below its "max buy" level today and its color code is changed to yellow. Its 50 DMA line ($53.57) defines important near-term support to watch above the recent low ($48).
>>> FEATURED STOCK ARTICLE : Found Prompt Support Near 50-Day Moving Average Line - 1/4/2019 |
View all notes |
Set NEW NOTE alert |
Company Profile |
SEC
News |
Chart |
Request a new note
C
A
S
I |
TEAM
-
NASDAQ
Atlassian Corp Plc Cl A
Comp Sftwr-Spec Enterprs
|
$93.71
|
-1.94
-2.03% |
$94.72
|
2,247,616
152.17% of 50 DAV
50 DAV is 1,477,000
|
$98.21
-4.58%
|
1/7/2019
|
$94.68
|
PP = $98.31
|
|
MB = $103.23
|
Most Recent Note - 1/14/2019 12:41:23 PM
Y - Volume totals have been cooling while stubbornly holding its ground perched within close striking distance of its prior high. Due to report earnings news after market close on Thursday, January 17, 2019. Color code was changed to yellow with new pivot point cited based on its 10/01/18 high plus 10 cents. Subsequent gains above the pivot point backed by at least +40% above average volume may trigger a technical buy signal. Fundamentals remain strong. It found support at its 200 DMA line during the consolidation after dropped from the Featured Stocks list on 10/10/18.
>>> FEATURED STOCK ARTICLE : Rebounding Near Prior High Which May Act as Resistance - 1/7/2019 |
View all notes |
Set NEW NOTE alert |
Company Profile |
SEC
News |
Chart |
Request a new note
C
A
S
I |
INVA
-
NASDAQ
Innoviva Inc
Medical-Biomed/Biotech
|
$19.16
|
-0.23
-1.19% |
$19.54
|
980,858
80.66% of 50 DAV
50 DAV is 1,216,000
|
$19.82
-3.33%
|
11/23/2018
|
$17.74
|
PP = $18.09
|
|
MB = $18.99
|
Most Recent Note - 1/11/2019 5:08:15 PM
G - Hit another a new high with today's 6th consecutive gain. After rising above its "max buy" level its color code was changed to green. Its 1/09/19 gain had volume +66% above average helping clinch a technical buy signal. The 50 DMA line ($17) and prior low ($15.55 on 12/24/18) define near-term support.
>>> FEATURED STOCK ARTICLE : Consolidating Above 50-Day Average Line Near High - 1/3/2019 |
View all notes |
Set NEW NOTE alert |
Company Profile |
SEC
News |
Chart |
Request a new note
C
A
S
I |
Symbol/Exchange
Company Name
Industry Group |
PRICE |
CHANGE
(%Change) |
Day High |
Volume
(% DAV)
(% 50 day avg vol) |
52 Wk Hi
% From Hi |
Featured
Date |
Price
Featured |
Pivot Featured |
|
Max Buy |
|
|
|
THESE ARE NOT BUY RECOMMENDATIONS!
Comments contained in the body of this report are technical
opinions only. The material herein has been obtained
from sources believed to be reliable and accurate, however,
its accuracy and completeness cannot be guaranteed.
This site is not an investment advisor, hence it does
not endorse or recommend any securities or other investments.
Any recommendation contained in this report may not
be suitable for all investors and it is not to be deemed
an offer or solicitation on our part with respect to
the purchase or sale of any securities. All trademarks,
service marks and trade names appearing in this report
are the property of their respective owners, and are
likewise used for identification purposes only.
This report is a service available
only to active Paid Premium Members.
You may opt-out of receiving report notifications
at any time. Questions or comments may be submitted
by writing to Premium Membership Services 665 S.E. 10 Street, Suite 201 Deerfield Beach, FL 33441-5634 or by calling 1-800-965-8307
or 954-785-1121.
|
|
|

