You are not logged in.
This means you
CAN ONLY VIEW reports that were published prior to Saturday, February 24, 2024.
You
MUST UPGRADE YOUR MEMBERSHIP if you want to see any current reports.
AFTER MARKET UPDATE - MONDAY, JANUARY 13TH, 2020
Previous After Market Report Next After Market Report >>>
|
|
|
|
DOW |
+83.28 |
28,907.05 |
+0.29% |
|
Volume |
834,400,950 |
+7% |
|
Volume |
2,524,190,720 |
+6% |
|
NASDAQ |
+95.07 |
9,273.93 |
+1.04% |
|
Advancers |
2,004 |
70% |
|
Advancers |
2,030 |
64% |
|
S&P 500 |
+22.78 |
3,288.13 |
+0.70% |
|
Decliners |
842 |
30% |
|
Decliners |
1,165 |
36% |
|
Russell 2000 |
+11.96 |
1,669.61 |
+0.72% |
|
52 Wk Highs |
243 |
|
|
52 Wk Highs |
279 |
|
|
S&P 600 |
+9.49 |
1,020.33 |
+0.94% |
|
52 Wk Lows |
23 |
|
|
52 Wk Lows |
34 |
|
|
 |
Major Indices Rose With Greater Leadership and More Volume
Kenneth J. Gruneisen - Passed the CAN SLIM® Master's Exam
The S&P 500 added 0.7%, while the Nasdaq Composite was up 1%, with both benchmark indexes closing at fresh all-time highs. The Dow rose 83 points. Breadth was positive as advancers led decliners by more than a 2-1 margin on the NYSE and nearly 2-1 on the Nasdaq exchange. The reported volume totals were higher than the prior session totals on the NYSE and on the Nasdaq exchange, indicative of greater institutional buying demand. There were 91 high-ranked companies from the Leaders List that hit a new 52-week high and were listed on the BreakOuts Page, versus the total of 69 on the prior session. New 52-week highs totals expanded and easily outnumbered new 52-week lows totals on the NYSE and on the Nasdaq exchange. The major indices (M criteria) are in a "confirmed uptrend" after enduring distributional pressure in recent weeks. The Featured Stocks Page provides the most timely analysis on high-ranked leaders. Charts used courtesy of www.stockcharts.com
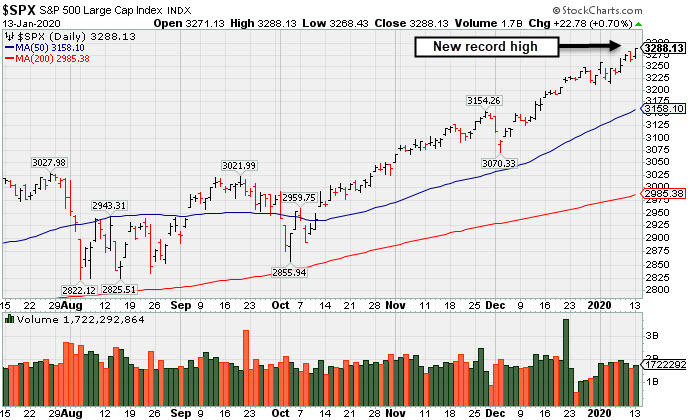
PICTURED: The S&P 500 Index hit a new record high
Stocks finished higher on Monday amid U.S.-China trade optimism. The highly anticipated “phase one” accord is expected to be signed in Washington on January 15th. The White House further lifted sentiment by announcing plans to remove the label of “currency manipulator” for China ahead of Wednesday’s meeting.
Ten of 11 S&P 500 sectors closed in positive territory with Technology shares pacing gains, jumping more than 1.3%. Meanwhile, the Health Care group was the sole laggard. In corporate news, Lululemon (LULU +4.40%) rose following a boost to its profit and sales outlook. Five Below (FIVE -11.36%) fell after slashing its revenue guidance. Tesla (TSLA +9.77%) rallied on news that China would not significantly reduce subsidies for new energy vehicles this year.
Fourth-quarter earnings season officially kicks off on Tuesday, with some of Wall Street’s biggest banks headlining the docket. Analysts are projecting a 1.6% decline in S&P 500 profits during the final quarter of 2019, compared to a year ago, according to Bloomberg.
Treasuries declined, with the yield on the 10-year note up two basis points to 1.84%. On the data front, the lone update was the U.S. monthly budget statement, which showed the deficit unexpectedly narrowed in December compared to a year ago. In commodities, WTI crude slipped 1.6% to $58.08/barrel, its lowest level since early December as tensions between the U.S. and Iran seemed to have abated. COMEX gold fell 0.7% to $1,549.90/ounce.
|
 Kenneth J. Gruneisen started out as a licensed stockbroker in August 1987, a couple of months prior to the historic stock market crash that took the Dow Jones Industrial Average down -22.6% in a single day. He has published daily fact-based fundamental and technical analysis on high-ranked stocks online for two decades. Through FACTBASEDINVESTING.COM, Kenneth provides educational articles, news, market commentary, and other information regarding proven investment systems that work in good times and bad.
Comments contained in the body of this report are technical opinions only and are not necessarily those of Gruneisen Growth Corp. The material herein has been obtained from sources believed to be reliable and accurate, however, its accuracy and completeness cannot be guaranteed. Our firm, employees, and customers may effect transactions, including transactions contrary to any recommendation herein, or have positions in the securities mentioned herein or options with respect thereto. Any recommendation contained in this report may not be suitable for all investors and it is not to be deemed an offer or solicitation on our part with respect to the purchase or sale of any securities. |
|
 |
Financial, Semiconductor, and Networking Indexes Rose
Kenneth J. Gruneisen - Passed the CAN SLIM® Master's Exam
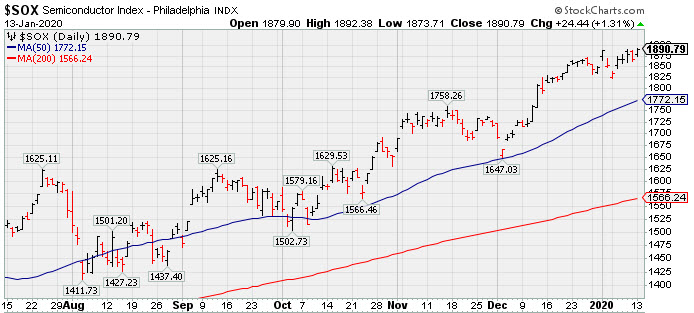
The Biotech Index ($BTK -2.03%) slumped while the Semiconductor Index ($SOX +1.31%) and the Networking Index ($NWX +1.55%) both posted solid gains. Financial shares had a positive bias as the Broker/Dealer Index ($XBD 1.19%) and the Bank Index ($BKX +0.62%) both posted gains. The Retail Index ($RLX +0.14%) was little changed. The Oil Services Index ($OSX -0.83%) and the Integrated Oil Index ($XOI -0.11%) posted modest losses while the Gold & Silver Index ($XAU -2.01%) was a standout decliner.
PICTURED: The Semiconductor Index ($SOX +1.31%) is perched at its all-time high after another solid gain
| Oil Services |
$OSX |
76.50 |
-0.64 |
-0.83% |
-2.29% |
| Integrated Oil |
$XOI |
1,271.90 |
-1.39 |
-0.11% |
+0.11% |
| Semiconductor |
$SOX |
1,890.79 |
+24.44 |
+1.31% |
+2.23% |
| Networking |
$NWX |
587.34 |
+8.99 |
+1.55% |
+0.67% |
| Broker/Dealer |
$XBD |
297.94 |
+3.51 |
+1.19% |
+2.60% |
| Retail |
$RLX |
2,482.70 |
+3.52 |
+0.14% |
+1.36% |
| Gold & Silver |
$XAU |
100.19 |
-2.06 |
-2.01% |
-6.29% |
| Bank |
$BKX |
111.82 |
+0.68 |
+0.61% |
-1.36% |
| Biotech |
$BTK |
5,095.04 |
-105.69 |
-2.03% |
+0.54% |
|
|
|
 |
Still Lingering Below Prior Resistance
Kenneth J. Gruneisen - Passed the CAN SLIM® Master's Exam
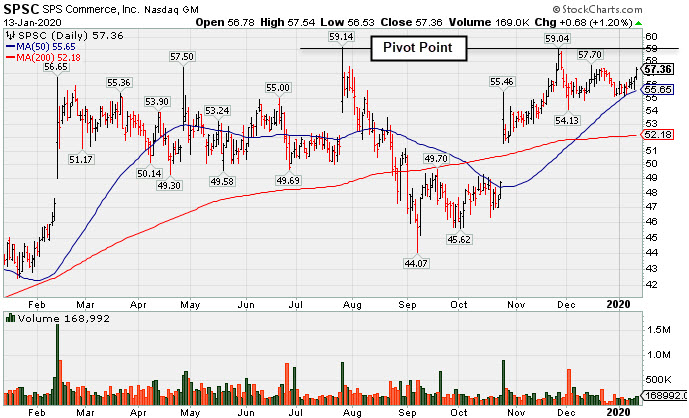
S P S Commerce Inc (SPSC +$0.68 or +1.20% to $57.36) is perched only -3% off its all-time high. Subsequent gains above its pivot point backed by at least +40% above average volume are needed to trigger a new technical buy signal. Fundamentals remain strong, however, its Relative Strength Rating of 81 is just above the 80+ minimum guideline for buy candidates.
The high-ranked Computer Software firm was highlighted in yellow with new pivot point cited based on its 7/26/19 high plus 10 cents in the 11/29/19 mid-day report (read here). It was last shown in this FSU section on 12/20/19 with an annotated graph under the headline, "Perched Within Close Striking Distance of 52-Week High".
A 2:1 split impacted share price on 8/23/19 when it was dropped from the Featured Stocks list. It reported earnings +27% on +13% sales revenues for the Sep '19 quarter, and 3 of the past 4 quarterly comparisons were above the +25% minimum earnings guideline (C criteria). A small downturn in FY '16 earnings was previously noted as a flaw in its annual earnings (A criteria) history.
The number of top-rated funds owning its shares rose from 238 in Mar '18 to 483 in Sep '19, a reassuring sign concerning the I criteria. Its current Up/Down Volume Ratio of 1.2 is an unbiased indication its shares have been under accumulation over the past 50 days. It has a Timeliness Rating of B and Sponsorship Rating of D. The small supply of 34.8 million shares outstanding (S criteria) can contribute to greater price volatility in the even of institutional buying or selling.
Charts courtesy of www.stockcharts.com
 |
|
|
Color Codes Explained :
Y - Better candidates highlighted by our
staff of experts.
G - Previously featured
in past reports as yellow but may no longer be buyable under the
guidelines.
***Last / Change / Volume data in this table is the closing quote data***
Symbol/Exchange
Company Name
Industry Group |
PRICE |
CHANGE
(%Change) |
Day High |
Volume
(% DAV)
(% 50 day avg vol) |
52 Wk Hi
% From Hi |
Featured
Date |
Price
Featured |
Pivot Featured |
|
Max Buy |
 MLR
-
NYSE
MLR
-
NYSE
Miller Industries Inc
AUTOMOTIVE - Auto Parts
|
$35.34
|
+0.03
0.08% |
$35.72
|
61,208
146.08% of 50 DAV
50 DAV is 41,900
|
$38.18
-7.44%
|
9/24/2019
|
$34.00
|
PP = $35.36
|
|
MB = $37.13
|
Most Recent Note - 1/8/2020 12:49:28 PM
G - Consolidating near its 50 DMA line ($36.39) and above prior highs in the $35 area which define important support to watch. Resilient after reporting Sep '19 earnings which were below the fundamental guidelines of the fact-based investment system.
>>> FEATURED STOCK ARTICLE : Towing/Recovery Equipment Firm Remains Perched Near Record High - 12/27/2019 |
View all notes |
Set NEW NOTE alert |
Company Profile |
SEC
News |
Chart |
Request a new note
C
A
S
I |
CCBG
-
NASDAQ
Capital City Bk Gp
BANKING - Regional - Mid-Atlantic Banks
|
$29.12
|
+0.11
0.38% |
$29.35
|
33,592
73.51% of 50 DAV
50 DAV is 45,700
|
$30.95
-5.91%
|
12/16/2019
|
$30.07
|
PP = $30.95
|
|
MB = $32.50
|
Most Recent Note - 1/8/2020 12:47:26 PM
Y - Consolidating near its 50 DMA line ($29.58) after meeting resistance at its 52-week high. Subsequent gains and a strong close above the new pivot point cited based on its 11/06/19 high plus 10 cents may trigger a new (or add-on) technical buy signal. Prior low ($28.16 on 12/03/19) defines the next important support level.
>>> FEATURED STOCK ARTICLE : Perched Near 52-Week High After Forming an Orderly Base - 1/2/2020 |
View all notes |
Set NEW NOTE alert |
Company Profile |
SEC
News |
Chart |
Request a new note
C
A
S
I |
FTNT
-
NASDAQ
Fortinet Inc
Computer Sftwr-Security
|
$116.69
|
+2.37
2.07% |
$116.75
|
843,256
61.55% of 50 DAV
50 DAV is 1,370,000
|
$115.78
0.79%
|
12/9/2019
|
$103.85
|
PP = $106.10
|
|
MB = $111.41
|
 Most Recent Note - 1/13/2020 6:27:25 PM
G - Hit another new 52-week high with below average volume behind today's gain, getting very extended from any sound base. Its 50 DMA line ($104) defines important near-term support to watch.
>>> FEATURED STOCK ARTICLE : Endured Distributional Pressure While Perched at High - 12/23/2019 |
View all notes |
Set NEW NOTE alert |
Company Profile |
SEC
News |
Chart |
Request a new note
C
A
S
I |
SPSC
-
NASDAQ
S P S Commerce Inc
COMPUTER SOFTWARE and SERVICES - Application Software
|
$57.36
|
+0.68
1.20% |
$57.55
|
168,992
96.07% of 50 DAV
50 DAV is 175,900
|
$59.14
-3.01%
|
11/29/2019
|
$56.59
|
PP = $59.24
|
|
MB = $62.20
|
Most Recent Note - 1/13/2020 6:31:39 PM
Y - Still perched only -3% off its all-time high. Subsequent gains above its pivot point backed by at least +40% above average volume are needed to trigger a new technical buy signal. Fundamentals remain strong. Its Relative Strength Rating of 81 is just above the 80+ minimum guideline for buy candidates. See the latest FSU analysis for more details and a new annotated graph.
>>> FEATURED STOCK ARTICLE : Still Lingering Below Prior Resistance - 1/13/2020 |
View all notes |
Set NEW NOTE alert |
Company Profile |
SEC
News |
Chart |
Request a new note
C
A
S
I |
AUDC
-
NASDAQ
Audiocodes Ltd
ELECTRONICS - Scientific and Technical Instrum
|
$27.47
|
+1.60
6.18% |
$27.66
|
491,381
184.73% of 50 DAV
50 DAV is 266,000
|
$26.68
2.96%
|
9/13/2019
|
$19.68
|
PP = $19.84
|
|
MB = $20.83
|
Most Recent Note - 1/13/2020 12:39:30 PM
G - Hitting a new all-time high with heavier volume behind today's 5th consecutive gain. Very extended from the previously noted base. Its 50 DMA line ($23.91) defines support above with prior highs in the $22 area. Fundamentals remain strong.
>>> FEATURED STOCK ARTICLE : Large Loss With Higher Volume Indicates Distributional Pressure - 1/6/2020 |
View all notes |
Set NEW NOTE alert |
Company Profile |
SEC
News |
Chart |
Request a new note
C
A
S
I |
Symbol/Exchange
Company Name
Industry Group |
PRICE |
CHANGE
(%Change) |
Day High |
Volume
(% DAV)
(% 50 day avg vol) |
52 Wk Hi
% From Hi |
Featured
Date |
Price
Featured |
Pivot Featured |
|
Max Buy |
CHDN
-
NASDAQ
Churchill Downs Inc
LEISURE - Gaming Activities
|
$139.68
|
+3.91
2.88% |
$139.81
|
307,120
122.85% of 50 DAV
50 DAV is 250,000
|
$138.17
1.09%
|
10/8/2019
|
$129.77
|
PP = $132.83
|
|
MB = $139.47
|
Most Recent Note - 1/13/2020 6:25:11 PM
G - Rallied for a new 52-week high with today's gain backed by higher volume. Its 50 DMA line ($131) defines near-term support above the prior low ($121.81 on 11/07/19) The Jun and Sep '19 quarterly earnings versus the year ago periods were both below the +25% minimum guideline (C criteria) and raised fundamental concerns.
>>> FEATURED STOCK ARTICLE : Touched a New HIgh With Gains Backed by Light Volume - 12/30/2019 |
View all notes |
Set NEW NOTE alert |
Company Profile |
SEC
News |
Chart |
Request a new note
C
A
S
I |
LULU
-
NASDAQ
Lululemon Athletica
MANUFACTURING - Textile Manufacturing
|
$245.18
|
+10.34
4.40% |
$245.35
|
4,118,105
203.16% of 50 DAV
50 DAV is 2,027,000
|
$239.47
2.38%
|
9/6/2019
|
$201.25
|
PP = $194.35
|
|
MB = $204.07
|
Most Recent Note - 1/13/2020 12:56:03 PM
G - Powering to a new all-time high with today's gap up and big gain backed by heavier volume, getting more extended from any sound base. Its 50 DMA line and prior low ($218.18 on 12/12/19) define important near-term support to watch. Recently reported earnings +28% on +23% sales revenues for the Oct '19 quarter.
>>> FEATURED STOCK ARTICLE : Perched at All-Time High After Gains Lacking Great Volume - 1/9/2020 |
View all notes |
Set NEW NOTE alert |
Company Profile |
SEC
News |
Chart |
Request a new note
C
A
S
I |
CPRT
-
NASDAQ
Copart Inc
SPECIALTY RETAIL - Auto Dealerships
|
$96.26
|
+0.95
1.00% |
$96.30
|
1,272,852
69.18% of 50 DAV
50 DAV is 1,840,000
|
$95.89
0.39%
|
1/2/2020
|
$92.80
|
PP = $92.51
|
|
MB = $97.14
|
Most Recent Note - 1/13/2020 6:34:04 PM
Y - Posted a 4th consecutive gain with light volume, wedging further into new all-time high territory. Its 50 DMA line ($88.40) defines near-term support. Fundamentals remain strong.
>>> FEATURED STOCK ARTICLE : Perched at All-Time HIgh Following Recent Volume-Driven Gain - 1/7/2020 |
View all notes |
Set NEW NOTE alert |
Company Profile |
SEC
News |
Chart |
Request a new note
C
A
S
I |
NMIH
-
NASDAQ
N M I Holdings Inc Cl A
Finance-MrtgandRel Svc
|
$32.28
|
+0.26
0.81% |
$32.43
|
372,961
71.45% of 50 DAV
50 DAV is 522,000
|
$35.79
-9.81%
|
11/8/2019
|
$32.89
|
PP = $31.44
|
|
MB = $33.01
|
Most Recent Note - 1/10/2020 5:36:30 PM
G - A rebound above the 50 DMA line ($32.77) is needed for its outlook to improve. Prior highs in the $30-31 area define the next important near-term support. Fundamentals remain strong. See the latest FSU analysis for more details and a new annotated graph.
>>> FEATURED STOCK ARTICLE : Outlook Hurt by Slump Below 50-Day Moving Average - 1/10/2020 |
View all notes |
Set NEW NOTE alert |
Company Profile |
SEC
News |
Chart |
Request a new note
C
A
S
I |
SPLK
-
NASDAQ
Splunk Inc
Computer Sftwr-Database
|
$156.46
|
+0.68
0.44% |
$157.72
|
1,223,597
61.24% of 50 DAV
50 DAV is 1,998,000
|
$157.66
-0.76%
|
11/25/2019
|
$147.79
|
PP = $142.16
|
|
MB = $149.27
|
Most Recent Note - 1/8/2020 5:38:11 PM
G - Hit another new high with today's gain backed by average volume, getting more extended from the previously noted base. Prior highs in the $142-143 area define initial support to watch above its 50 DMA line ($138.91) on pullbacks. See the latest FSU analysis for more details and a new annotated graph.
>>> FEATURED STOCK ARTICLE : New High Hit With Another Gain on Near Average Volume - 1/8/2020 |
View all notes |
Set NEW NOTE alert |
Company Profile |
SEC
News |
Chart |
Request a new note
C
A
S
I |
Symbol/Exchange
Company Name
Industry Group |
PRICE |
CHANGE
(%Change) |
Day High |
Volume
(% DAV)
(% 50 day avg vol) |
52 Wk Hi
% From Hi |
Featured
Date |
Price
Featured |
Pivot Featured |
|
Max Buy |
PAYC
-
NYSE
Paycom Software Inc
COMPUTER SOFTWARE and SERVICES - Application Software
|
$295.43
|
+9.85
3.45% |
$297.09
|
588,177
109.73% of 50 DAV
50 DAV is 536,000
|
$288.26
2.49%
|
11/20/2019
|
$252.97
|
PP = $259.81
|
|
MB = $272.80
|
Most Recent Note - 1/13/2020 6:30:02 PM
G - Hit another new high with today's 9th consecutive gain, very extended from any sound base. Its 50 DMA line ($256) defines important near-term support to watch. Fundamentals remain strong.
>>> FEATURED STOCK ARTICLE : Perched Near High and Near the Max Buy Level - 1/3/2020 |
View all notes |
Set NEW NOTE alert |
Company Profile |
SEC
News |
Chart |
Request a new note
C
A
S
I |
BLD
-
NYSE
Topbuild Corp
Bldg-Constr Prds/Misc
|
$104.88
|
+0.29
0.28% |
$105.40
|
379,197
128.11% of 50 DAV
50 DAV is 296,000
|
$113.74
-7.79%
|
12/9/2019
|
$109.71
|
PP = $113.84
|
|
MB = $119.53
|
Most Recent Note - 1/13/2020 6:23:42 PM
G - Sputtering below its 50 DMA line ($106.76) which has acted as resistance. A rebound above its 50 DMA line is needed for its outlook to improve.
>>> FEATURED STOCK ARTICLE : Recent Slump Below 50-Day Moving Average Did Technical Damage - 12/24/2019 |
View all notes |
Set NEW NOTE alert |
Company Profile |
SEC
News |
Chart |
Request a new note
C
A
S
I |
GLOB
-
NYSE
Globant SA
Computer-Tech Services
|
$111.79
|
+1.05
0.95% |
$113.02
|
174,574
65.38% of 50 DAV
50 DAV is 267,000
|
$115.60
-3.30%
|
11/14/2019
|
$106.87
|
PP = $112.43
|
|
MB = $118.05
|
Most Recent Note - 1/10/2020 1:11:40 PM
Y - Loss today with higher volume is indicative of distributional pressure after reaching a new high with gains lacking great volume conviction. Gains above the pivot point backed by at least +40% above average volume are needed to trigger a proper technical buy signal. Its 50 DMA line ($103) defines important near-term support to watch on pullbacks. Fundamentals remain strong.
>>> FEATURED STOCK ARTICLE : Rebound Has Globant Perched Within Striking Distance of High - 12/26/2019 |
View all notes |
Set NEW NOTE alert |
Company Profile |
SEC
News |
Chart |
Request a new note
C
A
S
I |
|
|
|
THESE ARE NOT BUY RECOMMENDATIONS!
Comments contained in the body of this report are technical
opinions only. The material herein has been obtained
from sources believed to be reliable and accurate, however,
its accuracy and completeness cannot be guaranteed.
This site is not an investment advisor, hence it does
not endorse or recommend any securities or other investments.
Any recommendation contained in this report may not
be suitable for all investors and it is not to be deemed
an offer or solicitation on our part with respect to
the purchase or sale of any securities. All trademarks,
service marks and trade names appearing in this report
are the property of their respective owners, and are
likewise used for identification purposes only.
This report is a service available
only to active Paid Premium Members.
You may opt-out of receiving report notifications
at any time. Questions or comments may be submitted
by writing to Premium Membership Services 665 S.E. 10 Street, Suite 201 Deerfield Beach, FL 33441-5634 or by calling 1-800-965-8307
or 954-785-1121.
|
|
|