You are not logged in.
This means you
CAN ONLY VIEW reports that were published prior to Monday, February 19, 2024.
You
MUST UPGRADE YOUR MEMBERSHIP if you want to see any current reports.
AFTER MARKET UPDATE - TUESDAY, JANUARY 11TH, 2022
Previous After Market Report Next After Market Report >>>
|
|
|
|
DOW |
+183.15 |
36,252.02 |
+0.51% |
|
Volume |
852,790,090 |
-15% |
|
Volume |
4,354,577,800 |
-17% |
|
NASDAQ |
+210.62 |
15,153.45 |
+1.41% |
|
Advancers |
2,392 |
74% |
|
Advancers |
3,058 |
69% |
|
S&P 500 |
+42.78 |
4,713.07 |
+0.92% |
|
Decliners |
849 |
26% |
|
Decliners |
1,402 |
31% |
|
Russell 2000 |
+22.85 |
2,194.00 |
+1.05% |
|
52 Wk Highs |
96 |
|
|
52 Wk Highs |
45 |
|
|
S&P 600 |
+9.19 |
1,388.26 |
+0.67% |
|
52 Wk Lows |
57 |
|
|
52 Wk Lows |
172 |
|
|
 |
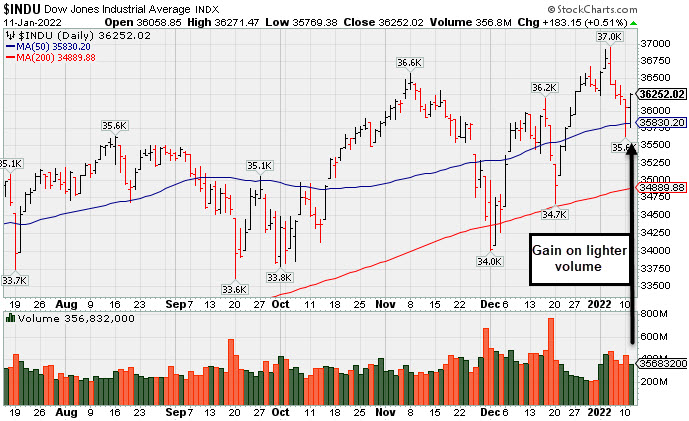
Major Indices Posted Gains With Lighter Volume
Kenneth J. Gruneisen - Passed the CAN SLIM® Master's Exam
The S&P 500 rose 0.9%, snapping a five-session losing streak that had been its longest since September. The Dow climbed 183 points, while the Nasdaq Composite rallied 1.4% as investors appeared to buy the dip in recently beleaguered tech shares. Volume totals reported were lighter than the prior session on the NYSE and on the Nasdaq exchange, revealing lackluster institutional buying demand. There was a positive bias as advancers led decliners by almost a 3-1 margin on the NYSE and more than 2-1 on the Nasdaq exchange. There were 26 high-ranked companies from the Leaders List that hit new 52-week highs and were listed on the BreakOuts Page, versus the total of 51 on the prior session. New 52-week highs outnumbered new 52-week lows on the NYSE, but new lows outnumbered new highs on the Nasdaq exchange. The market averages (M criteria) have an uptrend that is currently under pressure. New buying efforts are to be carefully made under the fact-based investment system's strict criteria. PICTURED: The Nasdaq Composite Index has pulled back testing its 200-day moving average (DMA) line.
Stocks finished firmly higher during a volatile session on Tuesday as investors weighed comments from Federal Reserve (Fed) Chair Jerome Powell. During his nomination hearing before the Senate Banking Committee, the Fed chief offered reassurance that policymakers would use their tools to prevent inflation from becoming entrenched. Furthermore, he stated that no decision had been made concerning the reduction of the central bank’s nearly $8.8 trillion balance sheet, adding that "it's a long road to normal" in terms of monetary policy.
Eight of 11 S&P 500 sectors finished in positive territory, with the more traditionally defensive Utilities and Consumer Staples groups lagging alongside Real Estate shares. The Energy sector outperformed with WTI crude jumping 4.1% to $81.42/barrel. Technology shares were also among the standouts with chipmaker Advanced Micro Devices, Inc. (AMD +4.02%) rising on the heels of an analyst upgrade. In other corporate news, medical equipment maker Illumina Inc. (ILMN +16.98%) rose after its 2022 revenue outlook topped Wall Street expectations.
Treasuries strengthened modestly, with the yield on the 10-year note easing two basis points (0.02%) to 1.74%, still near a two-year high. On the data front, a measure of small business optimism improved modestly in December. Tomorrow will bring a key update on inflation. In commodities, COMEX gold added 1.3% to $1822.30/ounce as a gauge of the U.S. dollar declined 0.4%. |
 Kenneth J. Gruneisen started out as a licensed stockbroker in August 1987, a couple of months prior to the historic stock market crash that took the Dow Jones Industrial Average down -22.6% in a single day. He has published daily fact-based fundamental and technical analysis on high-ranked stocks online for two decades. Through FACTBASEDINVESTING.COM, Kenneth provides educational articles, news, market commentary, and other information regarding proven investment systems that work in good times and bad.
Comments contained in the body of this report are technical opinions only and are not necessarily those of Gruneisen Growth Corp. The material herein has been obtained from sources believed to be reliable and accurate, however, its accuracy and completeness cannot be guaranteed. Our firm, employees, and customers may effect transactions, including transactions contrary to any recommendation herein, or have positions in the securities mentioned herein or options with respect thereto. Any recommendation contained in this report may not be suitable for all investors and it is not to be deemed an offer or solicitation on our part with respect to the purchase or sale of any securities. |
|
 |
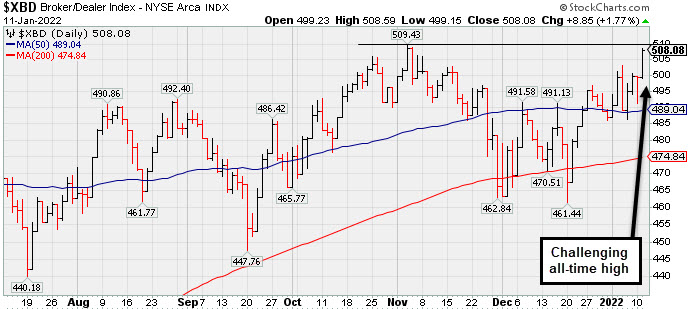
Financial, Retail, Tech, and Commodity-Linked Groups Posted Gains
Kenneth J. Gruneisen - Passed the CAN SLIM® Master's Exam
Commodity-linked groups posted standout gains as the Oil Services Index ($OSX +4.30%) and Integrated Oil Index ($XOI +3.51%) both outpaced the Gold & Silver Index ($XAU +2.20%). The Semiconductor Index ($SOX +1.84%), Biotech Index ($BTK +1.48%), and Networking Index ($NWX +0.96%) posted unanimous gains. The Broker/Dealer Index ($XBD +1.77%), Bank Index ($BKX +0.88%), and Retail Index ($RLX +1.44%) rounded out the widely positive session. PICTURED: The Broker/Dealer Index ($XBD +1.77%) is challenging its all-time high. It found support near its 200 DMA line in December.
| Oil Services |
$OSX |
62.83 |
+2.59 |
+4.30% |
+19.17% |
| Integrated Oil |
$XOI |
1,342.52 |
+45.48 |
+3.51% |
+13.95% |
| Semiconductor |
$SOX |
3,875.44 |
+70.06 |
+1.84% |
-1.79% |
| Networking |
$NWX |
947.08 |
+9.05 |
+0.96% |
-2.47% |
| Broker/Dealer |
$XBD |
508.08 |
+8.85 |
+1.77% |
+4.36% |
| Retail |
$RLX |
4,109.15 |
+58.45 |
+1.44% |
-2.78% |
| Gold & Silver |
$XAU |
129.27 |
+2.79 |
+2.20% |
-2.40% |
| Bank |
$BKX |
146.54 |
+1.28 |
+0.88% |
+10.83% |
| Biotech |
$BTK |
5,320.75 |
+77.53 |
+1.48% |
-3.58% |
|
|
|
 |
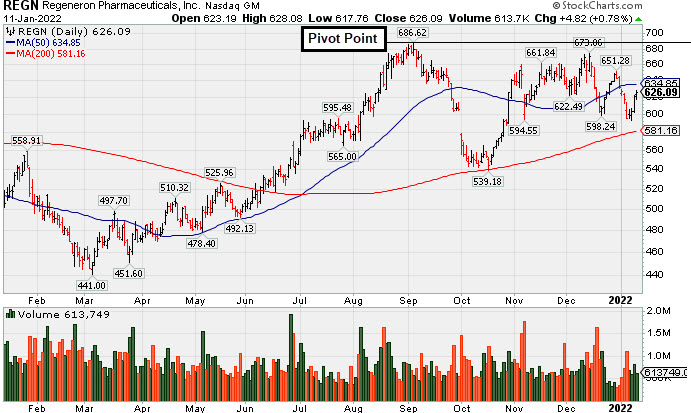
Regeneron Still Lingering Below 50-Day Moving Average Line
Kenneth J. Gruneisen - Passed the CAN SLIM® Master's Exam
Regeneron Pharmaceutical (REGN +$4.82 or +0.78% to $626.09) posted a 4th consecutive gain today. A rebound above the 50-day moving average (DMA) line ($635) is still needed for its outlook to improve. Its Relative Strength rating is 88, still well above the 80+ minimum guideline for buy candidates.
REGN was highlighted in yellow with new pivot point cited based on its 9/01/21 high plus 10 cents in the 12/13/21 mid-day report (read here) and it was covered in greater detail that evening with an annotated graph under the headline, "Consolidating Near All-Time High With Little Resistance Remaining". It found support above its 200 DMA line and then rebounded since dropped from the Featured Stocks list on 9/28/21.
The high-ranked DRUGS - Biotechnology firm reported earnings +84% on +51% sales revenues for the Sep '21 quarter versus the year ago period. That marked its 5th quarterly comparison above the +25% minimum earnings guideline (C criteria) and with a strong sales revenues growth rate. Its annual earnings (A criteria) growth has been strong. It has a 99 Earnings Per Share Rating.
There are 2,718 top-rated funds that own its shares as of Sep '21, up from 2,376 in Dec '20, a reassuring sign concerning the I criteria. Its current Up/Down Volume Ratio of 0.9 is an unbiased indication its shares have been under slight distributional pressure over the past 50 days. REGN completed a Secondary Offering on 5/28/20. There are 96.2 million shares in the public float (S criteria) which can contribute to greater volatility in the event of institutional buying or selling.
|
|
|
Color Codes Explained :
Y - Better candidates highlighted by our
staff of experts.
G - Previously featured
in past reports as yellow but may no longer be buyable under the
guidelines.
***Last / Change / Volume data in this table is the closing quote data***
Symbol/Exchange
Company Name
Industry Group |
PRICE |
CHANGE
(%Change) |
Day High |
Volume
(% DAV)
(% 50 day avg vol) |
52 Wk Hi
% From Hi |
Featured
Date |
Price
Featured |
Pivot Featured |
|
Max Buy |
 BLDR
-
NYSE
BLDR
-
NYSE
Builders Firstsource Inc
Bldg-Constr Prds/Misc
|
$80.49
|
+1.48
1.87% |
$80.56
|
2,892,735
104.39% of 50 DAV
50 DAV is 2,771,000
|
$86.48
-6.93%
|
8/12/2021
|
$52.38
|
PP = $54.09
|
|
MB = $56.79
|
Most Recent Note - 1/10/2022 5:22:41 PM
G - Managed a positive reversal today. Very extended from any sound base. Reported Sep '21 quarterly earnings +308% on +140% sales revenues versus the year ago period. Its 50 DMA line ($73.99) and prior low ($72.60 on 12/20/21) define important near-term support to watch. See the latest FSU analysis for more details and a new annotated graph.
>>> FEATURED STOCK ARTICLE : Pulling Back After Getting Very Extended From Any Sound Base - 1/10/2022 |
View all notes |
Set NEW NOTE alert |
Company Profile |
SEC
News |
Chart |
Request a new note
C
A
S
I |
KFRC
-
NASDAQ
Kforce Inc
Comml Svcs-Staffing
|
$70.33
|
+0.38
0.54% |
$70.90
|
170,887
146.06% of 50 DAV
50 DAV is 117,000
|
$81.47
-13.67%
|
9/10/2021
|
$59.53
|
PP = $64.48
|
|
MB = $67.70
|
Most Recent Note - 1/7/2022 5:32:33 PM
G - Sank well below its 50 DMA line ($74.69) today and near the prior low ($71.05 on 12/14/21) which defines important near-term support to watch. Recently reported Sep '21 quarterly earnings +8% on +10% sales revenues versus the year ago period, below the +25% minimum earnings guideline (C criteria), raising fundamental concerns.
>>> FEATURED STOCK ARTICLE : Consolidating Above its 50-Day Moving Average Line - 12/29/2021 |
View all notes |
Set NEW NOTE alert |
Company Profile |
SEC
News |
Chart |
Request a new note
C
A
S
I |
REGN
-
NASDAQ
Regeneron Pharmaceutical
DRUGS - Biotechnology
|
$626.09
|
+4.82
0.78% |
$628.08
|
610,459
81.61% of 50 DAV
50 DAV is 748,000
|
$686.62
-8.82%
|
12/13/2021
|
$647.95
|
PP = $686.72
|
|
MB = $721.06
|
 Most Recent Note - 1/11/2022 5:38:14 PM
G - Posted a 4th consecutive gain today, and a rebound above the 50 DMA line ($635) still is needed for its outlook to improve. See the latest FSU analysis for more details and a new annotated graph.
>>> FEATURED STOCK ARTICLE : Regeneron Still Lingering Below 50-Day Moving Average Line - 1/11/2022 |
View all notes |
Set NEW NOTE alert |
Company Profile |
SEC
News |
Chart |
Request a new note
C
A
S
I |
LLY
-
NYSE
Eli Lilly & Co
Medical-Diversified
|
$262.32
|
+2.21
0.85% |
$262.41
|
2,147,437
69.45% of 50 DAV
50 DAV is 3,092,000
|
$283.91
-7.60%
|
12/16/2021
|
$279.28
|
PP = $275.97
|
|
MB = $289.77
|
Most Recent Note - 1/11/2022 5:44:23 PM
Y - Still consolidating near its 50 DMA line ($260.90) with volume totals cooling. More damaging losses would raise greater concerns and trigger a technical sell signal.
>>> FEATURED STOCK ARTICLE : Eli Lilly & Co Powered to New Highs With Volume - 12/16/2021 |
View all notes |
Set NEW NOTE alert |
Company Profile |
SEC
News |
Chart |
Request a new note
C
A
S
I |
CAMT
-
NASDAQ
Camtek Ltd
ELECTRONICS - Scientific and Technical Instrum
|
$42.37
|
+1.03
2.49% |
$43.02
|
260,953
96.29% of 50 DAV
50 DAV is 271,000
|
$49.60
-14.58%
|
11/9/2021
|
$45.43
|
PP = $46.11
|
|
MB = $48.42
|
Most Recent Note - 1/7/2022 5:38:36 PM
G - Sank further below its 50 DMA line ($44) with today's loss on lighter volume. Only a prompt rebound above the 50 DMA line would help its outlook improve.
>>> FEATURED STOCK ARTICLE : Closed Above 50-Day Average After Big Gain With Light Volume - 12/15/2021 |
View all notes |
Set NEW NOTE alert |
Company Profile |
SEC
News |
Chart |
Request a new note
C
A
S
I |
Symbol/Exchange
Company Name
Industry Group |
PRICE |
CHANGE
(%Change) |
Day High |
Volume
(% DAV)
(% 50 day avg vol) |
52 Wk Hi
% From Hi |
Featured
Date |
Price
Featured |
Pivot Featured |
|
Max Buy |
AMD
-
NASDAQ
Advanced Micro Devices
ELECTRONICS - Semiconductor - Broad Line
|
$137.31
|
+5.31
4.02% |
$138.99
|
76,921,158
127.97% of 50 DAV
50 DAV is 60,111,000
|
$164.46
-16.51%
|
10/27/2021
|
$124.91
|
PP = $122.59
|
|
MB = $128.72
|
Most Recent Note - 1/11/2022 5:41:13 PM
G - Posted a volume-driven gain today but remains below its 50 DMA line ($144) after damaging losses last week triggered a technical sell signal and also undercut the prior low ($130.60). Fundamentals remain strong after it reported Sep '21 quarterly earnings +78% on +54% sales revenues versus the year ago period.
>>> FEATURED STOCK ARTICLE : Violation of 50-Day Moving Average Triggered Technical Sell Signal - 1/5/2022 |
View all notes |
Set NEW NOTE alert |
Company Profile |
SEC
News |
Chart |
Request a new note
C
A
S
I |
UMC
-
NYSE
United Microelectrnc Adr
ELECTRONICS - Semiconductor - Integrated Cir
|
$11.38
|
+0.24
2.15% |
$11.38
|
7,001,689
95.30% of 50 DAV
50 DAV is 7,347,000
|
$12.68
-10.25%
|
12/1/2021
|
$12.60
|
PP = $12.72
|
|
MB = $13.36
|
Most Recent Note - 1/10/2022 5:25:19 PM
G - Halted its slide today after recently slumping below its 50 DMA line ($11.37) testing recent lows and its color code was changed to green. More damaging losses would raise concerns and trigger a technical sell signal. A gain and solid close above the pivot point may help clinch a proper new (or add-on) technical buy signal. Reported Sep '21 quarterly earnings +100% on +30% sales revenues versus the year ago period.
>>> FEATURED STOCK ARTICLE : Testing Support and Perched Not Far From Prior Highs - 1/4/2022 |
View all notes |
Set NEW NOTE alert |
Company Profile |
SEC
News |
Chart |
Request a new note
C
A
S
I |
ENTG
-
NASDAQ
Entegris Inc
ELECTRONICS - Semiconductor Equipment and Mate
|
$135.09
|
+1.18
0.88% |
$136.73
|
1,004,501
83.43% of 50 DAV
50 DAV is 1,204,000
|
$158.00
-14.50%
|
8/4/2021
|
$125.33
|
PP = $126.51
|
|
MB = $132.84
|
Most Recent Note - 1/11/2022 5:42:50 PM
G - Halted its slide recently above its 200 DMA line, but a rebound above the 50 DMA line ($143.98) still is needed for its outlook to improve. Fundamentals remain strong after it recently reported Sep '21 quarterly earnings +37% on +20% sales revenues versus the year ago period.
>>> FEATURED STOCK ARTICLE : Still Below 50-Day Moving Average - 1/3/2022 |
View all notes |
Set NEW NOTE alert |
Company Profile |
SEC
News |
Chart |
Request a new note
C
A
S
I |
DHR
-
NYSE
Danaher Corp
Medical-Diversified
|
$305.33
|
+2.30
0.76% |
$309.32
|
3,793,269
139.97% of 50 DAV
50 DAV is 2,710,000
|
$333.96
-8.57%
|
12/16/2021
|
$321.36
|
PP = $334.06
|
|
MB = $350.76
|
Most Recent Note - 1/11/2022 5:49:24 PM
G - Halted its slide above its 200 DMA line ($289) with recent gains, but still needs to rebound above its 50 DMA line ($313) for its outlook to improve. Subsequent gains above the pivot point with at least +40% above average volume may trigger a technical buy signal. Fundamentals remain strong.
>>> FEATURED STOCK ARTICLE : Consolidating Near Prior Highs Above 50-Day Moving Average - 12/17/2021 |
View all notes |
Set NEW NOTE alert |
Company Profile |
SEC
News |
Chart |
Request a new note
C
A
S
I |
SKY
-
NYSE
Skyline Champion Corp
Bldg-Mobile/Mfg andamp; RV
|
$71.39
|
+1.23
1.75% |
$71.73
|
423,884
81.20% of 50 DAV
50 DAV is 522,000
|
$85.92
-16.91%
|
11/3/2021
|
$72.19
|
PP = $66.92
|
|
MB = $70.27
|
Most Recent Note - 1/7/2022 5:30:31 PM
G - Suffered another big loss today on higher (near average) volume while sinking further below its 50 DMA line ($76.44) again raising concerns. Prior low ($68.54) defines the next important support level. Fundamentals remain strong.
>>> FEATURED STOCK ARTICLE : Pulling Back From All-Time High After Recent Rally - 12/14/2021 |
View all notes |
Set NEW NOTE alert |
Company Profile |
SEC
News |
Chart |
Request a new note
C
A
S
I |
Symbol/Exchange
Company Name
Industry Group |
PRICE |
CHANGE
(%Change) |
Day High |
Volume
(% DAV)
(% 50 day avg vol) |
52 Wk Hi
% From Hi |
Featured
Date |
Price
Featured |
Pivot Featured |
|
Max Buy |
DHI
-
NYSE
D R Horton Inc
MATERIALS and CONSTRUCTION - Residential Construction
|
$98.73
|
+3.01
3.14% |
$99.42
|
4,048,355
134.68% of 50 DAV
50 DAV is 3,006,000
|
$110.45
-10.61%
|
12/6/2021
|
$104.40
|
PP = $106.99
|
|
MB = $112.34
|
Most Recent Note - 1/7/2022 5:36:30 PM
G - Color code is changed to green after a damaging 3rd consecutive volume-driven loss violated its 50-day moving average (DMA) line ($100.77) triggering a technical sell signal. Only a prompt rebound above the 50 DMA line would help its outlook improve. See the latest FSU analysis for more details and an annotated graph.
>>> FEATURED STOCK ARTICLE : Pullback Testing Support at 50-Day Moving Average Line - 1/6/2022 |
View all notes |
Set NEW NOTE alert |
Company Profile |
SEC
News |
Chart |
Request a new note
C
A
S
I |
TITN
-
NASDAQ
Titan Machinery Inc
SPECIALTY RETAIL
|
$32.61
|
+0.19
0.59% |
$32.76
|
106,422
58.47% of 50 DAV
50 DAV is 182,000
|
$38.58
-15.47%
|
11/23/2021
|
$36.22
|
PP = $35.34
|
|
MB = $37.11
|
Most Recent Note - 1/10/2022 5:23:56 PM
G - Pulled back today with lighter volume undercutting its 50 DMA line ($32.86). It has not formed a sound base and faces resistance due to overhead supply up to the $38 level. Reported Oct '21 quarterly earnings +81% on +26% sales revenues over the year ago period, its 4th strong quarterly comparison.
>>> FEATURED STOCK ARTICLE : Recently Found Support at 50-Day Moving Average Line - 12/31/2021 |
View all notes |
Set NEW NOTE alert |
Company Profile |
SEC
News |
Chart |
Request a new note
C
A
S
I |
CLFD
-
NASDAQ
Clearfield Inc
TELECOMMUNICATIONS - Cables / Satalite Equipment
|
$68.70
|
-0.89
-1.28% |
$70.31
|
155,631
92.64% of 50 DAV
50 DAV is 168,000
|
$86.71
-20.77%
|
12/16/2021
|
$72.76
|
PP = $72.10
|
|
MB = $75.71
|
Most Recent Note - 1/7/2022 5:34:16 PM
G - Suffered yet another big volume-driven loss today finishing near the prior high ($72) which defines initial support to watch above its 50 DMA line ($68.66). Reported Sep '21 quarterly earnings +141% on +66% sales revenues above the year ago period.
>>> FEATURED STOCK ARTICLE : Negative Reversal After Hitting a New All Time High - 12/30/2021 |
View all notes |
Set NEW NOTE alert |
Company Profile |
SEC
News |
Chart |
Request a new note
C
A
S
I |
ODFL
-
NASDAQ
Old Dominion Fght Line
TRANSPORTATION - Trucking
|
$325.47
|
-4.70
-1.42% |
$327.02
|
882,931
137.10% of 50 DAV
50 DAV is 644,000
|
$373.58
-12.88%
|
12/7/2021
|
$365.61
|
PP = $364.17
|
|
MB = $382.38
|
Most Recent Note - 1/11/2022 5:46:37 PM
Sank further below its 50 DMA line ($351) with today's 5th consecutive volume-driven loss. It will be dropped from the Featured Stocks list tonight. A rebound above the 50 DMA line is needed for its outlook to improve. Faces near term resistance up to the $373 level..
>>> FEATURED STOCK ARTICLE : Slump Below 50 DMA Line Hurt Outlook - 1/7/2022 |
View all notes |
Set NEW NOTE alert |
Company Profile |
SEC
News |
Chart |
Request a new note
C
A
S
I |
POOL
-
NASDAQ
Pool Corp
WHOLESALE - Basic Materials Wholesale
|
$502.06
|
+5.75
1.16% |
$505.82
|
383,487
149.80% of 50 DAV
50 DAV is 256,000
|
$582.27
-13.78%
|
12/27/2021
|
$555.44
|
PP = $582.37
|
|
MB = $611.49
|
Most Recent Note - 1/10/2022 5:31:37 PM
G -Slumped further below its 50 DMA line ($548) with higher volume behind today's 6th consecutive loss. A rebound above the 50 DMA line is needed for its outlook to improve. Subsequent gains above the pivot point backed by at least +40% above average volume may trigger a new technical buy signal. Reported strong Sep '21 quarterly results.
>>> FEATURED STOCK ARTICLE : Forming New Base After Finding Prompt Support at 50 DMA - 12/27/2021 |
View all notes |
Set NEW NOTE alert |
Company Profile |
SEC
News |
Chart |
Request a new note
C
A
S
I |
Symbol/Exchange
Company Name
Industry Group |
PRICE |
CHANGE
(%Change) |
Day High |
Volume
(% DAV)
(% 50 day avg vol) |
52 Wk Hi
% From Hi |
Featured
Date |
Price
Featured |
Pivot Featured |
|
Max Buy |
SMPL
-
NASDAQ
Simply Good Foods Co
Food-Confectionery
|
$39.04
|
+1.37
3.64% |
$39.10
|
561,304
117.04% of 50 DAV
50 DAV is 479,600
|
$43.17
-9.57%
|
12/22/2021
|
$40.04
|
PP = $41.45
|
|
MB = $43.52
|
Most Recent Note - 1/10/2022 12:58:38 PM
G - Color code is changed to green while slumping below its 50 DMA line ($39.22) with a loss today raising greater concerns. Its 200 DMA line ($36.13) and prior low ($35.60 on 12/02/21) define the next important near-term support. Reported Nov '21 quarterly earnings +48% on +22% sales revenues versus the year ago period.
>>> FEATURED STOCK ARTICLE : Formed New 5-Week Base and Perched Near Pivot Point - 12/22/2021 |
View all notes |
Set NEW NOTE alert |
Company Profile |
SEC
News |
Chart |
Request a new note
C
A
S
I |
AVTR
-
NYSE
Avantor Inc
Medical-Research Eqp/Svc
|
$38.31
|
+0.03
0.08% |
$38.62
|
3,898,029
101.71% of 50 DAV
50 DAV is 3,832,400
|
$44.37
-13.66%
|
12/27/2021
|
$41.96
|
PP = $44.47
|
|
MB = $46.69
|
Most Recent Note - 1/10/2022 5:27:38 PM
G - Managed an impressive "positive reversal" today for a volume-driven gain, rallying from its 200 DMA line ($36.88) after briefly undercutting prior lows in the $36 area. A rebound above the 50 DMA line is needed for its outlook to improve. Reported Sep '21 quarterly earnings +46% above the year ago period.
>>> FEATURED STOCK ARTICLE : Rebounding With Volume-Driven Gains - 12/21/2021 |
View all notes |
Set NEW NOTE alert |
Company Profile |
SEC
News |
Chart |
Request a new note
C
A
S
I |
|
|
|
THESE ARE NOT BUY RECOMMENDATIONS!
Comments contained in the body of this report are technical
opinions only. The material herein has been obtained
from sources believed to be reliable and accurate, however,
its accuracy and completeness cannot be guaranteed.
This site is not an investment advisor, hence it does
not endorse or recommend any securities or other investments.
Any recommendation contained in this report may not
be suitable for all investors and it is not to be deemed
an offer or solicitation on our part with respect to
the purchase or sale of any securities. All trademarks,
service marks and trade names appearing in this report
are the property of their respective owners, and are
likewise used for identification purposes only.
This report is a service available
only to active Paid Premium Members.
You may opt-out of receiving report notifications
at any time. Questions or comments may be submitted
by writing to Premium Membership Services 665 S.E. 10 Street, Suite 201 Deerfield Beach, FL 33441-5634 or by calling 1-800-965-8307
or 954-785-1121.
|
|
|