You are not logged in.
This means you
CAN ONLY VIEW reports that were published prior to Friday, February 23, 2024.
You
MUST UPGRADE YOUR MEMBERSHIP if you want to see any current reports.
AFTER MARKET UPDATE - THURSDAY, JANUARY 9TH, 2020
Previous After Market Report Next After Market Report >>>
|
|
|
|
DOW |
+211.81 |
28,956.90 |
+0.74% |
|
Volume |
875,867,330 |
-2% |
|
Volume |
2,495,425,330 |
+2% |
|
NASDAQ |
+74.19 |
9,203.43 |
+0.81% |
|
Advancers |
1,606 |
56% |
|
Advancers |
1,875 |
59% |
|
S&P 500 |
+21.65 |
3,274.70 |
+0.67% |
|
Decliners |
1,255 |
44% |
|
Decliners |
1,296 |
41% |
|
Russell 2000 |
+1.40 |
1,664.99 |
+0.08% |
|
52 Wk Highs |
241 |
|
|
52 Wk Highs |
258 |
|
|
S&P 600 |
-0.72 |
1,015.79 |
-0.07% |
|
52 Wk Lows |
13 |
|
|
52 Wk Lows |
17 |
|
|
 |
Leadership Expands as Major Indices Extend Rally
Kenneth J. Gruneisen - Passed the CAN SLIM® Master's Exam
The Dow jumped 211 points, finishing within striking distance of the 29,000 level at 28,956. The S&P 500 rose 0.7%, while the Nasdaq Composite advanced 0.8%. Advancers led decliners by a 4-3 margin on the NYSE and 3-2 on the Nasdaq exchange. The reported volume totals were mixed, lighter than the prior session total on the NYSE and higher on the Nasdaq exchange. There were 96 high-ranked companies from the Leaders List that hit a new 52-week high and were listed on the BreakOuts Page, versus the total of 78 on the prior session. New 52-week highs totals expanded and easily outnumbered new 52-week lows totals on the NYSE and on the Nasdaq exchange. The major indices (M criteria) are in a "confirmed uptrend" after enduring distributional pressure in recent weeks. The Featured Stocks Page provides the most timely analysis on high-ranked leaders. Charts used courtesy of www.stockcharts.com
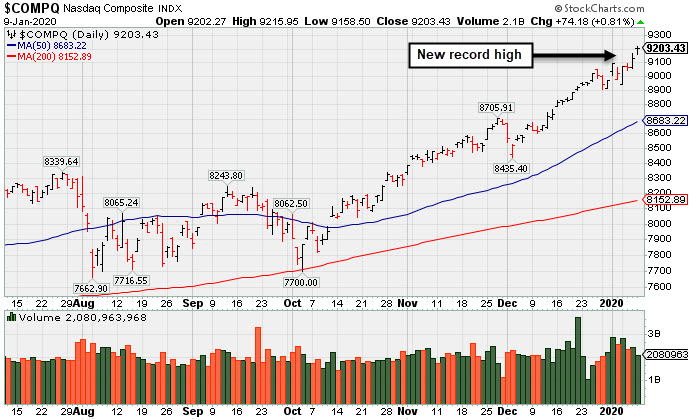
PICTURED: The Nasdaq Composite Index hit another new record high.
The major averages finished at record highs on Thursday, as easing tensions in the Middle East and positive trade headlines lifted risk sentiment. China announced plans for its top trade delegation, which includes Vice Premier Liu He, to travel to Washington next week in order to sign the “phase one” accord.
All 11 S&P 500 sectors ended the session in positive territory. Technology shares paced the gains, with Apple (AAPL +2.12%) up following reports of increased iPhone shipments to China. Financials also outperformed, with Goldman Sachs (GS +2.04%) rose after being the subject of an analyst upgrade. In other corporate news, Boeing (BA +1.50%) rose amid speculation the downed 737-800 in Iran was mistakenly struck by an anti-aircraft missile system. Bed Bath & Beyond (BBBY -19.22%) slumped after posting a surprise loss during the last quarter. Costco (COST +1.61%) rose after its December comparable-store sales figure topped analyst estimates.
On the data front, initial jobless claims came in at 214,000 in the most recent week, below the prior 222,000 figure. The update comes ahead of tomorrow’s monthly jobs report, which is anticipated to show the U.S. economy added 160,000 jobs in December. Treasuries modestly strengthened with the yield on the 10-year note off one basis point to 1.85%. In commodities, WTI crude dipped 0.1% to $59.56/barrel, giving up all of its gains following the U.S. killing of an Iranian general. COMEX gold retreated 0.5% to $1,552.40/ounce.
|
 Kenneth J. Gruneisen started out as a licensed stockbroker in August 1987, a couple of months prior to the historic stock market crash that took the Dow Jones Industrial Average down -22.6% in a single day. He has published daily fact-based fundamental and technical analysis on high-ranked stocks online for two decades. Through FACTBASEDINVESTING.COM, Kenneth provides educational articles, news, market commentary, and other information regarding proven investment systems that work in good times and bad.
Comments contained in the body of this report are technical opinions only and are not necessarily those of Gruneisen Growth Corp. The material herein has been obtained from sources believed to be reliable and accurate, however, its accuracy and completeness cannot be guaranteed. Our firm, employees, and customers may effect transactions, including transactions contrary to any recommendation herein, or have positions in the securities mentioned herein or options with respect thereto. Any recommendation contained in this report may not be suitable for all investors and it is not to be deemed an offer or solicitation on our part with respect to the purchase or sale of any securities. |
|
 |
Retail, Financial, Energy, and Tech Groups Rose
Kenneth J. Gruneisen - Passed the CAN SLIM® Master's Exam
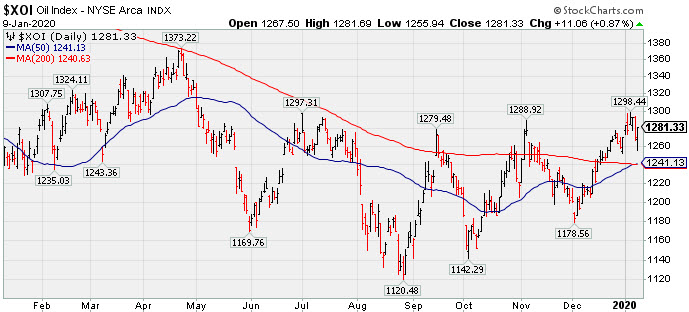
The Oil Services Index ($OSX 0.91%) and the Integrated Oil Index ($XOI +0.87%) posted solid gains. Financial shares had a positive bias as the Broker/Dealer Index ($XBD +0.68%) and the Bank Index ($BKX +0.55%) both rose along with the Retail Index ($RLX +0.67%). The tech sector was led higher by the Biotech Index ($BTK +0.60%) and the Semiconductor Index ($SOX +0.60%) while the Networking Index ($NWX -0.17%) finished slightly in the red. The Gold & Silver Index ($XAU -1.16%) was a standout decliner.
PICTURED: The Integrated Oil Index ($XOI +0.87%) graph shows it consolidating above its 50-day and 200-day moving average lines which have made a positive convergence, termed a "golden cross" by some technical analysts.
| Oil Services |
$OSX |
77.65 |
+0.70 |
+0.91% |
-0.82% |
| Integrated Oil |
$XOI |
1,281.33 |
+11.06 |
+0.87% |
+0.85% |
| Semiconductor |
$SOX |
1,878.73 |
+11.14 |
+0.60% |
+1.57% |
| Networking |
$NWX |
583.24 |
-1.02 |
-0.17% |
-0.03% |
| Broker/Dealer |
$XBD |
296.10 |
+2.01 |
+0.68% |
+1.97% |
| Retail |
$RLX |
2,492.92 |
+16.64 |
+0.67% |
+1.78% |
| Gold & Silver |
$XAU |
100.69 |
-1.18 |
-1.16% |
-5.83% |
| Bank |
$BKX |
112.35 |
+0.61 |
+0.55% |
-0.89% |
| Biotech |
$BTK |
5,142.59 |
+34.74 |
+0.68% |
+1.48% |
|
|
|
 |
Perched at All-Time High After Gains Lacking Great Volume
Kenneth J. Gruneisen - Passed the CAN SLIM® Master's Exam
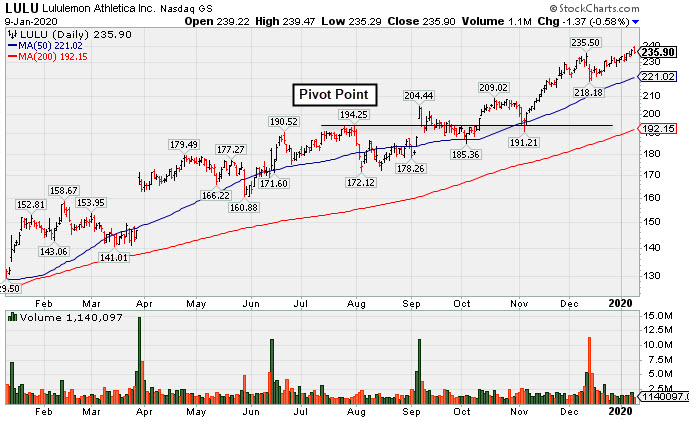
Lululemon Athletica (LULU-$1.37 or -0.58% to $235.90) reversed into the red today after recently wedging to new all-time highs with gains lacking great volume conviction. It is very extended from any sound base. Its 50-day moving average (DMA) line ($221.02) and prior low ($218.18 on 12/12/19) define important near-term support levels to watch on pullbacks. LULU was last shown in this FSU section was on 12/17/19 with an annotated graph under the headline, "Retreated From High After Another Strong Earnings Report". It reported earnings +28% on +23% sales revenues for the Oct '19 quarter. LULU has reported 8 consecutive quarterly earnings comparisons above the +25% minimum guideline (C criteria). It currently has a 96 Earnings Per Share Rating. Its Timeliness rating is A and Sponsorship rating is C. The current Up/Down Volume Ratio of 1.1 is an unbiased indication its shares have been under slight accumulation over the past 50 days. The number of top-rated funds owning its shares rose from 1,041 in Jun '18 to 1,443 in Sep '19, a good sign concerning the I criteria. It has a new CEO as of 8/20/18. LULU was first featured in yellow at $23.83 (split adjusted after 2:1 split effective 7/21/11) in the October 8, 2010 mid-day report (read here) and it traded up as much as +163.7% in a little more than 9 months. As previously noted - "In a bullish market, many high-ranked leaders offer multiple opportunities to accumulate their shares under the fact-based system's strict guidelines. Patience may often allow another ideal base or secondary buy point to possibly develop and be noted." Charts courtesy of www.stockcharts.com
 |
|
|
Color Codes Explained :
Y - Better candidates highlighted by our
staff of experts.
G - Previously featured
in past reports as yellow but may no longer be buyable under the
guidelines.
***Last / Change / Volume data in this table is the closing quote data***
Symbol/Exchange
Company Name
Industry Group |
PRICE |
CHANGE
(%Change) |
Day High |
Volume
(% DAV)
(% 50 day avg vol) |
52 Wk Hi
% From Hi |
Featured
Date |
Price
Featured |
Pivot Featured |
|
Max Buy |
 MLR
-
NYSE
MLR
-
NYSE
Miller Industries Inc
AUTOMOTIVE - Auto Parts
|
$35.93
|
-0.20
-0.55% |
$36.27
|
24,079
56.00% of 50 DAV
50 DAV is 43,000
|
$38.18
-5.89%
|
9/24/2019
|
$34.00
|
PP = $35.36
|
|
MB = $37.13
|
Most Recent Note - 1/8/2020 12:49:28 PM
G - Consolidating near its 50 DMA line ($36.39) and above prior highs in the $35 area which define important support to watch. Resilient after reporting Sep '19 earnings which were below the fundamental guidelines of the fact-based investment system.
>>> FEATURED STOCK ARTICLE : Towing/Recovery Equipment Firm Remains Perched Near Record High - 12/27/2019 |
View all notes |
Set NEW NOTE alert |
Company Profile |
SEC
News |
Chart |
Request a new note
C
A
S
I |
CCBG
-
NASDAQ
Capital City Bk Gp
BANKING - Regional - Mid-Atlantic Banks
|
$29.33
|
-0.29
-0.98% |
$29.81
|
19,958
44.35% of 50 DAV
50 DAV is 45,000
|
$30.95
-5.23%
|
12/16/2019
|
$30.07
|
PP = $30.95
|
|
MB = $32.50
|
Most Recent Note - 1/8/2020 12:47:26 PM
Y - Consolidating near its 50 DMA line ($29.58) after meeting resistance at its 52-week high. Subsequent gains and a strong close above the new pivot point cited based on its 11/06/19 high plus 10 cents may trigger a new (or add-on) technical buy signal. Prior low ($28.16 on 12/03/19) defines the next important support level.
>>> FEATURED STOCK ARTICLE : Perched Near 52-Week High After Forming an Orderly Base - 1/2/2020 |
View all notes |
Set NEW NOTE alert |
Company Profile |
SEC
News |
Chart |
Request a new note
C
A
S
I |
FTNT
-
NASDAQ
Fortinet Inc
Computer Sftwr-Security
|
$114.48
|
+0.81
0.71% |
$115.78
|
1,062,860
77.64% of 50 DAV
50 DAV is 1,369,000
|
$114.40
0.07%
|
12/9/2019
|
$103.85
|
PP = $106.10
|
|
MB = $111.41
|
Most Recent Note - 1/6/2020 5:56:39 PM
G - Hit a new 52-week high with today's 3rd consecutive gain marked by average volume. Color code is changed to green after wedging above its "max buy" level. Its 50 DMA line ($100.73) and prior low ($99.78 on 12/03/19) define important near-term support to watch.
>>> FEATURED STOCK ARTICLE : Endured Distributional Pressure While Perched at High - 12/23/2019 |
View all notes |
Set NEW NOTE alert |
Company Profile |
SEC
News |
Chart |
Request a new note
C
A
S
I |
SPSC
-
NASDAQ
S P S Commerce Inc
COMPUTER SOFTWARE and SERVICES - Application Software
|
$56.22
|
+0.12
0.21% |
$56.68
|
109,854
59.90% of 50 DAV
50 DAV is 183,400
|
$59.14
-4.94%
|
11/29/2019
|
$56.59
|
PP = $59.24
|
|
MB = $62.20
|
Most Recent Note - 1/8/2020 12:53:23 PM
Y - Still perched only -4.9% off its all-time high. Subsequent gains above its pivot point backed by at least +40% above average volume are needed to trigger a new technical buy signal. Fundamentals remain strong, however, its Relative Strength Rating of 79 is just below the 80+ minimum guideline for buy candidates.
>>> FEATURED STOCK ARTICLE : Perched Within Close Striking Distance of 52-Week High - 12/20/2019 |
View all notes |
Set NEW NOTE alert |
Company Profile |
SEC
News |
Chart |
Request a new note
C
A
S
I |
AUDC
-
NASDAQ
Audiocodes Ltd
ELECTRONICS - Scientific and Technical Instrum
|
$25.50
|
+0.03
0.12% |
$25.80
|
131,157
46.84% of 50 DAV
50 DAV is 280,000
|
$26.68
-4.42%
|
9/13/2019
|
$19.68
|
PP = $19.84
|
|
MB = $20.83
|
Most Recent Note - 1/6/2020 5:50:56 PM
G - Suffered a large loss today with above average volume indicative of distributional pressure. Extended from the previously noted base. Its 50 DMA line ($23.33) defines support above with prior highs in the $22 area. Fundamentals remain strong. See the latest FSU analysis for more details and a new annotated graph.
>>> FEATURED STOCK ARTICLE : Large Loss With Higher Volume Indicates Distributional Pressure - 1/6/2020 |
View all notes |
Set NEW NOTE alert |
Company Profile |
SEC
News |
Chart |
Request a new note
C
A
S
I |
Symbol/Exchange
Company Name
Industry Group |
PRICE |
CHANGE
(%Change) |
Day High |
Volume
(% DAV)
(% 50 day avg vol) |
52 Wk Hi
% From Hi |
Featured
Date |
Price
Featured |
Pivot Featured |
|
Max Buy |
CHDN
-
NASDAQ
Churchill Downs Inc
LEISURE - Gaming Activities
|
$137.19
|
+1.58
1.16% |
$137.67
|
159,370
62.74% of 50 DAV
50 DAV is 254,000
|
$138.17
-0.71%
|
10/8/2019
|
$129.77
|
PP = $132.83
|
|
MB = $139.47
|
Most Recent Note - 1/6/2020 5:53:44 PM
G - Pulled back for a 4th consecutive loss today with lighter volume while still hovering near its 52-week high. Its 50 DMA line ($130.98) defines near-term support above the prior low ($121.81 on 11/07/19) The Jun and Sep '19 quarterly earnings versus the year ago periods were both below the +25% minimum guideline (C criteria) and raised fundamental concerns.
>>> FEATURED STOCK ARTICLE : Touched a New HIgh With Gains Backed by Light Volume - 12/30/2019 |
View all notes |
Set NEW NOTE alert |
Company Profile |
SEC
News |
Chart |
Request a new note
C
A
S
I |
LULU
-
NASDAQ
Lululemon Athletica
MANUFACTURING - Textile Manufacturing
|
$235.90
|
-1.37
-0.58% |
$239.47
|
1,097,264
53.47% of 50 DAV
50 DAV is 2,052,000
|
$238.01
-0.89%
|
9/6/2019
|
$201.25
|
PP = $194.35
|
|
MB = $204.07
|
 Most Recent Note - 1/9/2020 5:30:00 PM
G - Reversed into the red today after recently wedging to new highs with gains backed by light volume. Very extended from any sound base. Its 50 DMA line and prior low ($218.18 on 12/12/19) define important near-term support to watch. Recently reported earnings +28% on +23% sales revenues for the Oct '19 quarter. See the latest FSU analysis for more details and a new annotated graph.
>>> FEATURED STOCK ARTICLE : Perched at All-Time High After Gains Lacking Great Volume - 1/9/2020 |
View all notes |
Set NEW NOTE alert |
Company Profile |
SEC
News |
Chart |
Request a new note
C
A
S
I |
CPRT
-
NASDAQ
Copart Inc
SPECIALTY RETAIL - Auto Dealerships
|
$95.29
|
+1.28
1.36% |
$95.89
|
1,289,108
70.64% of 50 DAV
50 DAV is 1,825,000
|
$94.48
0.86%
|
1/2/2020
|
$92.80
|
PP = $92.51
|
|
MB = $97.14
|
Most Recent Note - 1/7/2020 5:52:57 PM
Y - Posted a gain on for a new all-time high on 1/02/20 with +45% above average volume to trigger a proper new (or add-on) technical buy signal, clearing the pivot point cited based on its 11/25/19 high plus 10 cents. Its 50 DMA line ($87.51) defines near-term support. Fundamentals remain strong. See the latest FSU analysis for more details and a new annotated graph.
>>> FEATURED STOCK ARTICLE : Perched at All-Time HIgh Following Recent Volume-Driven Gain - 1/7/2020 |
View all notes |
Set NEW NOTE alert |
Company Profile |
SEC
News |
Chart |
Request a new note
C
A
S
I |
NMIH
-
NASDAQ
N M I Holdings Inc Cl A
Finance-MrtgandRel Svc
|
$32.10
|
+0.02
0.06% |
$32.59
|
352,726
67.70% of 50 DAV
50 DAV is 521,000
|
$35.79
-10.31%
|
11/8/2019
|
$32.89
|
PP = $31.44
|
|
MB = $33.01
|
Most Recent Note - 1/8/2020 12:44:17 PM
G - Still sputtering below its 50 DMA line ($32.66). Only a prompt rebound above the 50 DMA line would help its outlook improve. Prior highs in the $30-31 area define the next important near-term support. Fundamentals remain strong.
>>> FEATURED STOCK ARTICLE : Hit New High But Encountered Distributional Pressure - 12/19/2019 |
View all notes |
Set NEW NOTE alert |
Company Profile |
SEC
News |
Chart |
Request a new note
C
A
S
I |
SPLK
-
NASDAQ
Splunk Inc
Computer Sftwr-Database
|
$154.52
|
-1.24
-0.80% |
$157.66
|
1,354,745
68.11% of 50 DAV
50 DAV is 1,989,000
|
$156.75
-1.42%
|
11/25/2019
|
$147.79
|
PP = $142.16
|
|
MB = $149.27
|
Most Recent Note - 1/8/2020 5:38:11 PM
G - Hit another new high with today's gain backed by average volume, getting more extended from the previously noted base. Prior highs in the $142-143 area define initial support to watch above its 50 DMA line ($138.91) on pullbacks. See the latest FSU analysis for more details and a new annotated graph.
>>> FEATURED STOCK ARTICLE : New High Hit With Another Gain on Near Average Volume - 1/8/2020 |
View all notes |
Set NEW NOTE alert |
Company Profile |
SEC
News |
Chart |
Request a new note
C
A
S
I |
Symbol/Exchange
Company Name
Industry Group |
PRICE |
CHANGE
(%Change) |
Day High |
Volume
(% DAV)
(% 50 day avg vol) |
52 Wk Hi
% From Hi |
Featured
Date |
Price
Featured |
Pivot Featured |
|
Max Buy |
PAYC
-
NYSE
Paycom Software Inc
COMPUTER SOFTWARE and SERVICES - Application Software
|
$285.29
|
+2.17
0.77% |
$287.83
|
501,305
92.49% of 50 DAV
50 DAV is 542,000
|
$286.64
-0.47%
|
11/20/2019
|
$252.97
|
PP = $259.81
|
|
MB = $272.80
|
Most Recent Note - 1/6/2020 6:01:52 PM
G - Posted a 4th consecutive gain with light volume. Color code is changed to green after rising above its "max buy" level. Fundamentals remain strong.
>>> FEATURED STOCK ARTICLE : Perched Near High and Near the Max Buy Level - 1/3/2020 |
View all notes |
Set NEW NOTE alert |
Company Profile |
SEC
News |
Chart |
Request a new note
C
A
S
I |
BLD
-
NYSE
Topbuild Corp
Bldg-Constr Prds/Misc
|
$104.93
|
-1.27
-1.20% |
$107.32
|
284,193
95.37% of 50 DAV
50 DAV is 298,000
|
$113.74
-7.75%
|
12/9/2019
|
$109.71
|
PP = $113.84
|
|
MB = $119.53
|
Most Recent Note - 1/6/2020 5:52:03 PM
G - Still quietly lingering below its 50 DMA line. A rebound above its 50 DMA line ($106.11) is needed for its outlook to improve.
>>> FEATURED STOCK ARTICLE : Recent Slump Below 50-Day Moving Average Did Technical Damage - 12/24/2019 |
View all notes |
Set NEW NOTE alert |
Company Profile |
SEC
News |
Chart |
Request a new note
C
A
S
I |
GLOB
-
NYSE
Globant SA
Computer-Tech Services
|
$113.25
|
+0.39
0.35% |
$115.60
|
175,203
65.62% of 50 DAV
50 DAV is 267,000
|
$113.48
-0.20%
|
11/14/2019
|
$106.87
|
PP = $112.43
|
|
MB = $118.05
|
Most Recent Note - 1/8/2020 12:42:58 PM
Y - Hitting a new high with today's gain thus far lacking great volume conviction. Gains above the pivot point backed by at least +40% above average volume are needed to trigger a proper technical buy signal. Its 50 DMA line ($102.21) defines important near-term support to watch on pullbacks. Fundamentals remain strong.
>>> FEATURED STOCK ARTICLE : Rebound Has Globant Perched Within Striking Distance of High - 12/26/2019 |
View all notes |
Set NEW NOTE alert |
Company Profile |
SEC
News |
Chart |
Request a new note
C
A
S
I |
|
|
|
THESE ARE NOT BUY RECOMMENDATIONS!
Comments contained in the body of this report are technical
opinions only. The material herein has been obtained
from sources believed to be reliable and accurate, however,
its accuracy and completeness cannot be guaranteed.
This site is not an investment advisor, hence it does
not endorse or recommend any securities or other investments.
Any recommendation contained in this report may not
be suitable for all investors and it is not to be deemed
an offer or solicitation on our part with respect to
the purchase or sale of any securities. All trademarks,
service marks and trade names appearing in this report
are the property of their respective owners, and are
likewise used for identification purposes only.
This report is a service available
only to active Paid Premium Members.
You may opt-out of receiving report notifications
at any time. Questions or comments may be submitted
by writing to Premium Membership Services 665 S.E. 10 Street, Suite 201 Deerfield Beach, FL 33441-5634 or by calling 1-800-965-8307
or 954-785-1121.
|
|
|