You are not logged in.
This means you
CAN ONLY VIEW reports that were published prior to Sunday, February 25, 2024.
You
MUST UPGRADE YOUR MEMBERSHIP if you want to see any current reports.
AFTER MARKET UPDATE - WEDNESDAY, JANUARY 8TH, 2020
Previous After Market Report Next After Market Report >>>
|
|
|
|
DOW |
+161.41 |
28,745.09 |
+0.56% |
|
Volume |
895,976,190 |
+13% |
|
Volume |
2,442,914,090 |
+4% |
|
NASDAQ |
+60.66 |
9,129.24 |
+0.67% |
|
Advancers |
1,630 |
58% |
|
Advancers |
1,859 |
58% |
|
S&P 500 |
+15.87 |
3,253.05 |
+0.49% |
|
Decliners |
1,189 |
42% |
|
Decliners |
1,328 |
42% |
|
Russell 2000 |
+5.29 |
1,663.59 |
+0.32% |
|
52 Wk Highs |
213 |
|
|
52 Wk Highs |
212 |
|
|
S&P 600 |
+2.42 |
1,016.51 |
+0.24% |
|
52 Wk Lows |
11 |
|
|
52 Wk Lows |
19 |
|
|
 |
Major indices Rose With Greater Volume as Leadership Improved
Kenneth J. Gruneisen - Passed the CAN SLIM® Master's Exam
The Dow added 161 points. The S&P 500 advanced 0.5%, while the Nasdaq Composite jumped 0.7% and recorded fresh record highs. Advancers led decliners by a 4-3 margin on the NYSE and 3-2 on the Nasdaq exchange. The reported volume was higher than the prior session totals on the NYSE and on the Nasdaq exchange, a sign that institutional investors had a greater appetite for buying stocks. There were 78 high-ranked companies from the Leaders List that hit a new 52-week high and were listed on the BreakOuts Page, versus the total of 53 on the prior session. New 52-week highs totals expanded and easily outnumbered new 52-week lows totals on the NYSE and on the Nasdaq exchange. The major indices (M criteria) are in a "confirmed uptrend" after enduring distributional pressure in recent weeks. The Featured Stocks Page provides the most timely analysis on high-ranked leaders. Charts used courtesy of www.stockcharts.com
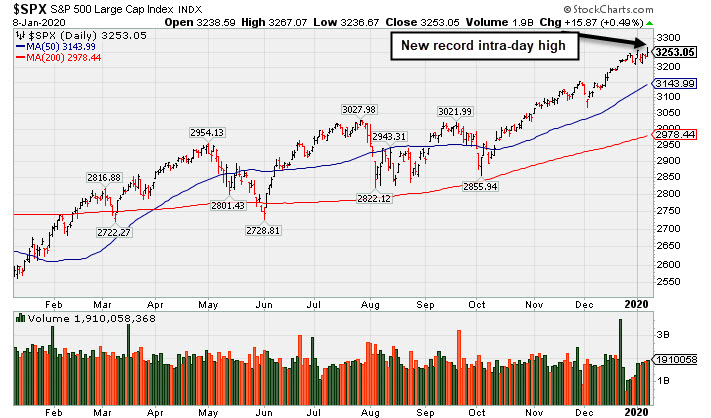
PICTURED: The S&P 500 Index hit a new record high intra-day.
Stocks finished higher Wednesday as investors assessed geopolitical developments in the Middle East. Overnight, volatility spiked as S&P 500 futures slid more than 1.5% following an Iranian missile attack on two U.S. military bases in Iraq. However, risk assets rebounded amid reports of no American casualties and an optimistic speech from President Trump. During the address he called for peace saying “Iran appears to be standing down” and that the U.S. will impose economic sanctions rather than military action.
Treasuries weakened, with the yield on the 10-year note adding four basis points to 1.86% after sliding as low as 1.70% overnight. In commodities, WTI crude tumbled 4.9% to $59.61/barrel amid the deescalating U.S.-Iranian tensions. COMEX gold lost 0.8% to $1,561.00/ounce after advancing to its highest level since 2013 overnight.
On the data front, the ADP employment report showed 202,000 private jobs were added to the U.S. economy in December, the most since April, while the prior figure was upwardly revised to 124,000 from an initial 67,000 print. Separately, mortgage applications jumped 13.5% in the most recent week.
In corporate news, Boeing (BA -1.7%) fell on news of a fatal 737-800 crash in Iran. Walgreens Boots Alliance (WBA -5.84%) fell after missing estimates on both the top and bottom line. Elsewhere, Constellation Brands (STZ +3.64%) rose after the alcohol distributor posted a strong earnings report and boosting full year guidance.
|
 Kenneth J. Gruneisen started out as a licensed stockbroker in August 1987, a couple of months prior to the historic stock market crash that took the Dow Jones Industrial Average down -22.6% in a single day. He has published daily fact-based fundamental and technical analysis on high-ranked stocks online for two decades. Through FACTBASEDINVESTING.COM, Kenneth provides educational articles, news, market commentary, and other information regarding proven investment systems that work in good times and bad.
Comments contained in the body of this report are technical opinions only and are not necessarily those of Gruneisen Growth Corp. The material herein has been obtained from sources believed to be reliable and accurate, however, its accuracy and completeness cannot be guaranteed. Our firm, employees, and customers may effect transactions, including transactions contrary to any recommendation herein, or have positions in the securities mentioned herein or options with respect thereto. Any recommendation contained in this report may not be suitable for all investors and it is not to be deemed an offer or solicitation on our part with respect to the purchase or sale of any securities. |
|
 |
Gold & Silver Index and Energy-Linked Groups Fell
Kenneth J. Gruneisen - Passed the CAN SLIM® Master's Exam
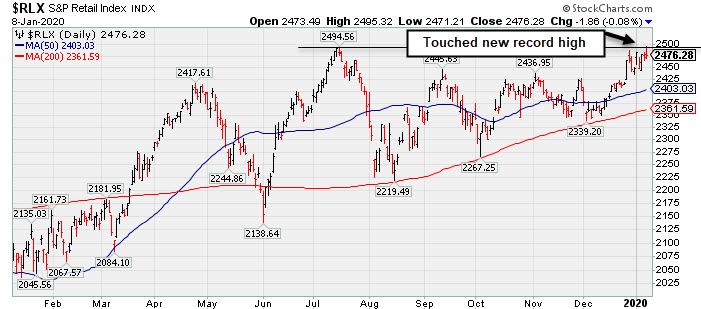
The Gold & Silver Index ($XAU -4.09%) was a standout decliner while the Oil Services Index ($OSX -3.29%) and the Integrated Oil Index ($XOI -1.79%) also fell. Financial shares had a positive bias as the Broker/Dealer Index ($XBD +0.99%) and the Bank Index ($BKX +0.57%) both rose. The Retail Index ($RLX -0.08%) finished flat again. The tech sector was led higher by the Biotech Index ($BTK +1.11%) while the Networking Index ($NWX +0.26%) posted a smaller gain and the Semiconductor Index ($SOX +0.02%) finished flat.
PICTURED: The Retail Index ($RLX -0.08%) graph shows it hit a new multi-year high but ended the session slightly lower.
| Oil Services |
$OSX |
76.95 |
-2.62 |
-3.29% |
-1.71% |
| Integrated Oil |
$XOI |
1,270.27 |
-23.15 |
-1.79% |
-0.02% |
| Semiconductor |
$SOX |
1,867.59 |
+0.31 |
+0.02% |
+0.97% |
| Networking |
$NWX |
584.26 |
+1.53 |
+0.26% |
+0.15% |
| Broker/Dealer |
$XBD |
294.09 |
+2.89 |
+0.99% |
+1.28% |
| Retail |
$RLX |
2,476.28 |
-1.86 |
-0.08% |
+1.10% |
| Gold & Silver |
$XAU |
101.87 |
-4.34 |
-4.09% |
-4.72% |
| Bank |
$BKX |
111.74 |
+0.63 |
+0.57% |
-1.43% |
| Biotech |
$BTK |
5,107.85 |
+56.26 |
+1.11% |
+0.80% |
|
|
|
 |
New High Hit With Another Gain on Near Average Volume
Kenneth J. Gruneisen - Passed the CAN SLIM® Master's Exam
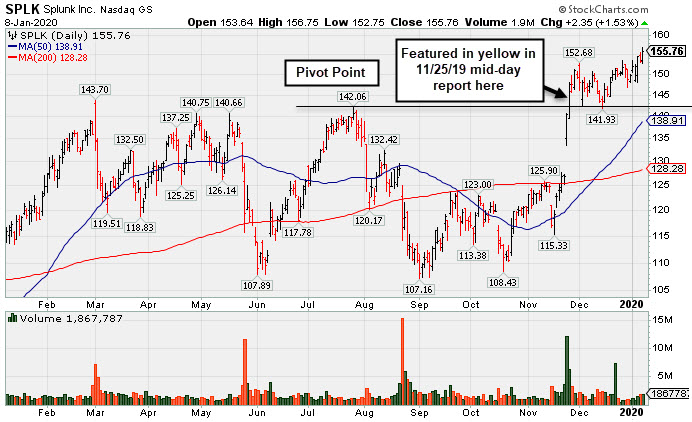
Splunk Inc (SPLK $155.76 +$2.35 +1.53%) posted a gain with average volume today for a new all-time high. Its color code was changed to green after recently rallying back above its "max buy" level. On pullbacks the prior highs in the $142-143 area define initial support to watch above its 50-day moving average (DMA) line ($138.91).
SPLK finished strong after highlighted in to yellow with pivot point cited based on its 7/26/19 high plus 10 cents in the 11/25/19 mid-day report (read here). Volume was +349% above average behind the big gain today and the strong close above the pivot point clinched a convincing new technical buy signal.
Fundamentals remain strong. Bullish action came as it gapped up on 11/22/19 after reporting earnings +53% on +30% sales revenues versus the year ago period ended October 31st. Quarterly comparisons have been above the +25% minimum guideline (C criteria). Annual earnings history has been strong. The high-ranked Computer Software - Database firm has earned an 99 earnings Per Share Rating, well above the 80+ minimum guideline for buy candidates. Its annual earnings (A criteria) history has been strong since reaching profitability in FY '15.
It was last shown in this FSU section on 12/16/19 with an annotated graph under the headline, "Consolidating Above Prior Highs Following Impressive Rally". The number of top-rated funds owning its shares rose from 748 in Jun '17 to 1,173 in Sep '19, a reassuring sign concerning the I criteria. The current Up/Down Volume Ratio of 1.9 is an unbiased indication its shares have been under accumulation over the past 50 days. Its Timeliness Rating is A and Sponsorship Rating is B. |
|
|
Color Codes Explained :
Y - Better candidates highlighted by our
staff of experts.
G - Previously featured
in past reports as yellow but may no longer be buyable under the
guidelines.
***Last / Change / Volume data in this table is the closing quote data***
Symbol/Exchange
Company Name
Industry Group |
PRICE |
CHANGE
(%Change) |
Day High |
Volume
(% DAV)
(% 50 day avg vol) |
52 Wk Hi
% From Hi |
Featured
Date |
Price
Featured |
Pivot Featured |
|
Max Buy |
 MLR
-
NYSE
MLR
-
NYSE
Miller Industries Inc
AUTOMOTIVE - Auto Parts
|
$36.13
|
-0.23
-0.63% |
$36.53
|
20,246
46.01% of 50 DAV
50 DAV is 44,000
|
$38.18
-5.37%
|
9/24/2019
|
$34.00
|
PP = $35.36
|
|
MB = $37.13
|
 Most Recent Note - 1/8/2020 12:49:28 PM
G - Consolidating near its 50 DMA line ($36.39) and above prior highs in the $35 area which define important support to watch. Resilient after reporting Sep '19 earnings which were below the fundamental guidelines of the fact-based investment system.
>>> FEATURED STOCK ARTICLE : Towing/Recovery Equipment Firm Remains Perched Near Record High - 12/27/2019 |
View all notes |
Set NEW NOTE alert |
Company Profile |
SEC
News |
Chart |
Request a new note
C
A
S
I |
CCBG
-
NASDAQ
Capital City Bk Gp
BANKING - Regional - Mid-Atlantic Banks
|
$29.62
|
+0.15
0.51% |
$29.83
|
31,382
69.74% of 50 DAV
50 DAV is 45,000
|
$30.95
-4.30%
|
12/16/2019
|
$30.07
|
PP = $30.95
|
|
MB = $32.50
|
Most Recent Note - 1/8/2020 12:47:26 PM
Y - Consolidating near its 50 DMA line ($29.58) after meeting resistance at its 52-week high. Subsequent gains and a strong close above the new pivot point cited based on its 11/06/19 high plus 10 cents may trigger a new (or add-on) technical buy signal. Prior low ($28.16 on 12/03/19) defines the next important support level.
>>> FEATURED STOCK ARTICLE : Perched Near 52-Week High After Forming an Orderly Base - 1/2/2020 |
View all notes |
Set NEW NOTE alert |
Company Profile |
SEC
News |
Chart |
Request a new note
C
A
S
I |
FTNT
-
NASDAQ
Fortinet Inc
Computer Sftwr-Security
|
$113.67
|
+1.78
1.59% |
$114.40
|
1,388,815
101.97% of 50 DAV
50 DAV is 1,362,000
|
$112.51
1.03%
|
12/9/2019
|
$103.85
|
PP = $106.10
|
|
MB = $111.41
|
Most Recent Note - 1/6/2020 5:56:39 PM
G - Hit a new 52-week high with today's 3rd consecutive gain marked by average volume. Color code is changed to green after wedging above its "max buy" level. Its 50 DMA line ($100.73) and prior low ($99.78 on 12/03/19) define important near-term support to watch.
>>> FEATURED STOCK ARTICLE : Endured Distributional Pressure While Perched at High - 12/23/2019 |
View all notes |
Set NEW NOTE alert |
Company Profile |
SEC
News |
Chart |
Request a new note
C
A
S
I |
SPSC
-
NASDAQ
S P S Commerce Inc
COMPUTER SOFTWARE and SERVICES - Application Software
|
$56.10
|
+0.31
0.56% |
$56.51
|
132,977
66.89% of 50 DAV
50 DAV is 198,800
|
$59.14
-5.14%
|
11/29/2019
|
$56.59
|
PP = $59.24
|
|
MB = $62.20
|
Most Recent Note - 1/8/2020 12:53:23 PM
Y - Still perched only -4.9% off its all-time high. Subsequent gains above its pivot point backed by at least +40% above average volume are needed to trigger a new technical buy signal. Fundamentals remain strong, however, its Relative Strength Rating of 79 is just below the 80+ minimum guideline for buy candidates.
>>> FEATURED STOCK ARTICLE : Perched Within Close Striking Distance of 52-Week High - 12/20/2019 |
View all notes |
Set NEW NOTE alert |
Company Profile |
SEC
News |
Chart |
Request a new note
C
A
S
I |
AUDC
-
NASDAQ
Audiocodes Ltd
ELECTRONICS - Scientific and Technical Instrum
|
$25.47
|
+0.52
2.08% |
$25.85
|
198,417
71.37% of 50 DAV
50 DAV is 278,000
|
$26.68
-4.54%
|
9/13/2019
|
$19.68
|
PP = $19.84
|
|
MB = $20.83
|
Most Recent Note - 1/6/2020 5:50:56 PM
G - Suffered a large loss today with above average volume indicative of distributional pressure. Extended from the previously noted base. Its 50 DMA line ($23.33) defines support above with prior highs in the $22 area. Fundamentals remain strong. See the latest FSU analysis for more details and a new annotated graph.
>>> FEATURED STOCK ARTICLE : Large Loss With Higher Volume Indicates Distributional Pressure - 1/6/2020 |
View all notes |
Set NEW NOTE alert |
Company Profile |
SEC
News |
Chart |
Request a new note
C
A
S
I |
Symbol/Exchange
Company Name
Industry Group |
PRICE |
CHANGE
(%Change) |
Day High |
Volume
(% DAV)
(% 50 day avg vol) |
52 Wk Hi
% From Hi |
Featured
Date |
Price
Featured |
Pivot Featured |
|
Max Buy |
CHDN
-
NASDAQ
Churchill Downs Inc
LEISURE - Gaming Activities
|
$135.61
|
+1.43
1.07% |
$137.27
|
263,599
102.97% of 50 DAV
50 DAV is 256,000
|
$138.17
-1.85%
|
10/8/2019
|
$129.77
|
PP = $132.83
|
|
MB = $139.47
|
Most Recent Note - 1/6/2020 5:53:44 PM
G - Pulled back for a 4th consecutive loss today with lighter volume while still hovering near its 52-week high. Its 50 DMA line ($130.98) defines near-term support above the prior low ($121.81 on 11/07/19) The Jun and Sep '19 quarterly earnings versus the year ago periods were both below the +25% minimum guideline (C criteria) and raised fundamental concerns.
>>> FEATURED STOCK ARTICLE : Touched a New HIgh With Gains Backed by Light Volume - 12/30/2019 |
View all notes |
Set NEW NOTE alert |
Company Profile |
SEC
News |
Chart |
Request a new note
C
A
S
I |
LULU
-
NASDAQ
Lululemon Athletica
MANUFACTURING - Textile Manufacturing
|
$237.27
|
+3.57
1.53% |
$238.01
|
1,855,247
91.17% of 50 DAV
50 DAV is 2,035,000
|
$236.85
0.18%
|
9/6/2019
|
$201.25
|
PP = $194.35
|
|
MB = $204.07
|
Most Recent Note - 1/6/2020 5:59:08 PM
G - Inched to a new high with today's gain backed by light volume, getting more extended from any sound base. Its 50 DMA line ($219.30) and prior low ($218.18 on 12/12/19) define important near-term support to watch. Recently reported earnings +28% on +23% sales revenues for the Oct '19 quarter.
>>> FEATURED STOCK ARTICLE : Retreated From High After Another Strong Earnings Report - 12/17/2019 |
View all notes |
Set NEW NOTE alert |
Company Profile |
SEC
News |
Chart |
Request a new note
C
A
S
I |
CPRT
-
NASDAQ
Copart Inc
SPECIALTY RETAIL - Auto Dealerships
|
$94.01
|
+0.64
0.69% |
$94.48
|
1,167,745
63.88% of 50 DAV
50 DAV is 1,828,000
|
$93.63
0.41%
|
1/2/2020
|
$92.80
|
PP = $92.51
|
|
MB = $97.14
|
Most Recent Note - 1/7/2020 5:52:57 PM
Y - Posted a gain on for a new all-time high on 1/02/20 with +45% above average volume to trigger a proper new (or add-on) technical buy signal, clearing the pivot point cited based on its 11/25/19 high plus 10 cents. Its 50 DMA line ($87.51) defines near-term support. Fundamentals remain strong. See the latest FSU analysis for more details and a new annotated graph.
>>> FEATURED STOCK ARTICLE : Perched at All-Time HIgh Following Recent Volume-Driven Gain - 1/7/2020 |
View all notes |
Set NEW NOTE alert |
Company Profile |
SEC
News |
Chart |
Request a new note
C
A
S
I |
NMIH
-
NASDAQ
N M I Holdings Inc Cl A
Finance-MrtgandRel Svc
|
$32.08
|
+0.30
0.94% |
$32.31
|
439,071
85.09% of 50 DAV
50 DAV is 516,000
|
$35.79
-10.37%
|
11/8/2019
|
$32.89
|
PP = $31.44
|
|
MB = $33.01
|
Most Recent Note - 1/8/2020 12:44:17 PM
G - Still sputtering below its 50 DMA line ($32.66). Only a prompt rebound above the 50 DMA line would help its outlook improve. Prior highs in the $30-31 area define the next important near-term support. Fundamentals remain strong.
>>> FEATURED STOCK ARTICLE : Hit New High But Encountered Distributional Pressure - 12/19/2019 |
View all notes |
Set NEW NOTE alert |
Company Profile |
SEC
News |
Chart |
Request a new note
C
A
S
I |
SPLK
-
NASDAQ
Splunk Inc
Computer Sftwr-Database
|
$155.76
|
+2.35
1.53% |
$156.75
|
1,867,787
94.72% of 50 DAV
50 DAV is 1,972,000
|
$155.72
0.03%
|
11/25/2019
|
$147.79
|
PP = $142.16
|
|
MB = $149.27
|
Most Recent Note - 1/8/2020 5:38:11 PM
G - Hit another new high with today's gain backed by average volume, getting more extended from the previously noted base. Prior highs in the $142-143 area define initial support to watch above its 50 DMA line ($138.91) on pullbacks. See the latest FSU analysis for more details and a new annotated graph.
>>> FEATURED STOCK ARTICLE : New High Hit With Another Gain on Near Average Volume - 1/8/2020 |
View all notes |
Set NEW NOTE alert |
Company Profile |
SEC
News |
Chart |
Request a new note
C
A
S
I |
Symbol/Exchange
Company Name
Industry Group |
PRICE |
CHANGE
(%Change) |
Day High |
Volume
(% DAV)
(% 50 day avg vol) |
52 Wk Hi
% From Hi |
Featured
Date |
Price
Featured |
Pivot Featured |
|
Max Buy |
PAYC
-
NYSE
Paycom Software Inc
COMPUTER SOFTWARE and SERVICES - Application Software
|
$283.12
|
+3.63
1.30% |
$286.64
|
530,569
97.89% of 50 DAV
50 DAV is 542,000
|
$282.60
0.18%
|
11/20/2019
|
$252.97
|
PP = $259.81
|
|
MB = $272.80
|
Most Recent Note - 1/6/2020 6:01:52 PM
G - Posted a 4th consecutive gain with light volume. Color code is changed to green after rising above its "max buy" level. Fundamentals remain strong.
>>> FEATURED STOCK ARTICLE : Perched Near High and Near the Max Buy Level - 1/3/2020 |
View all notes |
Set NEW NOTE alert |
Company Profile |
SEC
News |
Chart |
Request a new note
C
A
S
I |
BLD
-
NYSE
Topbuild Corp
Bldg-Constr Prds/Misc
|
$106.20
|
+1.48
1.41% |
$108.50
|
293,785
99.59% of 50 DAV
50 DAV is 295,000
|
$113.74
-6.63%
|
12/9/2019
|
$109.71
|
PP = $113.84
|
|
MB = $119.53
|
Most Recent Note - 1/6/2020 5:52:03 PM
G - Still quietly lingering below its 50 DMA line. A rebound above its 50 DMA line ($106.11) is needed for its outlook to improve.
>>> FEATURED STOCK ARTICLE : Recent Slump Below 50-Day Moving Average Did Technical Damage - 12/24/2019 |
View all notes |
Set NEW NOTE alert |
Company Profile |
SEC
News |
Chart |
Request a new note
C
A
S
I |
GLOB
-
NYSE
Globant SA
Computer-Tech Services
|
$112.86
|
+3.68
3.37% |
$113.48
|
226,297
84.44% of 50 DAV
50 DAV is 268,000
|
$112.33
0.47%
|
11/14/2019
|
$106.87
|
PP = $112.43
|
|
MB = $118.05
|
Most Recent Note - 1/8/2020 12:42:58 PM
Y - Hitting a new high with today's gain thus far lacking great volume conviction. Gains above the pivot point backed by at least +40% above average volume are needed to trigger a proper technical buy signal. Its 50 DMA line ($102.21) defines important near-term support to watch on pullbacks. Fundamentals remain strong.
>>> FEATURED STOCK ARTICLE : Rebound Has Globant Perched Within Striking Distance of High - 12/26/2019 |
View all notes |
Set NEW NOTE alert |
Company Profile |
SEC
News |
Chart |
Request a new note
C
A
S
I |
|
|
|
THESE ARE NOT BUY RECOMMENDATIONS!
Comments contained in the body of this report are technical
opinions only. The material herein has been obtained
from sources believed to be reliable and accurate, however,
its accuracy and completeness cannot be guaranteed.
This site is not an investment advisor, hence it does
not endorse or recommend any securities or other investments.
Any recommendation contained in this report may not
be suitable for all investors and it is not to be deemed
an offer or solicitation on our part with respect to
the purchase or sale of any securities. All trademarks,
service marks and trade names appearing in this report
are the property of their respective owners, and are
likewise used for identification purposes only.
This report is a service available
only to active Paid Premium Members.
You may opt-out of receiving report notifications
at any time. Questions or comments may be submitted
by writing to Premium Membership Services 665 S.E. 10 Street, Suite 201 Deerfield Beach, FL 33441-5634 or by calling 1-800-965-8307
or 954-785-1121.
|
|
|