You are not logged in.
This means you
CAN ONLY VIEW reports that were published prior to Tuesday, February 20, 2024.
You
MUST UPGRADE YOUR MEMBERSHIP if you want to see any current reports.
AFTER MARKET UPDATE - TUESDAY, JANUARY 8TH, 2019
Previous After Market Report Next After Market Report >>>
|
|
|
|
DOW |
+256.10 |
23,787.45 |
+1.09% |
|
Volume |
1,013,859,420 |
-0% |
|
Volume |
2,361,528,960 |
-6% |
|
NASDAQ |
+73.53 |
6,897.00 |
+1.08% |
|
Advancers |
2,324 |
77% |
|
Advancers |
2,105 |
68% |
|
S&P 500 |
+24.72 |
2,574.41 |
+0.97% |
|
Decliners |
682 |
23% |
|
Decliners |
975 |
32% |
|
Russell 2000 |
+21.19 |
1,426.55 |
+1.51% |
|
52 Wk Highs |
14 |
|
|
52 Wk Highs |
32 |
|
|
S&P 600 |
+13.02 |
887.50 |
+1.49% |
|
52 Wk Lows |
10 |
|
|
52 Wk Lows |
18 |
|
|
 |
Major Indices Posted Gains as New Highs Showed Slight Increase
Kenneth J. Gruneisen - Passed the CAN SLIM® Master's Exam
Stocks finished higher Tuesday. The Dow climbed 256 points to 23,787 while the S&P 500 gained 24 points to 2,574. The Nasdaq Composite added 73 points to 6,897. The volume totals were lighter than the prior session totals on the NYSE and on the Nasdaq exchange. Advancers led decliners by more than a 3-1 margin on the NYSE and more than a 2-1 margin on the Nasdaq exchange. Leadership remained elusive as only 4 high-ranked companies from the Leaders List made new 52-week highs and were listed on the BreakOuts Page, up from 3 on the prior session. There was an increase in new 52-week highs on both the NYSE and on the Nasdaq exchange versus the prior session. New 52-week highs outnumbered new 52-week lows on the Nasdaq exchange and on the NYSE. The newspaper reported that Friday's session was a follow-through day and the major indices are in a confirmed uptrend. Disciplined investors know that a proper follow-through day requires big gains from at least one of the major indices with higher volume and an expansion in leadership (stocks hitting new highs). New leadership was a critical missing element on Friday, however, additional confirmation on Monday and Tuesday has helped to signal a change in market direction (M criteria) back to a bullish stance. The Featured Stocks Page provides the most timely analysis on high-ranked leaders. Charts used courtesy of www.stockcharts.com
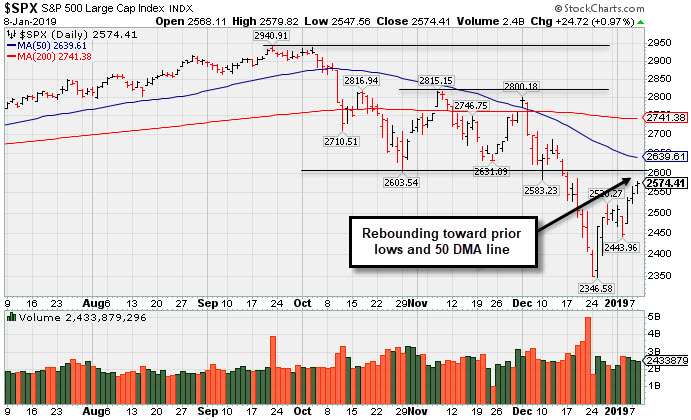
PICTURED: The S&P 500 Index is rebounding toward prior lows and it remains well below its 50-day and 200-day moving average (DMA) lines.
The major averages advanced for the third consecutive session amid optimism on the trade front. Earlier, President Trump tweeted “talks with China are going very well”, while U.S. Commerce Secretary Wilbur Ross commented yesterday that Beijing and Washington could reach a trade deal that "we can live with." On the data front, a report showed that the gauge for small business optimism climbed unexpectedly in December, but remains at the lowest level since 2016. In a separate release, the job opening and labor turnover survey (JOLTS) showed U.S. employers had 6.9 million openings in November, down from the prior month’s upwardly revised 7.1 million. An update on consumer credit showed Americans borrowed more-than-expected in November.
Ten of 11 S&P 500 sectors ended higher. Communication Services outperformed with Facebook (FB +3.3%) rising. The oft-cited FAANG group helped boost markets, gaining 1.8% on the session. Industrials were lifted as Union Pacific (UNP +8.76%) rose after hiring an industry veteran as its COO.
Treasuries weakened with the yield on the 10-year note up four basis points to 2.73%. In commodities, WTI crude added 1.2% to $49.69/barrel, extending its longest rally since 2017. COMEX gold fell 0.3% to $1,286.30/ounce amid a stronger dollar. |
 Kenneth J. Gruneisen started out as a licensed stockbroker in August 1987, a couple of months prior to the historic stock market crash that took the Dow Jones Industrial Average down -22.6% in a single day. He has published daily fact-based fundamental and technical analysis on high-ranked stocks online for two decades. Through FACTBASEDINVESTING.COM, Kenneth provides educational articles, news, market commentary, and other information regarding proven investment systems that work in good times and bad.
Comments contained in the body of this report are technical opinions only and are not necessarily those of Gruneisen Growth Corp. The material herein has been obtained from sources believed to be reliable and accurate, however, its accuracy and completeness cannot be guaranteed. Our firm, employees, and customers may effect transactions, including transactions contrary to any recommendation herein, or have positions in the securities mentioned herein or options with respect thereto. Any recommendation contained in this report may not be suitable for all investors and it is not to be deemed an offer or solicitation on our part with respect to the purchase or sale of any securities. |
|
 |
Retail, Biotech, Networking, and Oil Services Indexes Led Gainers
Kenneth J. Gruneisen - Passed the CAN SLIM® Master's Exam
The Retail Index ($RLX +1.10%) posted a solid gain, meanwhile the Broker/Dealer Index ($XBD +0.66%) edged higher and the Bank Index ($BKX +0.11%) posted a smaller gain. The Biotech Index ($BTK +1.91%) and Networking Index ($NWX +1.01%) both led the tech sector higher while the Semiconductor Index ($SOX -0.49%) edged lower. The Oil Services Index ($OSX +1.21%) and the Integrated Oil Index ($XOI +0.52%) posted small gains and the Gold & Silver Index ($XAU +0.38%) also edged higher.
Charts courtesy of www.stockcharts.com
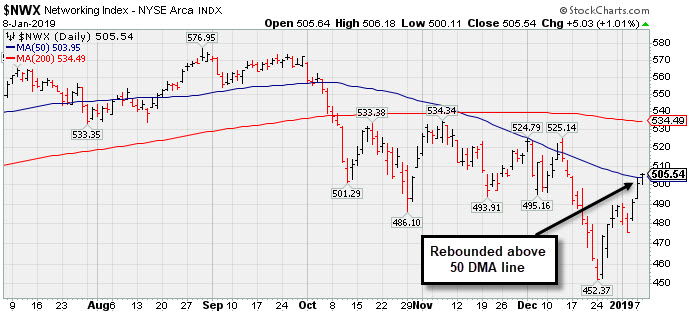 PICTURED: The Networking Index ($NWX +1.01%) posted a gain and rebounded above its 50-day moving average (DMA) line which previously had acted as resistance.
| Oil Services |
$OSX |
91.89 |
+1.10 |
+1.21% |
+14.01% |
| Integrated Oil |
$XOI |
1,232.03 |
+6.36 |
+0.52% |
+6.29% |
| Semiconductor |
$SOX |
1,160.55 |
-5.69 |
-0.49% |
+0.47% |
| Networking |
$NWX |
505.54 |
+5.03 |
+1.01% |
+3.45% |
| Broker/Dealer |
$XBD |
247.06 |
+1.62 |
+0.66% |
+4.10% |
| Retail |
$RLX |
2,083.31 |
+22.59 |
+1.10% |
+6.76% |
| Gold & Silver |
$XAU |
71.47 |
+0.27 |
+0.38% |
+1.15% |
| Bank |
$BKX |
89.66 |
+0.10 |
+0.11% |
+4.51% |
| Biotech |
$BTK |
4,643.86 |
+87.17 |
+1.91% |
+10.02% |
|
|
|
 |
Perched Within Close Striking Distance of Prior High
Kenneth J. Gruneisen - Passed the CAN SLIM® Master's Exam
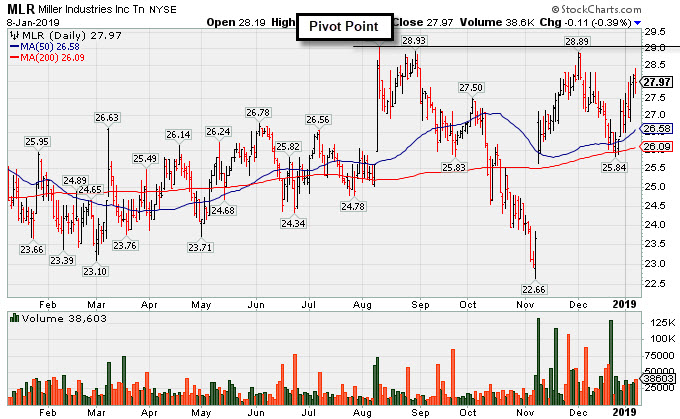
Miller Industries Inc (MLR -$0.11 or -0.39% to $27.97) is consolidating above its closely coinciding 50-day and 200-day moving average (DMA) lines. Little resistance remains due to overhead supply up to the $29 level. Subsequent gains above the pivot point backed by at least +40% above average volume are needed to trigger a technical buy signal. It encountered distributional pressure in recent weeks after highlighted in yellow with pivot point cited based on its 8/10/18 high plus 10 cents in the 11/30/18 mid-day report (read here).
Disciplined investors will note that it did not produce the gains above the pivot point backed by at least +40% above average volume needed to trigger a technical buy signal after last shown in this FSU section on 12/20/18 with an annotated graph under the headline, "Failed to Produce Buy Signal and Deterioration Raised Concern".
It reported earnings +95% on +28% sales revenues for the Sep '18 quarter. Recent quarterly comparisons have been above the +25% minimum earnings guideline (C criteria) and, sequentially, showed encouraging sales revenues acceleration. Annual earnings history (A criteria) has also been good. Very small supply of only 11.4 million shares outstanding (A criteria) can contribute to greater price volatility in the event of institutional buying or selling.
The number of top-rated funds owning its shares rose from 196 in Mar '18 to 226 in Sep '18, a reassuring sign. The current Up/Down Volume Ratio of 1.4 is an unbiased indication its shares have been neutral concerning accumulation/distribution over the past 50 days. It has earned an A Timeliness rating and a C Sponsorship Rating.
Charts courtesy of www.stockcharts.com
 |
|
|
Color Codes Explained :
Y - Better candidates highlighted by our
staff of experts.
G - Previously featured
in past reports as yellow but may no longer be buyable under the
guidelines.
***Last / Change / Volume data in this table is the closing quote data***
Symbol/Exchange
Company Name
Industry Group |
PRICE |
CHANGE
(%Change) |
Day High |
Volume
(% DAV)
(% 50 day avg vol) |
52 Wk Hi
% From Hi |
Featured
Date |
Price
Featured |
Pivot Featured |
|
Max Buy |
MLR
-
NYSE
Miller Industries Inc
AUTOMOTIVE - Auto Parts
|
$27.97
|
-0.11
-0.39% |
$28.39
|
38,603
104.33% of 50 DAV
50 DAV is 37,000
|
$29.40
-4.86%
|
11/30/2018
|
$28.35
|
PP = $29.50
|
|
MB = $30.98
|
 Most Recent Note - 1/8/2019 5:05:58 PM
Y - Perched within close striking distance of prior highs while consolidating above its 50-day and 200-day moving average (DMA) lines. Little resistance remains due to overhead supply up to the $29 level. See the latest FSU analysis for more details and a new annotated graph.
>>> FEATURED STOCK ARTICLE : Perched Within Close Striking Distance of Prior High - 1/8/2019 |
View all notes |
Set NEW NOTE alert |
Company Profile |
SEC
News |
Chart |
Request a new note
C
A
S
I |
UBNT
-
NASDAQ
Ubiquiti Networks
TELECOMMUNICATIONS - Diversified Communication Serv
|
$104.00
|
+0.75
0.73% |
$104.80
|
412,139
92.00% of 50 DAV
50 DAV is 448,000
|
$115.44
-9.91%
|
11/9/2018
|
$108.20
|
PP = $101.43
|
|
MB = $106.50
|
Most Recent Note - 1/7/2019 6:39:28 PM
Y - Color code is changed to yellow after rebounding above its 50 DMA line ($101.87) with a light volume gain today helping its outlook to improve. Fundamentals remain strong.
>>> FEATURED STOCK ARTICLE : Needs Rebound Above 50-Day Average to Help Outlook - 1/2/2019 |
View all notes |
Set NEW NOTE alert |
Company Profile |
SEC
News |
Chart |
Request a new note
C
A
S
I |
PLNT
-
NYSE
Planet Fitness Inc Cl A
Leisure-Services
|
$57.62
|
+1.78
3.19% |
$57.80
|
1,575,190
123.64% of 50 DAV
50 DAV is 1,274,000
|
$58.50
-1.50%
|
11/7/2018
|
$57.10
|
PP = $55.45
|
|
MB = $58.22
|
Most Recent Note - 1/8/2019 5:07:54 PM
Y - Posted a 3rd consecutive gain with above average volume today and finished at a best-ever close. Its 50 DMA line ($52.64) defines important near-term support to watch above the recent low ($48). Little resistance remains due to overhead supply up to the $58.50 level.
>>> FEATURED STOCK ARTICLE : Found Prompt Support Near 50-Day Moving Average Line - 1/4/2019 |
View all notes |
Set NEW NOTE alert |
Company Profile |
SEC
News |
Chart |
Request a new note
C
A
S
I |
TEAM
-
NASDAQ
Atlassian Corp Plc Cl A
Comp Sftwr-Spec Enterprs
|
$94.82
|
+2.11
2.28% |
$96.00
|
2,272,581
152.42% of 50 DAV
50 DAV is 1,491,000
|
$98.21
-3.45%
|
1/7/2019
|
$94.68
|
PP = $98.31
|
|
MB = $103.23
|
Most Recent Note - 1/8/2019 12:39:13 PM
Y - Posted a solid gain on the prior session with heavy volume and it is on track today for a 3rd consecutive gain. Color code was changed to yellow with new pivot point cited based on its 10/01/18 high plus 10 cents. Subsequent gains above the pivot point backed by at least +40% above average volume may trigger a technical buy signal. Fundamentals remain strong. It found support at its 200 DMA line during the consolidation after dropped from the Featured Stocks list on 10/10/18. See the latest FSU analysis for more details and an annotated graph.
>>> FEATURED STOCK ARTICLE : Rebounding Near Prior High Which May Act as Resistance - 1/7/2019 |
View all notes |
Set NEW NOTE alert |
Company Profile |
SEC
News |
Chart |
Request a new note
C
A
S
I |
INVA
-
NASDAQ
Innoviva Inc
Medical-Biomed/Biotech
|
$18.80
|
+0.29
1.57% |
$19.10
|
1,308,492
109.86% of 50 DAV
50 DAV is 1,191,000
|
$18.62
0.97%
|
11/23/2018
|
$17.74
|
PP = $18.09
|
|
MB = $18.99
|
Most Recent Note - 1/7/2019 6:42:03 PM
Y - Hit a new high with today's gain above the pivot point backed by +35% above average volume, below the +40% minimum guideline needed to trigger a proper technical buy signal. Confirming gains with higher volume would be a reassuring sign. The 50 DMA line and prior low define near-term support.
>>> FEATURED STOCK ARTICLE : Consolidating Above 50-Day Average Line Near High - 1/3/2019 |
View all notes |
Set NEW NOTE alert |
Company Profile |
SEC
News |
Chart |
Request a new note
C
A
S
I |
Symbol/Exchange
Company Name
Industry Group |
PRICE |
CHANGE
(%Change) |
Day High |
Volume
(% DAV)
(% 50 day avg vol) |
52 Wk Hi
% From Hi |
Featured
Date |
Price
Featured |
Pivot Featured |
|
Max Buy |
|
|
|
THESE ARE NOT BUY RECOMMENDATIONS!
Comments contained in the body of this report are technical
opinions only. The material herein has been obtained
from sources believed to be reliable and accurate, however,
its accuracy and completeness cannot be guaranteed.
This site is not an investment advisor, hence it does
not endorse or recommend any securities or other investments.
Any recommendation contained in this report may not
be suitable for all investors and it is not to be deemed
an offer or solicitation on our part with respect to
the purchase or sale of any securities. All trademarks,
service marks and trade names appearing in this report
are the property of their respective owners, and are
likewise used for identification purposes only.
This report is a service available
only to active Paid Premium Members.
You may opt-out of receiving report notifications
at any time. Questions or comments may be submitted
by writing to Premium Membership Services 665 S.E. 10 Street, Suite 201 Deerfield Beach, FL 33441-5634 or by calling 1-800-965-8307
or 954-785-1121.
|
|
|

