You are not logged in.
This means you
CAN ONLY VIEW reports that were published prior to Sunday, February 25, 2024.
You
MUST UPGRADE YOUR MEMBERSHIP if you want to see any current reports.
AFTER MARKET UPDATE - MONDAY, JANUARY 7TH, 2019
Previous After Market Report Next After Market Report >>>
|
|
|
|
DOW |
+98.19 |
23,531.35 |
+0.42% |
|
Volume |
1,017,459,140 |
-8% |
|
Volume |
2,500,698,090 |
-3% |
|
NASDAQ |
+84.61 |
6,823.47 |
+1.26% |
|
Advancers |
2,371 |
78% |
|
Advancers |
2,335 |
75% |
|
S&P 500 |
+17.75 |
2,549.69 |
+0.70% |
|
Decliners |
650 |
22% |
|
Decliners |
777 |
25% |
|
Russell 2000 |
+24.62 |
1,405.37 |
+1.78% |
|
52 Wk Highs |
8 |
|
|
52 Wk Highs |
29 |
|
|
S&P 600 |
+12.16 |
874.48 |
+1.41% |
|
52 Wk Lows |
11 |
|
|
52 Wk Lows |
19 |
|
|
 |
Major Indices Rise Further With an Increase in Leadership
Kenneth J. Gruneisen - Passed the CAN SLIM® Master's Exam
Stocks finished higher Monday. The Dow added 98 points to 23,531 while the S&P 500 climbed 17 points to 2,549. The Nasdaq Composite gained 84 points to 6,823. The small-cap Russell 2000 was the top performing index adding 3.5% on the session. The volume totals were lighter than the prior session total on the NYSE and on the Nasdaq exchange. Advancers led decliners by more than a 3-1 margin on the NYSE and on the Nasdaq exchange. Leadership remained elusive as only 3 high-ranked companies from the Leaders List made new 52-week highs and were listed on the BreakOuts Page. There was an increase in new 52-week highs on both the NYSE and on the Nasdaq exchange versus the prior session. New 52-week highs outnumbered new 52-week lows on the Nasdaq exchange but new lows totals still outnumbered new highs on the NYSE. The newspaper reported that Friday's session was a follow-through day and the major indices are in a confirmed uptrend. Disciplined investors know that a proper follow-through day requires big gains from at least one of the major indices with higher volume and an expansion in leadership (stocks hitting new highs). New leadership was a critical missing element on Friday, however, additional confirmation on Monday helped to signal a change in market direction (M criteria) back to a bullish stance. The Featured Stocks Page provides the most timely analysis on high-ranked leaders. Charts used courtesy of www.stockcharts.com
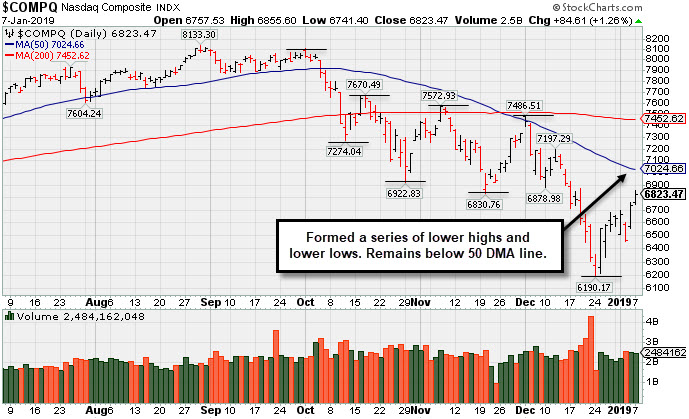
PICTURED: The Nasdaq Composite Index has formed a worrisome series of lower highs and lower lows and it remains well below its 50-day and 200-day moving average (DMA) lines.
The major averages extended last week’s gains as investors await further trade updates. Negotiations between Chinese and US officials began with optimistic comments coming from both parties. On the data front, ISM’s gauge of U.S. services activity declined more than expected in December, to the lowest level since July. Meanwhile, scheduled updates on factory orders and durable goods orders were postponed due to the partial government shutdown.
Nine of 11 S&P 500 sectors finished in positive territory. Consumer Discretionary shares paced gains as Amazon (AMZN +3.4%), and surpassed Microsoft as the world’s most valuable public company. Technology stocks also finished broadly higher as NVIDIA (NVDA +5.3%) rose. The Energy sector also outperformed as oil prices extended gains for a sixth straight session. Utilities underperformed as PG&E (PCG -22.34%) fell after the California utility hinted it may file for bankruptcy protection amid billions of dollars in wildfire liabilities.
Treasuries were weaker along the curve as the yield on the 10-year note climbed three basis points to 2.69%. In commodities, WTI crude added 1.5% to $48.67/barrel. COMEX gold advanced 0.7% to $1,289.70/ounce amid a weaker dollar. |
 Kenneth J. Gruneisen started out as a licensed stockbroker in August 1987, a couple of months prior to the historic stock market crash that took the Dow Jones Industrial Average down -22.6% in a single day. He has published daily fact-based fundamental and technical analysis on high-ranked stocks online for two decades. Through FACTBASEDINVESTING.COM, Kenneth provides educational articles, news, market commentary, and other information regarding proven investment systems that work in good times and bad.
Comments contained in the body of this report are technical opinions only and are not necessarily those of Gruneisen Growth Corp. The material herein has been obtained from sources believed to be reliable and accurate, however, its accuracy and completeness cannot be guaranteed. Our firm, employees, and customers may effect transactions, including transactions contrary to any recommendation herein, or have positions in the securities mentioned herein or options with respect thereto. Any recommendation contained in this report may not be suitable for all investors and it is not to be deemed an offer or solicitation on our part with respect to the purchase or sale of any securities. |
|
 |
Retail, Tech, and Oil Services Index Led Group Gainers
Kenneth J. Gruneisen - Passed the CAN SLIM® Master's Exam
The Retail Index ($RLX +2.76%) posted a solid gain, meanwhile the Bank Index ($BKX +0.43%) and the Broker/Dealer Index ($XBD +0.22%) each posted a smaller gain. The Biotech Index ($BTK +3.43%) led the tech sector while the Semiconductor Index ($SOX +1.95%) and Networking Index ($NWX +1.92%) both posted solid gains. The Oil Services Index ($OSX +4.37%) was a standout gainer while the Integrated Oil Index ($XOI +0.90%) posted a smaller gain, meanwhile, the Gold & Silver Index ($XAU -0.93%) was a standout decliner for the second consecutive session.
Charts courtesy of www.stockcharts.com
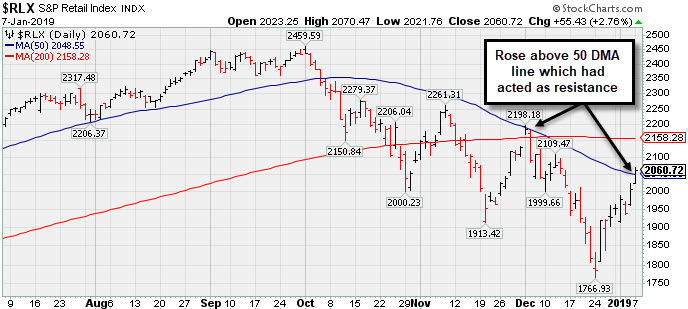 PICTURED: The Retail Index ($RLX +2.76%) posted a big gain and rebounded above its 50-day moving average (DMA) line which previously had acted as resistance.
| Oil Services |
$OSX |
90.79 |
+3.79 |
+4.36% |
+12.64% |
| Integrated Oil |
$XOI |
1,225.67 |
+10.90 |
+0.90% |
+5.74% |
| Semiconductor |
$SOX |
1,166.24 |
+22.28 |
+1.95% |
+0.96% |
| Networking |
$NWX |
500.51 |
+9.42 |
+1.92% |
+2.42% |
| Broker/Dealer |
$XBD |
245.44 |
+0.54 |
+0.22% |
+3.41% |
| Retail |
$RLX |
2,060.72 |
+55.43 |
+2.76% |
+5.60% |
| Gold & Silver |
$XAU |
71.20 |
-0.67 |
-0.93% |
+0.76% |
| Bank |
$BKX |
89.56 |
+0.38 |
+0.43% |
+4.39% |
| Biotech |
$BTK |
4,556.70 |
+151.09 |
+3.43% |
+7.96% |
|
|
|
 |
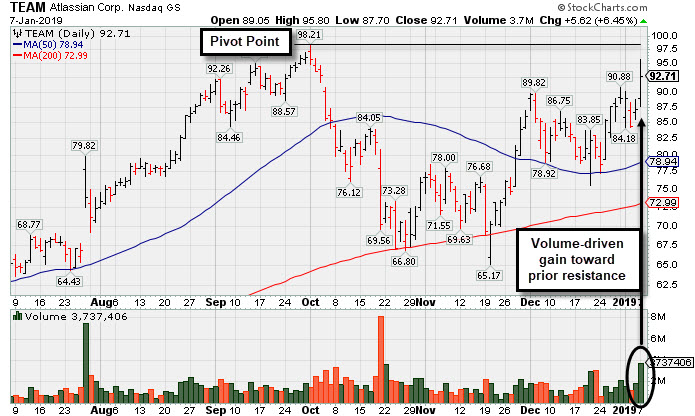
Rebounding Near Prior High Which May Act as Resistance
Kenneth J. Gruneisen - Passed the CAN SLIM® Master's Exam
Atlassian Corp (TEAM +$5.62 or +6.45% to $92.71) was highlighted in yellow with new pivot point cited based on its 10/01/18 high plus 10 cents in the earlier mid-day report (read here). Disciplined investors will watch for subsequent volume-driven gains above the pivot point to trigger a convincing technical buy signal.
It was last shown in the FSU section on 9/14/18 with an annotated graph under the headline, "Extended From Base and Hitting Another New High". It found support at its 200 DMA line during the consolidation after dropped from the Featured Stocks list on 10/10/18.
Fundamentals remain strong. This Australia - based software developer reported earnings +54% on +37% sales revenues for the Sep '18 quarter versus the year ago period, its 4th consecutive quarterly comparison above the +25% minimum guideline (C criteria), helping it better match with the fact-based investment system's guidelines. Annual earnings (A criteria) history has been strong since its $21 IPO on 12/10/15.
The number of top-rated funds owning its shares rose from 266 in Sep '17 to 398 in Sep '18, a reassuring sign concerning the I criteria. It has a Timeliness Rating of A and Sponsorship Rating of B.Its current Up/Down Volume Ratio of 1.43 is an unbiased indication its shares have been under accumulation.
|
|
|
Color Codes Explained :
Y - Better candidates highlighted by our
staff of experts.
G - Previously featured
in past reports as yellow but may no longer be buyable under the
guidelines.
***Last / Change / Volume data in this table is the closing quote data***
Symbol/Exchange
Company Name
Industry Group |
PRICE |
CHANGE
(%Change) |
Day High |
Volume
(% DAV)
(% 50 day avg vol) |
52 Wk Hi
% From Hi |
Featured
Date |
Price
Featured |
Pivot Featured |
|
Max Buy |
MLR
-
NYSE
Miller Industries Inc
AUTOMOTIVE - Auto Parts
|
$28.08
|
+0.16
0.57% |
$28.22
|
34,643
93.63% of 50 DAV
50 DAV is 37,000
|
$29.40
-4.49%
|
11/30/2018
|
$28.35
|
PP = $29.50
|
|
MB = $30.98
|
Most Recent Note - 1/4/2019 6:26:18 PM
Y - Consolidating above its closely coinciding 50-day and 200-day moving average (DMA) lines. Little resistance remains due to overhead supply up to the $29 level.
>>> FEATURED STOCK ARTICLE : Failed to Produce Buy Signal and Deterioration Raised Concern - 12/20/2018 |
View all notes |
Set NEW NOTE alert |
Company Profile |
SEC
News |
Chart |
Request a new note
C
A
S
I |
UBNT
-
NASDAQ
Ubiquiti Networks
TELECOMMUNICATIONS - Diversified Communication Serv
|
$103.25
|
+3.31
3.31% |
$104.58
|
339,583
75.46% of 50 DAV
50 DAV is 450,000
|
$115.44
-10.56%
|
11/9/2018
|
$108.20
|
PP = $101.43
|
|
MB = $106.50
|
 Most Recent Note - 1/7/2019 6:39:28 PM
Y - Color code is changed to yellow after rebounding above its 50 DMA line ($101.87) with a light volume gain today helping its outlook to improve. Fundamentals remain strong.
>>> FEATURED STOCK ARTICLE : Needs Rebound Above 50-Day Average to Help Outlook - 1/2/2019 |
View all notes |
Set NEW NOTE alert |
Company Profile |
SEC
News |
Chart |
Request a new note
C
A
S
I |
PLNT
-
NYSE
Planet Fitness Inc Cl A
Leisure-Services
|
$55.84
|
+0.92
1.68% |
$56.70
|
1,885,998
149.09% of 50 DAV
50 DAV is 1,265,000
|
$58.50
-4.55%
|
11/7/2018
|
$57.10
|
PP = $55.45
|
|
MB = $58.22
|
Most Recent Note - 1/4/2019 6:29:04 PM
Y - Posted a solid gain with above average volume. Its 50 DMA line ($52.23) and recent low define important near-term support to watch. Little resistance remains due to overhead supply up to the $58.50 level. See the latest FSU analysis for more details and a new annotated graph.
>>> FEATURED STOCK ARTICLE : Found Prompt Support Near 50-Day Moving Average Line - 1/4/2019 |
View all notes |
Set NEW NOTE alert |
Company Profile |
SEC
News |
Chart |
Request a new note
C
A
S
I |
TEAM
-
NASDAQ
Atlassian Corp Plc Cl A
Comp Sftwr-Spec Enterprs
|
$92.71
|
+5.62
6.45% |
$95.80
|
3,737,302
256.51% of 50 DAV
50 DAV is 1,457,000
|
$98.21
-5.60%
|
1/7/2019
|
$94.68
|
PP = $98.31
|
|
MB = $103.23
|
Most Recent Note - 1/7/2019 6:37:38 PM
Y - Posted a solid gain today with heavy volume. Color code was changed to yellow with new pivot point cited based on its 10/01/18 high plus 10 cents. Subsequent volume-driven gains above the pivot point may trigger a technical buy signal. Fundamentals remain strong. It found support at its 200 DMA line during the consolidation after dropped from the Featured Stocks list on 10/10/18. See the latest FSU analysis for more details and a new annotated graph.
>>> FEATURED STOCK ARTICLE : Rebounding Near Prior High Which May Act as Resistance - 1/7/2019 |
View all notes |
Set NEW NOTE alert |
Company Profile |
SEC
News |
Chart |
Request a new note
C
A
S
I |
INVA
-
NASDAQ
Innoviva Inc
Medical-Biomed/Biotech
|
$18.51
|
+0.67
3.76% |
$18.62
|
1,580,596
134.18% of 50 DAV
50 DAV is 1,178,000
|
$18.60
-0.48%
|
11/23/2018
|
$17.74
|
PP = $18.09
|
|
MB = $18.99
|
Most Recent Note - 1/7/2019 6:42:03 PM
Y - Hit a new high with today's gain above the pivot point backed by +35% above average volume, below the +40% minimum guideline needed to trigger a proper technical buy signal. Confirming gains with higher volume would be a reassuring sign. The 50 DMA line and prior low define near-term support.
>>> FEATURED STOCK ARTICLE : Consolidating Above 50-Day Average Line Near High - 1/3/2019 |
View all notes |
Set NEW NOTE alert |
Company Profile |
SEC
News |
Chart |
Request a new note
C
A
S
I |
Symbol/Exchange
Company Name
Industry Group |
PRICE |
CHANGE
(%Change) |
Day High |
Volume
(% DAV)
(% 50 day avg vol) |
52 Wk Hi
% From Hi |
Featured
Date |
Price
Featured |
Pivot Featured |
|
Max Buy |
|
|
|
THESE ARE NOT BUY RECOMMENDATIONS!
Comments contained in the body of this report are technical
opinions only. The material herein has been obtained
from sources believed to be reliable and accurate, however,
its accuracy and completeness cannot be guaranteed.
This site is not an investment advisor, hence it does
not endorse or recommend any securities or other investments.
Any recommendation contained in this report may not
be suitable for all investors and it is not to be deemed
an offer or solicitation on our part with respect to
the purchase or sale of any securities. All trademarks,
service marks and trade names appearing in this report
are the property of their respective owners, and are
likewise used for identification purposes only.
This report is a service available
only to active Paid Premium Members.
You may opt-out of receiving report notifications
at any time. Questions or comments may be submitted
by writing to Premium Membership Services 665 S.E. 10 Street, Suite 201 Deerfield Beach, FL 33441-5634 or by calling 1-800-965-8307
or 954-785-1121.
|
|
|