You are not logged in.
This means you
CAN ONLY VIEW reports that were published prior to Sunday, February 25, 2024.
You
MUST UPGRADE YOUR MEMBERSHIP if you want to see any current reports.
AFTER MARKET UPDATE - MONDAY, JANUARY 6TH, 2020
Previous After Market Report Next After Market Report >>>
|
|
|
|
DOW |
+68.50 |
28,703.38 |
+0.24% |
|
Volume |
978,427,420 |
+5% |
|
Volume |
2,781,132,700 |
+9% |
|
NASDAQ |
+50.69 |
9,071.46 |
+0.56% |
|
Advancers |
1,512 |
54% |
|
Advancers |
1,684 |
53% |
|
S&P 500 |
+11.43 |
3,246.28 |
+0.35% |
|
Decliners |
1,313 |
46% |
|
Decliners |
1,497 |
47% |
|
Russell 2000 |
+2.39 |
1,663.26 |
+0.14% |
|
52 Wk Highs |
125 |
|
|
52 Wk Highs |
100 |
|
|
S&P 600 |
-1.17 |
1,019.76 |
-0.11% |
|
52 Wk Lows |
8 |
|
|
52 Wk Lows |
28 |
|
|
 |
Major Indices Managed Positive Reversal
Kenneth J. Gruneisen - Passed the CAN SLIM® Master's Exam
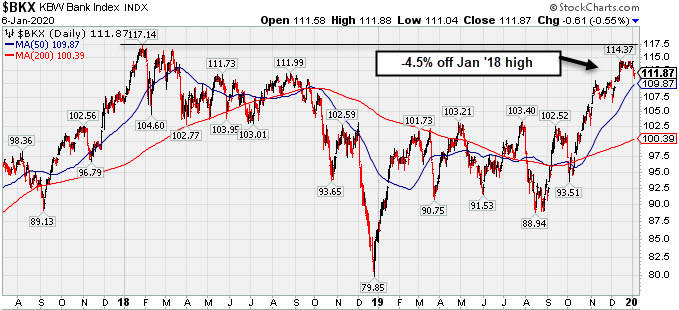
The S&P 500 erased an earlier decline to close 0.4% higher. The Dow added 68 points, bouncing back from a 216-point drop earlier in the session. The Nasdaq Composite rose 0.6%.Advancers led decliners by a narrow 8-7 margin on the NYSE and on the Nasdaq exchange. The reported volume was higher than the prior session totals on the NYSE and on the Nasdaq exchange. There were 43 high-ranked companies from the Leaders List that hit a new 52-week high and were listed on the BreakOuts Page, versus the total of 64 on the prior session. New 52-week highs totals easily outnumbered new 52-week lows totals on the NYSE and on the Nasdaq exchange. The major indices (M criteria) are in a "confirmed uptrend" after enduring distributional pressure in recent weeks. The Featured Stocks Page provides the most timely analysis on high-ranked leaders. Charts used courtesy of www.stockcharts.com
PICTURED: The Nasdaq Composite Index managed a "positive reversal" on Monday and remains perched near its record high.
Stocks finished higher on Monday as investors seemed to brush off escalating geopolitical tensions in the Middle East. U.S. equities rebounded in afternoon trading despite Friday’s news of a U.S. airstrike in Baghdad, which killed a top Iranian military commander. In response, Iraq’s government voted to expel foreign troops from the country, while Iran announced that it would no longer comply with uranium enrichment restrictions. In trade news, a report indicated that top Chinese officials plan to visit Washington to sign the “phase one” accord on January 15th.
Treasuries steadied after strengthening the most in a month on Friday. The yield on the benchmark 10-year note added basis point to 1.80%. On the data front, research firm IHS Markit’s final PMI reading showed that the U.S. services sector expanded at a faster-than-expected pace in December. In commodities, WTI crude added 0.3% to $63.27/barrel, on the heels of Friday’s 3% jump. COMEX gold advanced 1% to $1,568.20/ounce, drifting from a six-year high.
Eight of 11 S&P 500 sectors closed in positive territory. The Communication Services group paced gains, with Google parent Alphabet (GOOGL +2.67%) hitting a new all-time high after being the subject of an analyst upgrade. In corporate news, American Airlines (AAL -1.10%) and Delta Air Lines (DAL -0.69%) both fell on worries of higher fuel costs.
|
 Kenneth J. Gruneisen started out as a licensed stockbroker in August 1987, a couple of months prior to the historic stock market crash that took the Dow Jones Industrial Average down -22.6% in a single day. He has published daily fact-based fundamental and technical analysis on high-ranked stocks online for two decades. Through FACTBASEDINVESTING.COM, Kenneth provides educational articles, news, market commentary, and other information regarding proven investment systems that work in good times and bad.
Comments contained in the body of this report are technical opinions only and are not necessarily those of Gruneisen Growth Corp. The material herein has been obtained from sources believed to be reliable and accurate, however, its accuracy and completeness cannot be guaranteed. Our firm, employees, and customers may effect transactions, including transactions contrary to any recommendation herein, or have positions in the securities mentioned herein or options with respect thereto. Any recommendation contained in this report may not be suitable for all investors and it is not to be deemed an offer or solicitation on our part with respect to the purchase or sale of any securities. |
|
 |
Energy-Linked Groups Rose and Retail Index Gained Ground
Kenneth J. Gruneisen - Passed the CAN SLIM® Master's Exam
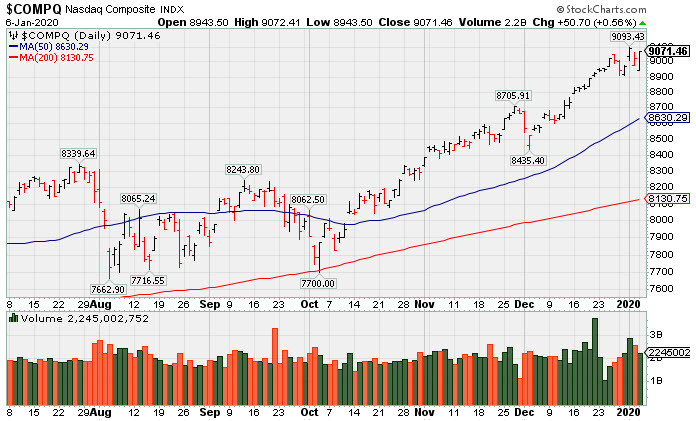
The Gold & Silver Index ($XAU -0.32%) edged lower while the Integrated Oil Index ($XOI +1.17%) and the Oil Services Index ($OSX +1.44%) both were standout gainers. The Retail Index ($RLX +0.67%) edged higher while the Broker/Dealer Index ($XBD -0.08%) finished flat and the Bank Index ($BKX -0.55%) suffered a modest loss. The tech sector was mixed as the Biotech Index ($BTK +0.99%) rose and the Networking Index ($NWX +0.11%) was little changed, meanwhile, the Semiconductor Index ($SOX -1.04%) fell.
PICTURED: The Bank Index ($BKX -0.55%) is perched -4.5% off its record high hit in January 2018.
| Oil Services |
$OSX |
80.99 |
+1.15 |
+1.44% |
+3.45% |
| Integrated Oil |
$XOI |
1,293.15 |
+14.94 |
+1.17% |
+1.78% |
| Semiconductor |
$SOX |
1,834.68 |
-19.30 |
-1.04% |
-0.81% |
| Networking |
$NWX |
583.85 |
+0.64 |
+0.11% |
+0.08% |
| Broker/Dealer |
$XBD |
290.21 |
-0.22 |
-0.08% |
-0.06% |
| Retail |
$RLX |
2,479.20 |
+16.58 |
+0.67% |
+1.22% |
| Gold & Silver |
$XAU |
105.07 |
-0.34 |
-0.32% |
-1.73% |
| Bank |
$BKX |
111.87 |
-0.61 |
-0.54% |
-1.31% |
| Biotech |
$BTK |
5,034.52 |
+49.33 |
+0.99% |
-0.65% |
|
|
|
 |
Large Loss With Higher Volume Indicates Distributional Pressure
Kenneth J. Gruneisen - Passed the CAN SLIM® Master's Exam
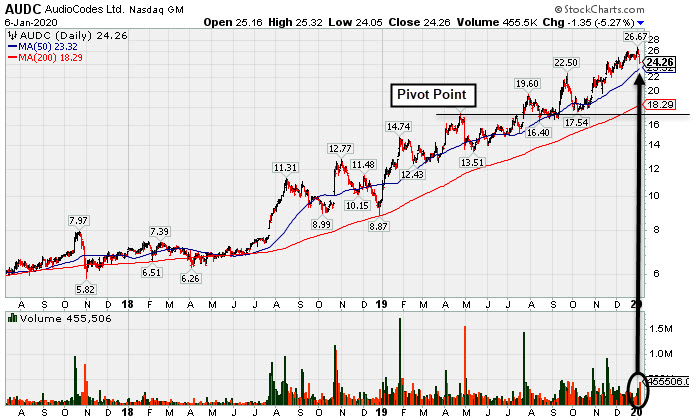
Audiocodes Ltd (AUDC -$1.35 or -5.27% to $24.26) suffered a big loss today backed by above average volume, action indicative of distributional pressure. It has been noted repeatedly as "Extended from the previously noted base". Its 50-day moving average (DMA) line ($23.32) defines initial support above prior highs in the $22 area. Subsequent losses leading to violations would trigger more serious technical sell signals.
Bullish action came after it reported earnings +26% on +15% sales revenues for the Sep '19 quarter, continuing its strong earnings track record for a 11th consecutive quarterly comparison above the +25% minimum guideline (C criteria). Annual earnings growth has been strong and it has a 99 Earnings Per Share Rating.
This Israel-based designer of advanced voice-over-IP products wedged higher with gains lacking great volume conviction since last shown in this FSU section on 12/13/19 with an annotated graph under the headline, "Reversed Into Red After Hitting Yet Another New High". The number of top-rated funds owning its shares rose from 33 in Mar '18 to 82 in Sep '19, a reassuring sign concerning the I criteria. Its current Up/Down Volume Ratio of 1.9 is still an unbiased indication its shares have been under accumulation over the past 50 days. It has a Timeliness Rating of A and Sponsorship Rating of A. The small supply of 22.8 million shares (S criteria) in the public float can contribute to greater price volatility in the event of institutional buying or selling.
Charts courtesy of www.stockcharts.com
 |
|
|
Color Codes Explained :
Y - Better candidates highlighted by our
staff of experts.
G - Previously featured
in past reports as yellow but may no longer be buyable under the
guidelines.
***Last / Change / Volume data in this table is the closing quote data***
Symbol/Exchange
Company Name
Industry Group |
PRICE |
CHANGE
(%Change) |
Day High |
Volume
(% DAV)
(% 50 day avg vol) |
52 Wk Hi
% From Hi |
Featured
Date |
Price
Featured |
Pivot Featured |
|
Max Buy |
 MLR
-
NYSE
MLR
-
NYSE
Miller Industries Inc
AUTOMOTIVE - Auto Parts
|
$36.43
|
-0.09
-0.25% |
$36.87
|
28,028
60.93% of 50 DAV
50 DAV is 46,000
|
$38.18
-4.58%
|
9/24/2019
|
$34.00
|
PP = $35.36
|
|
MB = $37.13
|
Most Recent Note - 1/2/2020 4:44:22 PM
G - Still quietly hovering near its 52-week high and just above its "max buy" level. Its 50 DMA line ($36.15) and prior highs in the $35 area define near-term support to watch. Resilient after reporting Sep '19 earnings which were below the fundamental guidelines of the fact-based investment system.
>>> FEATURED STOCK ARTICLE : Towing/Recovery Equipment Firm Remains Perched Near Record High - 12/27/2019 |
View all notes |
Set NEW NOTE alert |
Company Profile |
SEC
News |
Chart |
Request a new note
C
A
S
I |
CCBG
-
NASDAQ
Capital City Bk Gp
BANKING - Regional - Mid-Atlantic Banks
|
$29.70
|
-0.14
-0.47% |
$29.91
|
41,493
90.20% of 50 DAV
50 DAV is 46,000
|
$30.95
-4.04%
|
12/16/2019
|
$30.07
|
PP = $30.95
|
|
MB = $32.50
|
Most Recent Note - 1/2/2020 3:59:16 PM
Y - Hovering within close striking distance of its 52-week high, recently meeting resistance. Subsequent gains and a strong close above the new pivot point cited based on its 11/06/19 high plus 10 cents may trigger a new (or add-on) technical buy signal. Found support at its 50 DMA line ($29.47) during its orderly consolidation.
>>> FEATURED STOCK ARTICLE : Perched Near 52-Week High After Forming an Orderly Base - 1/2/2020 |
View all notes |
Set NEW NOTE alert |
Company Profile |
SEC
News |
Chart |
Request a new note
C
A
S
I |
FTNT
-
NASDAQ
Fortinet Inc
Computer Sftwr-Security
|
$112.00
|
+0.79
0.71% |
$112.36
|
1,472,553
107.49% of 50 DAV
50 DAV is 1,370,000
|
$111.53
0.42%
|
12/9/2019
|
$103.85
|
PP = $106.10
|
|
MB = $111.41
|
 Most Recent Note - 1/6/2020 5:56:39 PM
G - Hit a new 52-week high with today's 3rd consecutive gain marked by average volume. Color code is changed to green after wedging above its "max buy" level. Its 50 DMA line ($100.73) and prior low ($99.78 on 12/03/19) define important near-term support to watch.
>>> FEATURED STOCK ARTICLE : Endured Distributional Pressure While Perched at High - 12/23/2019 |
View all notes |
Set NEW NOTE alert |
Company Profile |
SEC
News |
Chart |
Request a new note
C
A
S
I |
SPSC
-
NASDAQ
S P S Commerce Inc
COMPUTER SOFTWARE and SERVICES - Application Software
|
$55.91
|
+0.03
0.05% |
$56.15
|
116,441
57.73% of 50 DAV
50 DAV is 201,700
|
$59.14
-5.46%
|
11/29/2019
|
$56.59
|
PP = $59.24
|
|
MB = $62.20
|
Most Recent Note - 1/2/2020 4:09:53 PM
Y - Still perched -5.3% off its all-time high. Subsequent gains above its pivot point backed by at least +40% above average volume are needed to trigger a new technical buy signal. Fundamentals remain strong, however, its Relative Strength Rating has slumped to 78, below the 80+ minimum guideline for buy candidates..
>>> FEATURED STOCK ARTICLE : Perched Within Close Striking Distance of 52-Week High - 12/20/2019 |
View all notes |
Set NEW NOTE alert |
Company Profile |
SEC
News |
Chart |
Request a new note
C
A
S
I |
AUDC
-
NASDAQ
Audiocodes Ltd
ELECTRONICS - Scientific and Technical Instrum
|
$24.26
|
-1.35
-5.27% |
$25.32
|
455,506
168.08% of 50 DAV
50 DAV is 271,000
|
$26.68
-9.07%
|
9/13/2019
|
$19.68
|
PP = $19.84
|
|
MB = $20.83
|
Most Recent Note - 1/6/2020 5:50:56 PM
G - Suffered a large loss today with above average volume indicative of distributional pressure. Extended from the previously noted base. Its 50 DMA line ($23.33) defines support above with prior highs in the $22 area. Fundamentals remain strong. See the latest FSU analysis for more details and a new annotated graph.
>>> FEATURED STOCK ARTICLE : Large Loss With Higher Volume Indicates Distributional Pressure - 1/6/2020 |
View all notes |
Set NEW NOTE alert |
Company Profile |
SEC
News |
Chart |
Request a new note
C
A
S
I |
Symbol/Exchange
Company Name
Industry Group |
PRICE |
CHANGE
(%Change) |
Day High |
Volume
(% DAV)
(% 50 day avg vol) |
52 Wk Hi
% From Hi |
Featured
Date |
Price
Featured |
Pivot Featured |
|
Max Buy |
CHDN
-
NASDAQ
Churchill Downs Inc
LEISURE - Gaming Activities
|
$134.41
|
-0.53
-0.39% |
$135.33
|
146,881
56.93% of 50 DAV
50 DAV is 258,000
|
$138.17
-2.72%
|
10/8/2019
|
$129.77
|
PP = $132.83
|
|
MB = $139.47
|
Most Recent Note - 1/6/2020 5:53:44 PM
G - Pulled back for a 4th consecutive loss today with lighter volume while still hovering near its 52-week high. Its 50 DMA line ($130.98) defines near-term support above the prior low ($121.81 on 11/07/19) The Jun and Sep '19 quarterly earnings versus the year ago periods were both below the +25% minimum guideline (C criteria) and raised fundamental concerns.
>>> FEATURED STOCK ARTICLE : Touched a New HIgh With Gains Backed by Light Volume - 12/30/2019 |
View all notes |
Set NEW NOTE alert |
Company Profile |
SEC
News |
Chart |
Request a new note
C
A
S
I |
LULU
-
NASDAQ
Lululemon Athletica
MANUFACTURING - Textile Manufacturing
|
$235.43
|
+2.79
1.20% |
$235.53
|
1,459,507
72.40% of 50 DAV
50 DAV is 2,016,000
|
$235.50
-0.03%
|
9/6/2019
|
$201.25
|
PP = $194.35
|
|
MB = $204.07
|
Most Recent Note - 1/6/2020 5:59:08 PM
G - Inched to a new high with today's gain backed by light volume, getting more extended from any sound base. Its 50 DMA line ($219.30) and prior low ($218.18 on 12/12/19) define important near-term support to watch. Recently reported earnings +28% on +23% sales revenues for the Oct '19 quarter.
>>> FEATURED STOCK ARTICLE : Retreated From High After Another Strong Earnings Report - 12/17/2019 |
View all notes |
Set NEW NOTE alert |
Company Profile |
SEC
News |
Chart |
Request a new note
C
A
S
I |
CPRT
-
NASDAQ
Copart Inc
SPECIALTY RETAIL - Auto Dealerships
|
$93.49
|
+0.83
0.90% |
$93.63
|
1,851,648
102.30% of 50 DAV
50 DAV is 1,810,000
|
$93.57
-0.09%
|
1/2/2020
|
$92.80
|
PP = $92.51
|
|
MB = $97.14
|
Most Recent Note - 1/2/2020 4:04:34 PM
Y - Posted a gain today with near average volume for a new all-time high. Color code is changed to yellow with new pivot point cited based on its 11/25/19 high plus 10 cents. Subsequent gains above the pivot point must have at least +40% above average volume to trigger a proper new (or add-on) technical buy signal. Its 50 DMA line ($86.92) defines near-term support. Fundamentals remain strong.
>>> FEATURED STOCK ARTICLE : Extended From Prior Base and Hovering Near Record High - 12/12/2019 |
View all notes |
Set NEW NOTE alert |
Company Profile |
SEC
News |
Chart |
Request a new note
C
A
S
I |
NMIH
-
NASDAQ
N M I Holdings Inc Cl A
Finance-MrtgandRel Svc
|
$32.21
|
-0.14
-0.43% |
$32.44
|
438,610
86.00% of 50 DAV
50 DAV is 510,000
|
$35.79
-10.00%
|
11/8/2019
|
$32.89
|
PP = $31.44
|
|
MB = $33.01
|
Most Recent Note - 1/2/2020 12:22:27 PM
G - Violating its 50 DMA line ($32.46) with today's loss on higher volume raising concerns. Only a prompt rebound would help its outlook improve. Prior highs in the $30-31 area define the next important near-term support. Fundamentals remain strong.
>>> FEATURED STOCK ARTICLE : Hit New High But Encountered Distributional Pressure - 12/19/2019 |
View all notes |
Set NEW NOTE alert |
Company Profile |
SEC
News |
Chart |
Request a new note
C
A
S
I |
SPLK
-
NASDAQ
Splunk Inc
Computer Sftwr-Database
|
$154.46
|
+2.40
1.58% |
$154.62
|
1,567,870
78.43% of 50 DAV
50 DAV is 1,999,000
|
$153.66
0.52%
|
11/25/2019
|
$147.79
|
PP = $142.16
|
|
MB = $149.27
|
Most Recent Note - 1/6/2020 6:03:28 PM
G - Color code is changed to green after rallying back above its "max buy" level and hitting a new all-time high with light volume behind today's 4th consecutive gain. Prior highs in the $142-143 area define initial support to watch on pullbacks.
>>> FEATURED STOCK ARTICLE : Consolidating Above Prior Highs Following Impressive Rally - 12/16/2019 |
View all notes |
Set NEW NOTE alert |
Company Profile |
SEC
News |
Chart |
Request a new note
C
A
S
I |
Symbol/Exchange
Company Name
Industry Group |
PRICE |
CHANGE
(%Change) |
Day High |
Volume
(% DAV)
(% 50 day avg vol) |
52 Wk Hi
% From Hi |
Featured
Date |
Price
Featured |
Pivot Featured |
|
Max Buy |
PAYC
-
NYSE
Paycom Software Inc
COMPUTER SOFTWARE and SERVICES - Application Software
|
$278.09
|
+5.38
1.97% |
$278.20
|
446,244
81.28% of 50 DAV
50 DAV is 549,000
|
$279.95
-0.66%
|
11/20/2019
|
$252.97
|
PP = $259.81
|
|
MB = $272.80
|
Most Recent Note - 1/6/2020 6:01:52 PM
G - Posted a 4th consecutive gain with light volume. Color code is changed to green after rising above its "max buy" level. Fundamentals remain strong.
>>> FEATURED STOCK ARTICLE : Perched Near High and Near the Max Buy Level - 1/3/2020 |
View all notes |
Set NEW NOTE alert |
Company Profile |
SEC
News |
Chart |
Request a new note
C
A
S
I |
BLD
-
NYSE
Topbuild Corp
Bldg-Constr Prds/Misc
|
$104.51
|
+1.13
1.09% |
$104.99
|
202,882
68.31% of 50 DAV
50 DAV is 297,000
|
$113.74
-8.11%
|
12/9/2019
|
$109.71
|
PP = $113.84
|
|
MB = $119.53
|
Most Recent Note - 1/6/2020 5:52:03 PM
G - Still quietly lingering below its 50 DMA line. A rebound above its 50 DMA line ($106.11) is needed for its outlook to improve.
>>> FEATURED STOCK ARTICLE : Recent Slump Below 50-Day Moving Average Did Technical Damage - 12/24/2019 |
View all notes |
Set NEW NOTE alert |
Company Profile |
SEC
News |
Chart |
Request a new note
C
A
S
I |
GLOB
-
NYSE
Globant SA
Computer-Tech Services
|
$107.64
|
-0.94
-0.87% |
$108.17
|
323,610
121.20% of 50 DAV
50 DAV is 267,000
|
$112.33
-4.18%
|
11/14/2019
|
$106.87
|
PP = $112.43
|
|
MB = $118.05
|
Most Recent Note - 1/2/2020 4:06:28 PM
Y - Color code is changed to yellow while perched only -4.1% off its 52-week high. Subsequent gains above the pivot point backed by at least +40% above average volume are needed to trigger a technical buy signal. Its 50 DMA line ($100.65) defines important near-term support to watch on pullbacks. Fundamentals remain strong.
>>> FEATURED STOCK ARTICLE : Rebound Has Globant Perched Within Striking Distance of High - 12/26/2019 |
View all notes |
Set NEW NOTE alert |
Company Profile |
SEC
News |
Chart |
Request a new note
C
A
S
I |
|
|
|
THESE ARE NOT BUY RECOMMENDATIONS!
Comments contained in the body of this report are technical
opinions only. The material herein has been obtained
from sources believed to be reliable and accurate, however,
its accuracy and completeness cannot be guaranteed.
This site is not an investment advisor, hence it does
not endorse or recommend any securities or other investments.
Any recommendation contained in this report may not
be suitable for all investors and it is not to be deemed
an offer or solicitation on our part with respect to
the purchase or sale of any securities. All trademarks,
service marks and trade names appearing in this report
are the property of their respective owners, and are
likewise used for identification purposes only.
This report is a service available
only to active Paid Premium Members.
You may opt-out of receiving report notifications
at any time. Questions or comments may be submitted
by writing to Premium Membership Services 665 S.E. 10 Street, Suite 201 Deerfield Beach, FL 33441-5634 or by calling 1-800-965-8307
or 954-785-1121.
|
|
|