You are not logged in.
This means you
CAN ONLY VIEW reports that were published prior to Sunday, February 18, 2024.
You
MUST UPGRADE YOUR MEMBERSHIP if you want to see any current reports.
AFTER MARKET UPDATE - FRIDAY, JANUARY 4TH, 2019
Previous After Market Report Next After Market Report >>>
|
|
|
|
DOW |
+746.94 |
23,433.16 |
+3.29% |
|
Volume |
1,104,384,520 |
+15% |
|
Volume |
2,580,528,620 |
-1% |
|
NASDAQ |
+275.36 |
6,738.86 |
+4.26% |
|
Advancers |
2,732 |
91% |
|
Advancers |
2,690 |
86% |
|
S&P 500 |
+84.05 |
2,531.94 |
+3.43% |
|
Decliners |
276 |
9% |
|
Decliners |
432 |
14% |
|
Russell 2000 |
+49.92 |
1,380.75 |
+3.75% |
|
52 Wk Highs |
6 |
|
|
52 Wk Highs |
9 |
|
|
S&P 600 |
+29.51 |
862.32 |
+3.54% |
|
52 Wk Lows |
11 |
|
|
52 Wk Lows |
35 |
|
|
 |
Leadership Remains Elusive Behind Major Indices' Rebound
Kenneth J. Gruneisen - Passed the CAN SLIM® Master's Exam
For the week, the Dow added 1.6% while the S&P 500 and Nasdaq advanced 1.9% and 2.3%, respectively. Stocks finished firmly higher on Friday, with all three major averages gaining more than 3.2%. The Dow rallied 746 points to 23,433 while the S&P 500 climbed 84 points to 2,531. The Nasdaq Composite surged 275 points to 6,738. The volume totals were mixed, higher than the prior session total on the NYSE but slightly lower on the Nasdaq exchange. Advancers led decliners by a decisive a 10-1 margin on the NYSE and more than 6-1 on the Nasdaq exchange. Leadership remained elusive as only one high-ranked company from the Leaders List made a new 52-week high and was listed on the BreakOuts Page. Surprisingly, there were fewer new 52-week highs on both the NYSE and on the Nasdaq exchange versus the prior session, meanwhile, new 52-week lows totals still outnumbered new highs. The major indices (M criteria) are still in a correction. Disciplined investors know that a proper follow-through day requires big gains from at least one the major indices with higher volume and an expansion in leadership (stocks hitting new highs). New leadership was a critical missing element, so additional confirmation will still be needed to signal a change in market direction (M criteria) back to a bullish stance. The Featured Stocks Page provides the most timely analysis on high-ranked leaders. Charts used courtesy of www.stockcharts.com
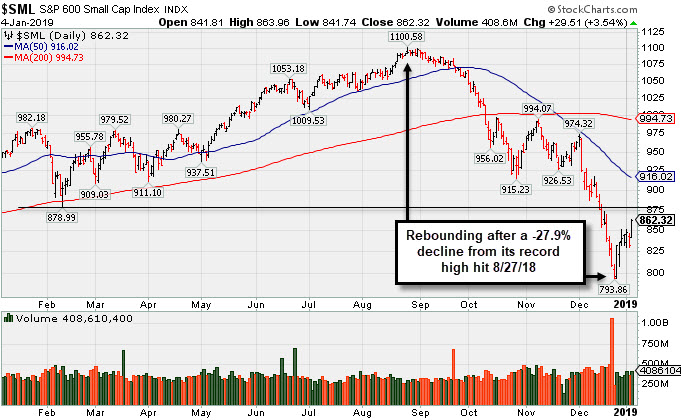
PICTURED: The S&P 600 Small Cap Index is rebounding after a -27.9% decline from its record high hit 8/27/18. It sank well below its 50-day and 200-day moving average (DMA) lines after their negative convergence in mid-November. Friday's gain marked Day 7 of the new rally attempt.
The U.S equity market soared as investors assessed economic and monetary policy updates. On the data front, non-farm payrolls jumped by 312,000 beating projections by the largest margin since 2009. Average hourly earnings increased 3.2% year-over-year in December, which is tied with this past October’s reading as the highest since April 2009. Meanwhile, the unemployment rate rose from a five decade low of 3.7% to 3.9%. In central bank news, Federal Reserve Chairman Jerome Powell suggested the central bank will be “patient” with future rate increases and will monitor economic performance before making decisions.
All 11 S&P 500 sectors ended higher. The Technology and Communication Services groups led gains with the oft-cited “FAANG” group jumping 5.5%. Industrials and Materials also outperformed with both adding 3.9% as investors cheered reports the U.S. and China will reengage in trade discussions early next week.
Treasuries weakened along the curve with the yield on the 10-year note up ten basis points to 2.66%. In commodities, WTI crude added 2.4% to $48.24/barrel. COMEX gold lost 0.7% to $1286.00/ounce despite a weaker dollar. |
 Kenneth J. Gruneisen started out as a licensed stockbroker in August 1987, a couple of months prior to the historic stock market crash that took the Dow Jones Industrial Average down -22.6% in a single day. He has published daily fact-based fundamental and technical analysis on high-ranked stocks online for two decades. Through FACTBASEDINVESTING.COM, Kenneth provides educational articles, news, market commentary, and other information regarding proven investment systems that work in good times and bad.
Comments contained in the body of this report are technical opinions only and are not necessarily those of Gruneisen Growth Corp. The material herein has been obtained from sources believed to be reliable and accurate, however, its accuracy and completeness cannot be guaranteed. Our firm, employees, and customers may effect transactions, including transactions contrary to any recommendation herein, or have positions in the securities mentioned herein or options with respect thereto. Any recommendation contained in this report may not be suitable for all investors and it is not to be deemed an offer or solicitation on our part with respect to the purchase or sale of any securities. |
|
 |
Retail, Financial, Tech, and Energy-Linked Groups Rose
Kenneth J. Gruneisen - Passed the CAN SLIM® Master's Exam
The Retail Index ($RLX +3.50%), Bank Index ($BKX +3.43%), and the Broker/Dealer Index ($XBD +3.84%) each posted a solid gain. The Semiconductor Index ($SOX +4.37%), Networking Index ($NWX +3.24%) and the Biotech Index ($BTK +5.27%) posted unanimous gains. Energy-linked groups also had a positive bias as the Oil Services Index ($OSX +4.61%) and the Integrated Oil Index ($XOI +3.74%) rose, meanwhile, the Gold & Silver Index ($XAU -0.42%) was a standout decliner.
Charts courtesy of www.stockcharts.com
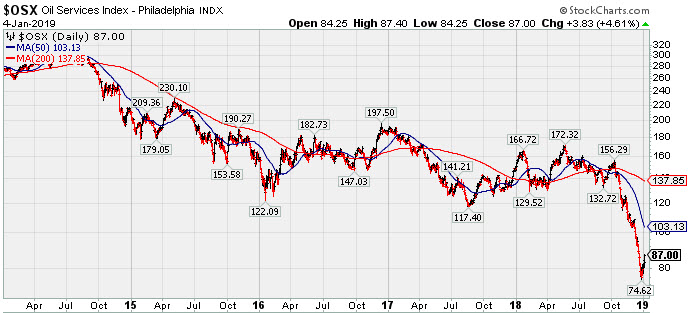 PICTURED: The 5-year chart of the Oil Services Index ($OSX +4.61%) shows it rebounding after a steep decline in the last quarter of 2018.
| Oil Services |
$OSX |
87.00 |
+3.84 |
+4.62% |
+7.94% |
| Integrated Oil |
$XOI |
1,214.78 |
+43.85 |
+3.74% |
+4.80% |
| Semiconductor |
$SOX |
1,143.96 |
+47.93 |
+4.37% |
-0.97% |
| Networking |
$NWX |
491.09 |
+15.39 |
+3.24% |
+0.50% |
| Broker/Dealer |
$XBD |
244.90 |
+9.07 |
+3.84% |
+3.19% |
| Retail |
$RLX |
2,005.29 |
+67.89 |
+3.50% |
+2.76% |
| Gold & Silver |
$XAU |
71.87 |
-0.30 |
-0.42% |
+1.71% |
| Bank |
$BKX |
89.18 |
+2.96 |
+3.43% |
+3.95% |
| Biotech |
$BTK |
4,405.60 |
+220.62 |
+5.27% |
+4.38% |
|
|
|
 |
Found Prompt Support Near 50-Day Moving Average Line
Kenneth J. Gruneisen - Passed the CAN SLIM® Master's Exam
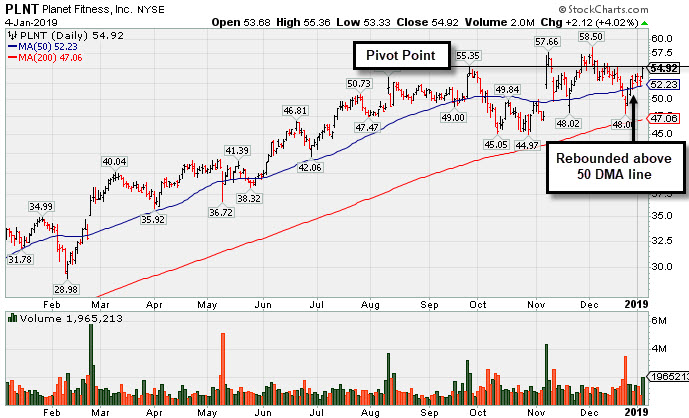
Planet Fitness Inc Cl A (PLNT +$2.12 or +4.02% to $54.92) is consolidating above its 50-day moving average (DMA) line ($52.23) after finding prompt in recent weeks. It faces little resistance due to overhead supply up to the $58.50 level. The recent low ($48.00) and its 200 DMA line ($47.06) define the important near-term support.is still perched near its all-time high, showing strength and resilience in an unhealthy market environment. Its 50-day moving average (DMA) line and recent low ($48.02 on 11/20/18) define important near-term support to watch on pullbacks.
Bullish action came after it reported earnings +47% on +40% sales revenues for the Sep '18 quarter, marking a 3rd consecutive quarterly earnings comparison above the +25% minimum guideline (C criteria). Recent comparisons showed impressive sales revenues acceleration. Annual earnings (A criteria) history included a small downturn in FY '15 but has been strong since. Completed its Aug 2015 IPO at $14.06 and completed Secondary Offerings on 6/22/16, 9/26/16, 3/10/17 and 5/08/17.
The number of top-rated funds owning its shares rose from 373 in Dec '17 to 497 in Sep '18, a reassuring sign concerning the I criteria. The current Up/Down Volume Ratio of 1.0 is an unbiased indication its shares have been neutral concerning accumulation/distribution over the past 50 days. It has earned a Timeliness Rating of A and Sponsorship Rating of B. Its small supply of 80.2 million shares in the public float can contribute to greater price volatility in the event of institutional buying or selling.
Charts courtesy of www.stockcharts.com
 |
|
|
Color Codes Explained :
Y - Better candidates highlighted by our
staff of experts.
G - Previously featured
in past reports as yellow but may no longer be buyable under the
guidelines.
***Last / Change / Volume data in this table is the closing quote data***
Symbol/Exchange
Company Name
Industry Group |
PRICE |
CHANGE
(%Change) |
Day High |
Volume
(% DAV)
(% 50 day avg vol) |
52 Wk Hi
% From Hi |
Featured
Date |
Price
Featured |
Pivot Featured |
|
Max Buy |
MLR
-
NYSE
Miller Industries Inc
AUTOMOTIVE - Auto Parts
|
$27.92
|
+0.97
3.60% |
$28.16
|
32,008
88.91% of 50 DAV
50 DAV is 36,000
|
$29.40
-5.03%
|
11/30/2018
|
$28.35
|
PP = $29.50
|
|
MB = $30.98
|
 Most Recent Note - 1/4/2019 6:26:18 PM
Y - Consolidating above its closely coinciding 50-day and 200-day moving average (DMA) lines. Little resistance remains due to overhead supply up to the $29 level.
>>> FEATURED STOCK ARTICLE : Failed to Produce Buy Signal and Deterioration Raised Concern - 12/20/2018 |
View all notes |
Set NEW NOTE alert |
Company Profile |
SEC
News |
Chart |
Request a new note
C
A
S
I |
UBNT
-
NASDAQ
Ubiquiti Networks
TELECOMMUNICATIONS - Diversified Communication Serv
|
$99.94
|
+3.99
4.16% |
$100.66
|
317,965
70.82% of 50 DAV
50 DAV is 449,000
|
$115.44
-13.43%
|
11/9/2018
|
$108.20
|
PP = $101.43
|
|
MB = $106.50
|
Most Recent Note - 1/4/2019 6:30:42 PM
G - Its 50 DMA line ($101.60) recently acted as resistance. A rebound above the 50 DMA line is needed for its outlook to improve. Fundamentals remain strong. See the latest FSU analysis for more details and an annotated graph.
>>> FEATURED STOCK ARTICLE : Needs Rebound Above 50-Day Average to Help Outlook - 1/2/2019 |
View all notes |
Set NEW NOTE alert |
Company Profile |
SEC
News |
Chart |
Request a new note
C
A
S
I |
PLNT
-
NYSE
Planet Fitness Inc Cl A
Leisure-Services
|
$54.92
|
+2.12
4.02% |
$55.36
|
1,971,725
158.50% of 50 DAV
50 DAV is 1,244,000
|
$58.50
-6.12%
|
11/7/2018
|
$57.10
|
PP = $55.45
|
|
MB = $58.22
|
Most Recent Note - 1/4/2019 6:29:04 PM
Y - Posted a solid gain with above average volume. Its 50 DMA line ($52.23) and recent low define important near-term support to watch. Little resistance remains due to overhead supply up to the $58.50 level. See the latest FSU analysis for more details and a new annotated graph.
>>> FEATURED STOCK ARTICLE : Found Prompt Support Near 50-Day Moving Average Line - 1/4/2019 |
View all notes |
Set NEW NOTE alert |
Company Profile |
SEC
News |
Chart |
Request a new note
C
A
S
I |
INVA
-
NASDAQ
Innoviva Inc
Medical-Biomed/Biotech
|
$17.84
|
+0.96
5.69% |
$18.03
|
1,678,971
143.62% of 50 DAV
50 DAV is 1,169,000
|
$18.60
-4.09%
|
11/23/2018
|
$17.74
|
PP = $18.09
|
|
MB = $18.99
|
Most Recent Note - 1/4/2019 6:25:26 PM
Y - Posted a solid gain with above average volume challenging prior highs. Its 50 DMA line ($16.60) and prior low define important near-term support. Faces little resistance due to overhead supply. A volume-driven gain above the pivot point is still needed to trigger a technical buy signal. See the latest FSU analysis for more details and an annotated graph.
>>> FEATURED STOCK ARTICLE : Consolidating Above 50-Day Average Line Near High - 1/3/2019 |
View all notes |
Set NEW NOTE alert |
Company Profile |
SEC
News |
Chart |
Request a new note
C
A
S
I |
|
|
|
THESE ARE NOT BUY RECOMMENDATIONS!
Comments contained in the body of this report are technical
opinions only. The material herein has been obtained
from sources believed to be reliable and accurate, however,
its accuracy and completeness cannot be guaranteed.
This site is not an investment advisor, hence it does
not endorse or recommend any securities or other investments.
Any recommendation contained in this report may not
be suitable for all investors and it is not to be deemed
an offer or solicitation on our part with respect to
the purchase or sale of any securities. All trademarks,
service marks and trade names appearing in this report
are the property of their respective owners, and are
likewise used for identification purposes only.
This report is a service available
only to active Paid Premium Members.
You may opt-out of receiving report notifications
at any time. Questions or comments may be submitted
by writing to Premium Membership Services 665 S.E. 10 Street, Suite 201 Deerfield Beach, FL 33441-5634 or by calling 1-800-965-8307
or 954-785-1121.
|
|
|

