You are not logged in.
This means you
CAN ONLY VIEW reports that were published prior to Tuesday, February 20, 2024.
You
MUST UPGRADE YOUR MEMBERSHIP if you want to see any current reports.
AFTER MARKET UPDATE - FRIDAY, JANUARY 3RD, 2020
Previous After Market Report Next After Market Report >>>
|
|
|
|
DOW |
-233.92 |
28,634.88 |
-0.81% |
|
Volume |
932,139,590 |
+8% |
|
Volume |
2,555,713,100 |
-10% |
|
NASDAQ |
-71.42 |
9,020.77 |
-0.79% |
|
Advancers |
1,345 |
48% |
|
Advancers |
1,146 |
36% |
|
S&P 500 |
-23.00 |
3,234.85 |
-0.71% |
|
Decliners |
1,482 |
52% |
|
Decliners |
2,051 |
64% |
|
Russell 2000 |
-7.60 |
1,660.87 |
-0.46% |
|
52 Wk Highs |
145 |
|
|
52 Wk Highs |
108 |
|
|
S&P 600 |
+0.10 |
1,020.93 |
+0.01% |
|
52 Wk Lows |
9 |
|
|
52 Wk Lows |
13 |
|
|
 |
Major Indices Pull Back as Tensions in Middle East Rise
Kenneth J. Gruneisen - Passed the CAN SLIM® Master's Exam
The Dow fell 233 points, to end the week down less than 0.1%. The S&P 500 lost 0.7% to finish the week 0.2% lower, while also snapping a five week winning streak. The Nasdaq Composite dipped 0.8%, however eked out a 0.2% gain for the week. Decliners led advancers by a narrow margin on the NYSE and nearly 2-1 on the Nasdaq exchange. The volume was higher than the prior session total on the NYSE and lighter on the Nasdaq exchange. There were 64 high-ranked companies from the Leaders List that hit a new 52-week high and were listed on the BreakOuts Page, versus the total of 71 on the prior session. New 52-week highs totals expanded and easily outnumbered new 52-week lows totals on the NYSE and on the Nasdaq exchange. The major indices (M criteria) are in a "confirmed uptrend" after enduring distributional pressure in recent weeks. The Featured Stocks Page provides the most timely analysis on high-ranked leaders. Charts used courtesy of www.stockcharts.com
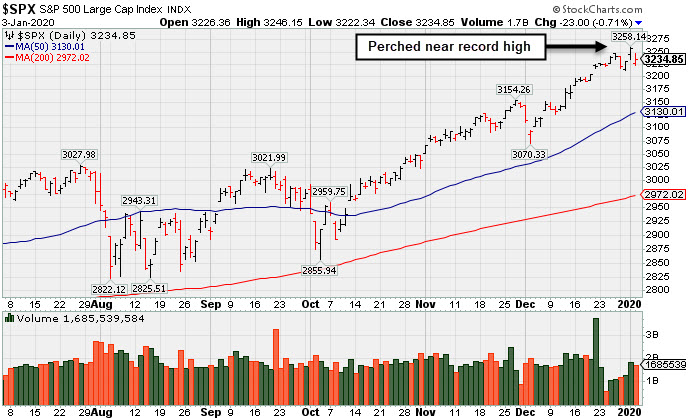
PICTURED: The S&P 500 Index is perched near its record high.
Stocks finished lower Friday as investors weighed rising geopolitical tensions in the Middle East and a disappointing factory data report. U.S. officials confirmed reports that they conducted an airstrike in Baghdad, killing a top Iranian military general. WTI crude advanced 3.0% to $63.05/barrel, briefly touching its highest level since April. Perceived safe haven assets caught a bid, as COMEX gold added 1.5% to $1,551.50/ounce, near its best level in six years. Treasuries strengthened the most in a month, with the yield on the 10-year note sliding nine basis points to 1.79%.
On the data front, the ISM’s gauge of manufacturing activity dropped to 47.2 in December, the worst reading since June 2009 and marking the fifth-straight month of contraction. Separately, construction spending rose 0.6% in November, rebounding from the prior month’s modest 0.1% uptick. In central bank news, the minutes from the December Federal Reserve meeting showed officials believe the current monetary policy is likely to remain appropriate “for a time.”
Nine of 11 S&P 500 sectors finished lower with only the defensive Utilities and Real Estate groups advancing. Financials performed the worst amid the drop in Treasury yields. The jump in oil prices also pressured airlines, with American Airlines (AAL -4.95%) falling.
|
 Kenneth J. Gruneisen started out as a licensed stockbroker in August 1987, a couple of months prior to the historic stock market crash that took the Dow Jones Industrial Average down -22.6% in a single day. He has published daily fact-based fundamental and technical analysis on high-ranked stocks online for two decades. Through FACTBASEDINVESTING.COM, Kenneth provides educational articles, news, market commentary, and other information regarding proven investment systems that work in good times and bad.
Comments contained in the body of this report are technical opinions only and are not necessarily those of Gruneisen Growth Corp. The material herein has been obtained from sources believed to be reliable and accurate, however, its accuracy and completeness cannot be guaranteed. Our firm, employees, and customers may effect transactions, including transactions contrary to any recommendation herein, or have positions in the securities mentioned herein or options with respect thereto. Any recommendation contained in this report may not be suitable for all investors and it is not to be deemed an offer or solicitation on our part with respect to the purchase or sale of any securities. |
|
 |
Retail, Financial, and Tech Groups Fell
Kenneth J. Gruneisen - Passed the CAN SLIM® Master's Exam
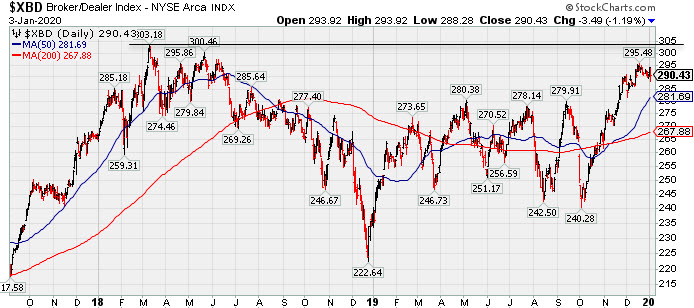
The Retail Index ($RLX -0.85%), Broker/Dealer Index ($XBD -1.19%), and the Bank Index ($BKX -1.43%) posted unanimous losses. The tech sector had a negative bias as the Biotech Index ($BTK -1.15%), Semiconductor Index ($SOX -1.80%), and the Networking Index ($NWX -0.88%) each fell. The Gold & Silver Index ($XAU -1.03%) and the Integrated Oil Index ($XOI -0.390%) were lower while the Oil Services Index ($OSX +1.30%) was a standout gainer.
PICTURED: The Broker/Dealer Index ($XBD -1.19%) is perched -4.3% off its record high hit in March 2018.
| Oil Services |
$OSX |
79.84 |
+1.03 |
+1.31% |
+1.98% |
| Integrated Oil |
$XOI |
1,278.22 |
-5.02 |
-0.39% |
+0.60% |
| Semiconductor |
$SOX |
1,853.98 |
-33.93 |
-1.80% |
+0.24% |
| Networking |
$NWX |
583.21 |
-5.19 |
-0.88% |
-0.03% |
| Broker/Dealer |
$XBD |
290.43 |
-3.49 |
-1.19% |
+0.02% |
| Retail |
$RLX |
2,462.62 |
-21.08 |
-0.85% |
+0.55% |
| Gold & Silver |
$XAU |
105.41 |
-1.10 |
-1.03% |
-1.41% |
| Bank |
$BKX |
112.48 |
-1.64 |
-1.44% |
-0.78% |
| Biotech |
$BTK |
4,985.40 |
-57.89 |
-1.15% |
-1.62% |
|
|
|
 |
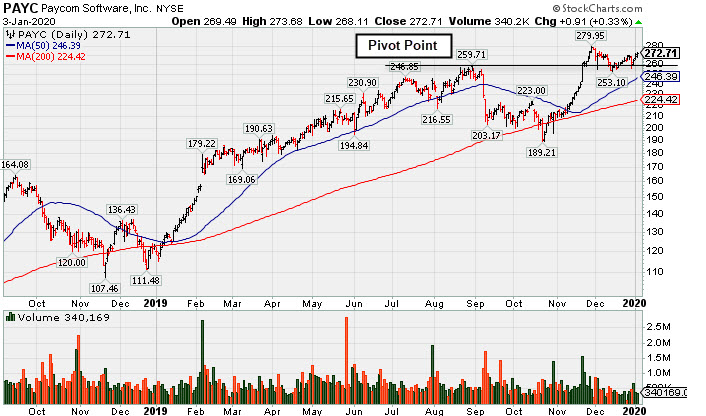
Perched Near High and Near the Max Buy Level
Kenneth J. Gruneisen - Passed the CAN SLIM® Master's Exam
Paycom Software Inc (PAYC -$3.43 or -1.29% to $262.07) is still trading just below its "max buy" level. The recent low ($253.10 on 12/13/19) defines initial support to watch above its 50-day moving average (DMA) line ($246.40).
PAYC finished strong after highlighted in yellow with new pivot point cited based on its 8/29/19 high plus 10 cents in the 11/20/19 mid-day report (read here). The gain for a new high was backed by +167% above average volume and triggered a new technical buy signal. It was last shown in this FSU section on 12/11/19 under the headline "Consolidating Near Prior Highs Which Define Initial Support". Fundamentals have been strong. It reported earnings +35% on +31% sales revenues for the Sep '19 quarter.
The Computer Software - Enterprise firm's current Up/Down Volume Ratio of 2.7 is an unbiased indication its shares have been under accumulation over the past 50 days. Its small supply of only 58.4 million shares outstanding (S criteria) can contribute to greater price volatility in the event of institutional buying or selling. The number of top-rated funds owning its shares rose from 384 in Jun '17 to 879 in Sep '19, a reassuring sign concerning the I criteria. It has a Timeliness rating of A and Sponsorship rating of B. It completed Secondary Offerings on 11/13/15, 9/16/15, 5/15/15 and 1/14/15 since its $15 IPO on 4/15/14. |
|
|
Color Codes Explained :
Y - Better candidates highlighted by our
staff of experts.
G - Previously featured
in past reports as yellow but may no longer be buyable under the
guidelines.
***Last / Change / Volume data in this table is the closing quote data***
Symbol/Exchange
Company Name
Industry Group |
PRICE |
CHANGE
(%Change) |
Day High |
Volume
(% DAV)
(% 50 day avg vol) |
52 Wk Hi
% From Hi |
Featured
Date |
Price
Featured |
Pivot Featured |
|
Max Buy |
 MLR
-
NYSE
MLR
-
NYSE
Miller Industries Inc
AUTOMOTIVE - Auto Parts
|
$36.52
|
-0.38
-1.03% |
$36.90
|
20,434
44.42% of 50 DAV
50 DAV is 46,000
|
$38.18
-4.35%
|
9/24/2019
|
$34.00
|
PP = $35.36
|
|
MB = $37.13
|
Most Recent Note - 1/2/2020 4:44:22 PM
G - Still quietly hovering near its 52-week high and just above its "max buy" level. Its 50 DMA line ($36.15) and prior highs in the $35 area define near-term support to watch. Resilient after reporting Sep '19 earnings which were below the fundamental guidelines of the fact-based investment system.
>>> FEATURED STOCK ARTICLE : Towing/Recovery Equipment Firm Remains Perched Near Record High - 12/27/2019 |
View all notes |
Set NEW NOTE alert |
Company Profile |
SEC
News |
Chart |
Request a new note
C
A
S
I |
CCBG
-
NASDAQ
Capital City Bk Gp
BANKING - Regional - Mid-Atlantic Banks
|
$29.84
|
-0.34
-1.13% |
$30.18
|
34,852
75.77% of 50 DAV
50 DAV is 46,000
|
$30.95
-3.59%
|
12/16/2019
|
$30.07
|
PP = $30.95
|
|
MB = $32.50
|
Most Recent Note - 1/2/2020 3:59:16 PM
Y - Hovering within close striking distance of its 52-week high, recently meeting resistance. Subsequent gains and a strong close above the new pivot point cited based on its 11/06/19 high plus 10 cents may trigger a new (or add-on) technical buy signal. Found support at its 50 DMA line ($29.47) during its orderly consolidation.
>>> FEATURED STOCK ARTICLE : Perched Near 52-Week High After Forming an Orderly Base - 1/2/2020 |
View all notes |
Set NEW NOTE alert |
Company Profile |
SEC
News |
Chart |
Request a new note
C
A
S
I |
FTNT
-
NASDAQ
Fortinet Inc
Computer Sftwr-Security
|
$111.21
|
+1.53
1.39% |
$111.53
|
1,319,454
97.09% of 50 DAV
50 DAV is 1,359,000
|
$110.28
0.84%
|
12/9/2019
|
$103.85
|
PP = $106.10
|
|
MB = $111.41
|
Most Recent Note - 12/30/2019 6:27:03 PM
Y - Volume totals have been cooling while stubbornly holding its ground near its 52-week high. Confirming gains above the pivot point backed by at least +40% above average volume are needed to trigger a convincing technical buy signal. Its 50 DMA line ($98.09) and prior high in the $97 area define important near-term support to watch.
>>> FEATURED STOCK ARTICLE : Endured Distributional Pressure While Perched at High - 12/23/2019 |
View all notes |
Set NEW NOTE alert |
Company Profile |
SEC
News |
Chart |
Request a new note
C
A
S
I |
SPSC
-
NASDAQ
S P S Commerce Inc
COMPUTER SOFTWARE and SERVICES - Application Software
|
$55.88
|
-0.22
-0.39% |
$56.12
|
142,605
70.81% of 50 DAV
50 DAV is 201,400
|
$59.14
-5.51%
|
11/29/2019
|
$56.59
|
PP = $59.24
|
|
MB = $62.20
|
Most Recent Note - 1/2/2020 4:09:53 PM
Y - Still perched -5.3% off its all-time high. Subsequent gains above its pivot point backed by at least +40% above average volume are needed to trigger a new technical buy signal. Fundamentals remain strong, however, its Relative Strength Rating has slumped to 78, below the 80+ minimum guideline for buy candidates..
>>> FEATURED STOCK ARTICLE : Perched Within Close Striking Distance of 52-Week High - 12/20/2019 |
View all notes |
Set NEW NOTE alert |
Company Profile |
SEC
News |
Chart |
Request a new note
C
A
S
I |
AUDC
-
NASDAQ
Audiocodes Ltd
ELECTRONICS - Scientific and Technical Instrum
|
$25.61
|
-0.72
-2.73% |
$26.20
|
209,367
76.97% of 50 DAV
50 DAV is 272,000
|
$26.00
-1.50%
|
9/13/2019
|
$19.68
|
PP = $19.84
|
|
MB = $20.83
|
 Most Recent Note - 1/3/2020 5:16:49 PM
G - Pulled back from its all-time high today after getting very extended from the previously noted base. Prior highs in the $22 area define support along with its 50 DMA line ($23.21). Fundamentals remain strong.
>>> FEATURED STOCK ARTICLE : Reversed Into Red After Hitting Yet Another New High - 12/13/2019 |
View all notes |
Set NEW NOTE alert |
Company Profile |
SEC
News |
Chart |
Request a new note
C
A
S
I |
Symbol/Exchange
Company Name
Industry Group |
PRICE |
CHANGE
(%Change) |
Day High |
Volume
(% DAV)
(% 50 day avg vol) |
52 Wk Hi
% From Hi |
Featured
Date |
Price
Featured |
Pivot Featured |
|
Max Buy |
CHDN
-
NASDAQ
Churchill Downs Inc
LEISURE - Gaming Activities
|
$134.94
|
-0.85
-0.63% |
$135.56
|
256,089
98.12% of 50 DAV
50 DAV is 261,000
|
$138.17
-2.34%
|
10/8/2019
|
$129.77
|
PP = $132.83
|
|
MB = $139.47
|
Most Recent Note - 12/30/2019 6:23:21 PM
G - Posted a 3rd consecutive gain today with light volume while hitting a new 52-week high. Its 50 DMA line ($130.63) defines near-term support above the prior low ($121.81 on 11/07/19) The Jun and Sep '19 quarterly earnings versus the year ago periods were both below the +25% minimum guideline (C criteria) and raised fundamental concerns. See the latest FSU analysis for more details and a new annotated graph.
>>> FEATURED STOCK ARTICLE : Touched a New HIgh With Gains Backed by Light Volume - 12/30/2019 |
View all notes |
Set NEW NOTE alert |
Company Profile |
SEC
News |
Chart |
Request a new note
C
A
S
I |
LULU
-
NASDAQ
Lululemon Athletica
MANUFACTURING - Textile Manufacturing
|
$232.64
|
-0.78
-0.33% |
$234.50
|
1,278,952
63.60% of 50 DAV
50 DAV is 2,011,000
|
$235.50
-1.21%
|
9/6/2019
|
$201.25
|
PP = $194.35
|
|
MB = $204.07
|
Most Recent Note - 12/30/2019 6:28:24 PM
G - Extended from any sound base, and its 50 DMA line ($217) defines near-term support above the prior high ($209). Recently reported earnings +28% on +23% sales revenues for the Oct '19 quarter.
>>> FEATURED STOCK ARTICLE : Retreated From High After Another Strong Earnings Report - 12/17/2019 |
View all notes |
Set NEW NOTE alert |
Company Profile |
SEC
News |
Chart |
Request a new note
C
A
S
I |
CPRT
-
NASDAQ
Copart Inc
SPECIALTY RETAIL - Auto Dealerships
|
$92.66
|
-0.82
-0.88% |
$92.78
|
1,241,596
68.52% of 50 DAV
50 DAV is 1,812,000
|
$92.41
0.27%
|
1/2/2020
|
$92.80
|
PP = $92.51
|
|
MB = $97.14
|
Most Recent Note - 1/2/2020 4:04:34 PM
Y - Posted a gain today with near average volume for a new all-time high. Color code is changed to yellow with new pivot point cited based on its 11/25/19 high plus 10 cents. Subsequent gains above the pivot point must have at least +40% above average volume to trigger a proper new (or add-on) technical buy signal. Its 50 DMA line ($86.92) defines near-term support. Fundamentals remain strong.
>>> FEATURED STOCK ARTICLE : Extended From Prior Base and Hovering Near Record High - 12/12/2019 |
View all notes |
Set NEW NOTE alert |
Company Profile |
SEC
News |
Chart |
Request a new note
C
A
S
I |
NMIH
-
NASDAQ
N M I Holdings Inc Cl A
Finance-MrtgandRel Svc
|
$32.35
|
+0.08
0.25% |
$32.52
|
661,106
130.14% of 50 DAV
50 DAV is 508,000
|
$35.79
-9.61%
|
11/8/2019
|
$32.89
|
PP = $31.44
|
|
MB = $33.01
|
Most Recent Note - 1/2/2020 12:22:27 PM
G - Violating its 50 DMA line ($32.46) with today's loss on higher volume raising concerns. Only a prompt rebound would help its outlook improve. Prior highs in the $30-31 area define the next important near-term support. Fundamentals remain strong.
>>> FEATURED STOCK ARTICLE : Hit New High But Encountered Distributional Pressure - 12/19/2019 |
View all notes |
Set NEW NOTE alert |
Company Profile |
SEC
News |
Chart |
Request a new note
C
A
S
I |
SPLK
-
NASDAQ
Splunk Inc
Computer Sftwr-Database
|
$152.06
|
+0.08
0.05% |
$152.50
|
883,562
43.96% of 50 DAV
50 DAV is 2,010,000
|
$153.66
-1.04%
|
11/25/2019
|
$147.79
|
PP = $142.16
|
|
MB = $149.27
|
Most Recent Note - 12/30/2019 6:30:50 PM
Y - Color code is changed to yellow while consolidating just below its "max buy" level with losses on light volume. Prior highs in the $142-143 area define initial support to watch on pullbacks.
>>> FEATURED STOCK ARTICLE : Consolidating Above Prior Highs Following Impressive Rally - 12/16/2019 |
View all notes |
Set NEW NOTE alert |
Company Profile |
SEC
News |
Chart |
Request a new note
C
A
S
I |
Symbol/Exchange
Company Name
Industry Group |
PRICE |
CHANGE
(%Change) |
Day High |
Volume
(% DAV)
(% 50 day avg vol) |
52 Wk Hi
% From Hi |
Featured
Date |
Price
Featured |
Pivot Featured |
|
Max Buy |
PAYC
-
NYSE
Paycom Software Inc
COMPUTER SOFTWARE and SERVICES - Application Software
|
$272.71
|
+0.91
0.33% |
$273.68
|
340,169
60.96% of 50 DAV
50 DAV is 558,000
|
$279.95
-2.59%
|
11/20/2019
|
$252.97
|
PP = $259.81
|
|
MB = $272.80
|
Most Recent Note - 12/30/2019 6:29:35 PM
Y - Still consolidating above its pivot point and below its "max buy" level. Fundamentals remain strong.
>>> FEATURED STOCK ARTICLE : Perched Near High and Near the Max Buy Level - 1/3/2020 |
View all notes |
Set NEW NOTE alert |
Company Profile |
SEC
News |
Chart |
Request a new note
C
A
S
I |
BLD
-
NYSE
Topbuild Corp
Bldg-Constr Prds/Misc
|
$103.38
|
+0.27
0.26% |
$104.12
|
243,888
82.39% of 50 DAV
50 DAV is 296,000
|
$113.74
-9.11%
|
12/9/2019
|
$109.71
|
PP = $113.84
|
|
MB = $119.53
|
Most Recent Note - 12/30/2019 6:32:22 PM
G - A rebound above its 50 DMA line ($105.87) still is needed for its outlook to improve.
>>> FEATURED STOCK ARTICLE : Recent Slump Below 50-Day Moving Average Did Technical Damage - 12/24/2019 |
View all notes |
Set NEW NOTE alert |
Company Profile |
SEC
News |
Chart |
Request a new note
C
A
S
I |
GLOB
-
NYSE
Globant SA
Computer-Tech Services
|
$108.58
|
+0.84
0.78% |
$109.01
|
156,178
57.84% of 50 DAV
50 DAV is 270,000
|
$112.33
-3.34%
|
11/14/2019
|
$106.87
|
PP = $112.43
|
|
MB = $118.05
|
Most Recent Note - 1/2/2020 4:06:28 PM
Y - Color code is changed to yellow while perched only -4.1% off its 52-week high. Subsequent gains above the pivot point backed by at least +40% above average volume are needed to trigger a technical buy signal. Its 50 DMA line ($100.65) defines important near-term support to watch on pullbacks. Fundamentals remain strong.
>>> FEATURED STOCK ARTICLE : Rebound Has Globant Perched Within Striking Distance of High - 12/26/2019 |
View all notes |
Set NEW NOTE alert |
Company Profile |
SEC
News |
Chart |
Request a new note
C
A
S
I |
|
|
|
THESE ARE NOT BUY RECOMMENDATIONS!
Comments contained in the body of this report are technical
opinions only. The material herein has been obtained
from sources believed to be reliable and accurate, however,
its accuracy and completeness cannot be guaranteed.
This site is not an investment advisor, hence it does
not endorse or recommend any securities or other investments.
Any recommendation contained in this report may not
be suitable for all investors and it is not to be deemed
an offer or solicitation on our part with respect to
the purchase or sale of any securities. All trademarks,
service marks and trade names appearing in this report
are the property of their respective owners, and are
likewise used for identification purposes only.
This report is a service available
only to active Paid Premium Members.
You may opt-out of receiving report notifications
at any time. Questions or comments may be submitted
by writing to Premium Membership Services 665 S.E. 10 Street, Suite 201 Deerfield Beach, FL 33441-5634 or by calling 1-800-965-8307
or 954-785-1121.
|
|
|