You are not logged in.
This means you
CAN ONLY VIEW reports that were published prior to Monday, February 19, 2024.
You
MUST UPGRADE YOUR MEMBERSHIP if you want to see any current reports.
AFTER MARKET UPDATE - THURSDAY, JANUARY 3RD, 2019
Previous After Market Report Next After Market Report >>>
|
|
|
|
DOW |
-660.02 |
22,686.22 |
-2.83% |
|
Volume |
958,109,270 |
-0% |
|
Volume |
2,603,259,350 |
+14% |
|
NASDAQ |
-202.44 |
6,463.50 |
-3.04% |
|
Advancers |
1,242 |
42% |
|
Advancers |
938 |
31% |
|
S&P 500 |
-62.14 |
2,447.89 |
-2.48% |
|
Decliners |
1,742 |
58% |
|
Decliners |
2,128 |
69% |
|
Russell 2000 |
-17.73 |
1,330.83 |
-1.31% |
|
52 Wk Highs |
12 |
|
|
52 Wk Highs |
12 |
|
|
S&P 600 |
-15.52 |
832.81 |
-1.83% |
|
52 Wk Lows |
40 |
|
|
52 Wk Lows |
56 |
|
|
 |
Major Indices Fell After Apple Lowered Guidance
Kenneth J. Gruneisen - Passed the CAN SLIM® Master's Exam
Stocks finished firmly lower Thursday. The Dow fell 660 points to 22,686 while the S&P 500 lost 62 points to 2,477. The Nasdaq Composite slipped 202 points to 6,463. The volume totals were mixed, lighter than the prior session total on the NYSE and higher on the Nasdaq exchange. Decliners led advancers by almost a 3-2 margin on the NYSE and more than 2-1 on the Nasdaq exchange. Leadership remained elusive as only one high-ranked company from the Leaders List made a new 52-week high and was listed on the BreakOuts Page. New 52-week lows totals contracted yet still outnumbered new 52-week highs totals on both the NYSE and on the Nasdaq exchange. The major indices (M criteria) are still in a correction. Disciplined investors will wait for a convincing follow-through day, ideally between Day 4 and Day 7 of the rally attempt, to signal a change in market direction (M criteria) back to a bullish stance. The Featured Stocks Page provides the most timely analysis on high-ranked leaders. Charts used courtesy of www.stockcharts.com
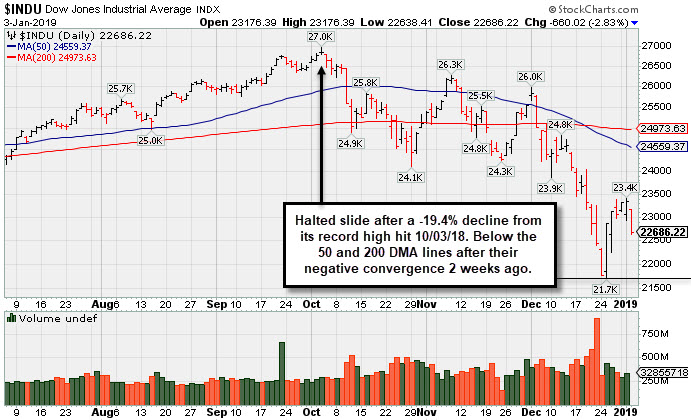
PICTURED: The Dow Jones Industrial Average halted its slide after a -19.4% decline from its record high hit 10/03/18. It sank well below its 50-day and 200-day moving average (DMA) lines after their negative convergence two weeks ago. Thursday's loss marked Day 6 of the new rally attempt.
U.S. stocks suffered through a volatile session after a cautious update from Apple renewed concerns that global growth is slowing. In a surprise preannouncement, Apple CEO Tim Cook cut the iPhone maker’s revenue guidance for the first time in 15-years citing weak iPhone demand in China as a key factor. Shares of Apple (AAPL -9.96%) sank, the worst daily loss since 2013 and finished at the lowest level since July 2017. The Information Technology sector led losses as the group fell 5.1%. The “defensive” Utilities and Real Estate stocks were the lone outperformers.
A disappointing economic update also weighed on sentiment as a report showed manufacturing activity fell to a two-year low in December. A separate release revealed private payrolls increased 271,000 in December, easily topping projections and November’s downwardly revised 157,000 tally. Additionally, initial jobless claims came in at a four-week low of 231,000 during the most recent period.
In M&A news, Celgene (CELG +20.69%) rose on news Bristol-Myers-Squibb (BMY -13.94%) will acquire the drug-maker for $74 billion.
Treasuries finished stronger along the curve as the yield on the 10-year note fell six basis points to 2.56%. In commodities, WTI crude added 1.3% to $47.12/barrel. COMEX gold climbed 0.9% to $1,295.50/ounce. |
 Kenneth J. Gruneisen started out as a licensed stockbroker in August 1987, a couple of months prior to the historic stock market crash that took the Dow Jones Industrial Average down -22.6% in a single day. He has published daily fact-based fundamental and technical analysis on high-ranked stocks online for two decades. Through FACTBASEDINVESTING.COM, Kenneth provides educational articles, news, market commentary, and other information regarding proven investment systems that work in good times and bad.
Comments contained in the body of this report are technical opinions only and are not necessarily those of Gruneisen Growth Corp. The material herein has been obtained from sources believed to be reliable and accurate, however, its accuracy and completeness cannot be guaranteed. Our firm, employees, and customers may effect transactions, including transactions contrary to any recommendation herein, or have positions in the securities mentioned herein or options with respect thereto. Any recommendation contained in this report may not be suitable for all investors and it is not to be deemed an offer or solicitation on our part with respect to the purchase or sale of any securities. |
|
 |
Commodity-Linked Groups Posted Standout Gains
Kenneth J. Gruneisen - Passed the CAN SLIM® Master's Exam
The Retail Index ($RLX -1.99%), Bank Index ($BKX -1.28%), and the Broker/Dealer Index ($XBD -1.53%) fell. The Semiconductor Index ($SOX -5.94%) was a standout decliner while the Networking Index ($NWX -2.59%) followed and the Biotech Index ($B TK -0.73%) suffered a smaller loss. Commodity-linked groups had a positive bias as the Gold & Silver Index ($XAU +1.73%) outpaced the Oil Services Index ($OSX +0.98%), but the Integrated Oil Index ($XOI -0.86%) lost ground.
Charts courtesy of www.stockcharts.com
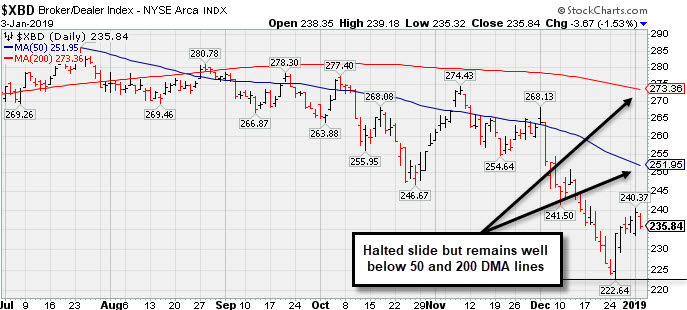 PICTURED: The Broker/Dealer Index ($XBD -1.53%) pulled back today. Recently it halted its slide yet remains well below both the 50-day and 200-day moving average (DMA) lines.
| Oil Services |
$OSX |
83.16 |
+0.80 |
+0.97% |
+3.18% |
| Integrated Oil |
$XOI |
1,170.92 |
-10.16 |
-0.86% |
+1.02% |
| Semiconductor |
$SOX |
1,096.03 |
-69.27 |
-5.94% |
-5.12% |
| Networking |
$NWX |
475.70 |
-12.64 |
-2.59% |
-2.65% |
| Broker/Dealer |
$XBD |
235.84 |
-3.67 |
-1.53% |
-0.63% |
| Retail |
$RLX |
1,937.40 |
-39.28 |
-1.99% |
-0.72% |
| Gold & Silver |
$XAU |
72.17 |
+1.23 |
+1.73% |
+2.14% |
| Bank |
$BKX |
86.22 |
-1.12 |
-1.28% |
+0.50% |
| Biotech |
$BTK |
4,184.99 |
-30.76 |
-0.73% |
-0.85% |
|
|
|
 |
Consolidating Above 50-Day Average Line Near High
Kenneth J. Gruneisen - Passed the CAN SLIM® Master's Exam
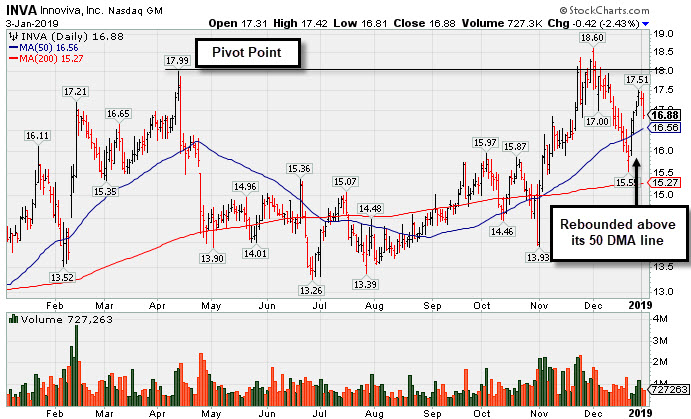
Innoviva Inc (INVA -$0.47 or -2.74% to $16.83) is consolidating above its 50-day moving average (DMA) line ($16.56). It faces little resistance due to overhead supply. Subsequent gains and a strong close above the pivot point backed by at least +40% above average volume may trigger a technical buy signal. However, any new buying efforts are discouraged under the fact-based investment system until a new confirmed market rally (M criteria) with a follow-through day is noted.
It was highlighted in yellow with pivot point cited based on its 4/12/18 high plus 10 cents in the 11/23/18 mid-day report (read here) and last shown in this FSU section on 12/13/18 with an annotated graph under the headline, "Perched Near High With Volume Totals Cooling".
Earnings increases in quarterly comparisons through Sep '18 have been above the +25% minimum guideline (C criteria). Annual earnings (A criteria) growth has been good after turning a profitable FY '15. It has earned a 94 Earnings Per Share Rating, well above the 80+ minimum for buy candidates.
The number of top-rated funds owning its shares rose from 351 in Dec '17 to 390 in Sep '18, a reassuring sign concerning the I criteria. The current Up/Down Volume Ratio of 1.0 is an unbiased indication its shares have been neutral concerning accumulation/distribution over the past 50 days. There are only 66.7 million shares in the public float (S criteria). It has earned an A Timeliness Rating and C Sponsorship Rating.
Charts courtesy of www.stockcharts.com
 |
|
|
Color Codes Explained :
Y - Better candidates highlighted by our
staff of experts.
G - Previously featured
in past reports as yellow but may no longer be buyable under the
guidelines.
***Last / Change / Volume data in this table is the closing quote data***
Symbol/Exchange
Company Name
Industry Group |
PRICE |
CHANGE
(%Change) |
Day High |
Volume
(% DAV)
(% 50 day avg vol) |
52 Wk Hi
% From Hi |
Featured
Date |
Price
Featured |
Pivot Featured |
|
Max Buy |
MLR
-
NYSE
Miller Industries Inc
AUTOMOTIVE - Auto Parts
|
$26.95
|
-0.39
-1.43% |
$27.98
|
31,827
88.41% of 50 DAV
50 DAV is 36,000
|
$29.40
-8.33%
|
11/30/2018
|
$28.35
|
PP = $29.50
|
|
MB = $30.98
|
Most Recent Note - 1/2/2019 7:46:33 PM
Y - Consolidating above its closely coinciding 50-day and 200-day moving average (DMA) lines. Resistance still remains due to overhead supply up to the $29 level.
>>> FEATURED STOCK ARTICLE : Failed to Produce Buy Signal and Deterioration Raised Concern - 12/20/2018 |
View all notes |
Set NEW NOTE alert |
Company Profile |
SEC
News |
Chart |
Request a new note
C
A
S
I |
UBNT
-
NASDAQ
Ubiquiti Networks
TELECOMMUNICATIONS - Diversified Communication Serv
|
$95.95
|
-3.36
-3.38% |
$99.72
|
256,508
56.38% of 50 DAV
50 DAV is 455,000
|
$115.44
-16.88%
|
11/9/2018
|
$108.20
|
PP = $101.43
|
|
MB = $106.50
|
Most Recent Note - 1/2/2019 7:08:07 PM
G - Halted its slide last week, however, a rebound above the 50 DMA line ($101.26) is still needed for its outlook to improve. Fundamentals remain strong. See the latest FSU analysis for more details and a new annotated graph.
>>> FEATURED STOCK ARTICLE : Needs Rebound Above 50-Day Average to Help Outlook - 1/2/2019 |
View all notes |
Set NEW NOTE alert |
Company Profile |
SEC
News |
Chart |
Request a new note
C
A
S
I |
PLNT
-
NYSE
Planet Fitness Inc Cl A
Leisure-Services
|
$52.80
|
-0.78
-1.46% |
$53.62
|
689,272
54.97% of 50 DAV
50 DAV is 1,254,000
|
$58.50
-9.74%
|
11/7/2018
|
$57.10
|
PP = $55.45
|
|
MB = $58.22
|
Most Recent Note - 1/2/2019 7:48:34 PM
Y - Consolidating above its 50 DMA line ($52). It faces little resistance due to overhead supply up to the $58.50 level. The recent low ($48.00) and its 200 DMA line ($46.90) define the next important support. More damaging losses would raise concerns and trigger technical sell signals.
>>> FEATURED STOCK ARTICLE : Fitness Firm Remains Near High Despite Unhealthy Environment - 12/14/2018 |
View all notes |
Set NEW NOTE alert |
Company Profile |
SEC
News |
Chart |
Request a new note
C
A
S
I |
INVA
-
NASDAQ
Innoviva Inc
Medical-Biomed/Biotech
|
$16.88
|
-0.42
-2.43% |
$17.43
|
727,263
62.27% of 50 DAV
50 DAV is 1,168,000
|
$18.60
-9.25%
|
11/23/2018
|
$17.74
|
PP = $18.09
|
|
MB = $18.99
|
 Most Recent Note - 1/3/2019 6:01:27 PM
Y - Pulled back for a second day in a row, consolidating above its 50 DMA line ($16.566). Faces little resistance due to overhead supply. A volume-driven gain above the pivot point is still needed to trigger a technical buy signal. See the latest FSU analysis for more details and an annotated graph.
>>> FEATURED STOCK ARTICLE : Consolidating Above 50-Day Average Line Near High - 1/3/2019 |
View all notes |
Set NEW NOTE alert |
Company Profile |
SEC
News |
Chart |
Request a new note
C
A
S
I |
|
|
|
THESE ARE NOT BUY RECOMMENDATIONS!
Comments contained in the body of this report are technical
opinions only. The material herein has been obtained
from sources believed to be reliable and accurate, however,
its accuracy and completeness cannot be guaranteed.
This site is not an investment advisor, hence it does
not endorse or recommend any securities or other investments.
Any recommendation contained in this report may not
be suitable for all investors and it is not to be deemed
an offer or solicitation on our part with respect to
the purchase or sale of any securities. All trademarks,
service marks and trade names appearing in this report
are the property of their respective owners, and are
likewise used for identification purposes only.
This report is a service available
only to active Paid Premium Members.
You may opt-out of receiving report notifications
at any time. Questions or comments may be submitted
by writing to Premium Membership Services 665 S.E. 10 Street, Suite 201 Deerfield Beach, FL 33441-5634 or by calling 1-800-965-8307
or 954-785-1121.
|
|
|

