You are not logged in.
This means you
CAN ONLY VIEW reports that were published prior to Monday, February 19, 2024.
You
MUST UPGRADE YOUR MEMBERSHIP if you want to see any current reports.
AFTER MARKET UPDATE - THURSDAY, JANUARY 2ND, 2020
Previous After Market Report Next After Market Report >>>
|
|
|
|
DOW |
+330.36 |
28,868.80 |
+1.16% |
|
Volume |
863,199,290 |
+6% |
|
Volume |
2,828,624,400 |
+30% |
|
NASDAQ |
+119.59 |
9,092.19 |
+1.33% |
|
Advancers |
1,745 |
61% |
|
Advancers |
1,876 |
59% |
|
S&P 500 |
+27.07 |
3,257.85 |
+0.84% |
|
Decliners |
1,101 |
39% |
|
Decliners |
1,316 |
41% |
|
Russell 2000 |
-1.70 |
1,666.77 |
-0.10% |
|
52 Wk Highs |
214 |
|
|
52 Wk Highs |
265 |
|
|
S&P 600 |
-0.35 |
1,020.83 |
-0.03% |
|
52 Wk Lows |
5 |
|
|
52 Wk Lows |
17 |
|
|
 |
Major Indices Extend Rally to Start the New Year
Kenneth J. Gruneisen - Passed the CAN SLIM® Master's Exam
The S&P 500 advanced 0.8%, while the Dow climbed 330 points. The Nasdaq Composite rallied 1.3%, posting its best day since early October. All three benchmarks vaulted to fresh record closing levels. This follows Tuesday’s session where the S&P 500 and Nasdaq Composite each capped their strongest annual performance since 2013, while the Dow notched its best year since 2017. Advancers led decliners by a 3-2 margin on the NYSE and nearly 3-2 on the Nasdaq exchange. The volume totals were higher than the prior session's totals on the NYSE and on the Nasdaq exchange. There were 71 high-ranked companies from the Leaders List that hit a new 52-week high and were listed on the BreakOuts Page, versus the total of 37 on the prior session. New 52-week highs totals expanded and easily outnumbered new 52-week lows totals on the NYSE and on the Nasdaq exchange. The major indices (M criteria) are in a "confirmed uptrend" after enduring distributional pressure in recent weeks. The Featured Stocks Page provides the most timely analysis on high-ranked leaders. Charts used courtesy of www.stockcharts.com
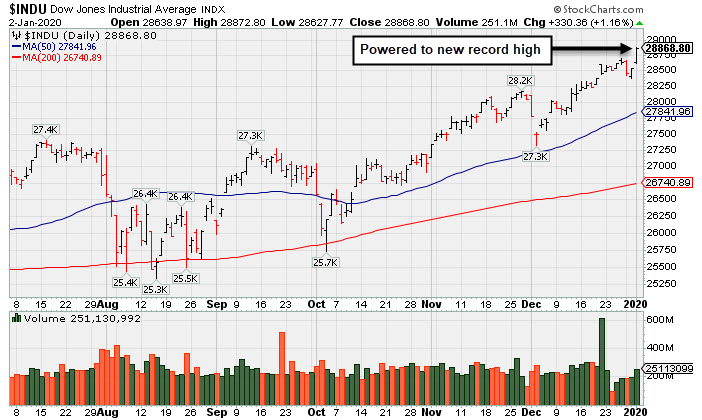
PICTURED: The Dow Jones Industrial Average powered to a new record high.
Stocks closed at new all-time highs on Thursday as more accommodative monetary policy from China provided a tailwind to global risk assets to start 2020. China’s central bank announced plans to reduce the required reserve ratios for banks to help support its economy.
Seven of 11 S&P 500 sectors closed in positive territory, with Technology shares pacing gains, up 1.7%. Apple (AAPL +2.28%) floated above $300 per share for the first time. Semiconductors outperformed, with Advanced Micro Devices (AMD +7.06%) touching its first record high since 2000. Utilities led the laggards, while other traditionally defensive groups also trailed.
Treasuries strengthened, with the yield on the 10-year note down four basis points to 1.88%. On the data front, initial jobless claims came in at 222,000 in the most recent period, the lowest in four weeks. However, the four-week moving average increased to the highest since January 2018 amid the more volatile holiday season.
In commodities, WTI crude rose 0.2% to $61.18/barrel as U.S.-China trade optimism was countered by a stronger U.S. dollar. COMEX gold added 0.5% to $1,531.00/ounce on the heels of its strongest annual performance since 2010.
|
 Kenneth J. Gruneisen started out as a licensed stockbroker in August 1987, a couple of months prior to the historic stock market crash that took the Dow Jones Industrial Average down -22.6% in a single day. He has published daily fact-based fundamental and technical analysis on high-ranked stocks online for two decades. Through FACTBASEDINVESTING.COM, Kenneth provides educational articles, news, market commentary, and other information regarding proven investment systems that work in good times and bad.
Comments contained in the body of this report are technical opinions only and are not necessarily those of Gruneisen Growth Corp. The material herein has been obtained from sources believed to be reliable and accurate, however, its accuracy and completeness cannot be guaranteed. Our firm, employees, and customers may effect transactions, including transactions contrary to any recommendation herein, or have positions in the securities mentioned herein or options with respect thereto. Any recommendation contained in this report may not be suitable for all investors and it is not to be deemed an offer or solicitation on our part with respect to the purchase or sale of any securities. |
|
 |
Retail Financial, Semiconductor, Networking, and Energy Groups Rose
Kenneth J. Gruneisen - Passed the CAN SLIM® Master's Exam
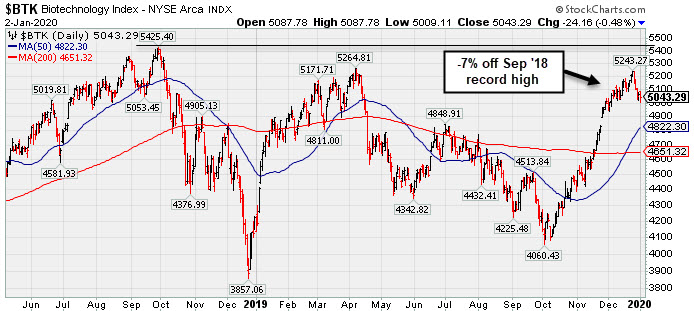
The Retail Index ($RLX +1.41%), Broker/Dealer Index ($XBD +1.22%), and the Bank Index ($BKX +0.67%) posted gains. The tech sector was mixed as the Biotech Index ($BTK -0.48%) fell while the Semiconductor Index ($SOX +2.07%) and the Networking Index ($NWX +0.86%) each posted gains. The Gold & Silver Index ($XAU -0.39%) edged lower while the Oil Services Index ($OSX +0.66%) and the Integrated Oil Index ($XOI +1.00%) both rose.
PICTURED: The Biotech Index ($BTK -0.48%) is perched -7% off its record high.
| Oil Services |
$OSX |
78.81 |
+0.52 |
+0.66% |
+0.66% |
| Integrated Oil |
$XOI |
1,283.23 |
+12.69 |
+1.00% |
+1.00% |
| Semiconductor |
$SOX |
1,887.91 |
+38.29 |
+2.07% |
+2.07% |
| Networking |
$NWX |
588.40 |
+5.00 |
+0.86% |
+0.86% |
| Broker/Dealer |
$XBD |
293.92 |
+3.54 |
+1.22% |
+1.22% |
| Retail |
$RLX |
2,483.70 |
+34.43 |
+1.41% |
+1.41% |
| Gold & Silver |
$XAU |
106.51 |
-0.41 |
-0.38% |
-0.38% |
| Bank |
$BKX |
114.12 |
+0.76 |
+0.67% |
+0.67% |
| Biotech |
$BTK |
5,043.29 |
-24.16 |
-0.48% |
-0.48% |
|
|
|
 |
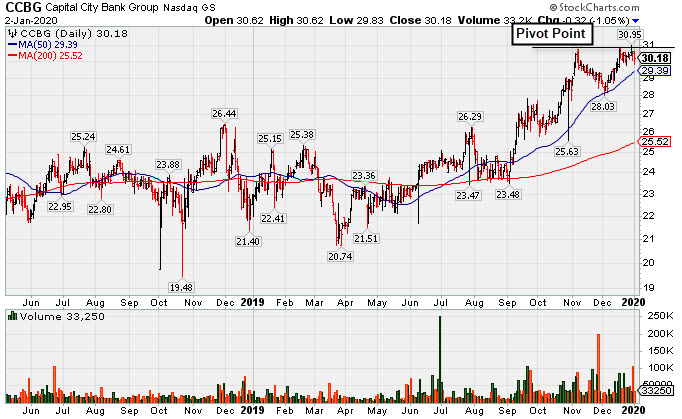
Perched Near 52-Week High After Forming an Orderly Base
Kenneth J. Gruneisen - Passed the CAN SLIM® Master's Exam
Capital City Bk Gp (CCBG -$0.32 or -1.05% to $30.18) is hovering within close striking distance of its 52-week high, recently meeting resistance. Subsequent gains and a strong close above the new pivot point cited based on its 11/06/19 high plus 10 cents may trigger a new (or add-on) technical buy signal. It found support at its 50-day moving average (DMA) line ($29.47) during its orderly consolidation. Below that important near-term average the prior highs which define important support to watch. More damaging losses would raise concerns and trigger a technical sell signal.
CCBG was highlighted in yellow with pivot point cited based on its 12/03/18 high plus 10 cents in the 9/13/19 mid-day report (read here). It was last shown in this FSU section on 12/10/19 with an annotated graph under the headline, "Found Support at 50-Day Moving Average".
Earnings increases in the 4 latest quarterly comparisons through Sep '19 were above the +25% minimum guideline (C criteria) as its sales revenues growth rate was in the 9-13% range versus the year ago periods. It has a Timeliness Rating of A, but a Sponsorship Rating of D.
Its small supply of only 16.7 million shares outstanding (S criteria) can contribute to greater price volatility in the event of institutional buying or selling. The number of top-rated funds owning its shares rose from 159 on Sep '18 to 184 in Sep '19, a reassuring sign concerning the I criteria. Its current Up/Down Volume Ratio of 1.2 is an unbiased indication its shares have been under slight accumulation over the past 50 days.
|
|
|
Color Codes Explained :
Y - Better candidates highlighted by our
staff of experts.
G - Previously featured
in past reports as yellow but may no longer be buyable under the
guidelines.
***Last / Change / Volume data in this table is the closing quote data***
Symbol/Exchange
Company Name
Industry Group |
PRICE |
CHANGE
(%Change) |
Day High |
Volume
(% DAV)
(% 50 day avg vol) |
52 Wk Hi
% From Hi |
Featured
Date |
Price
Featured |
Pivot Featured |
|
Max Buy |
 MLR
-
NYSE
MLR
-
NYSE
Miller Industries Inc
AUTOMOTIVE - Auto Parts
|
$36.90
|
-0.23
-0.62% |
$37.37
|
20,889
44.44% of 50 DAV
50 DAV is 47,000
|
$38.18
-3.35%
|
9/24/2019
|
$34.00
|
PP = $35.36
|
|
MB = $37.13
|
 Most Recent Note - 1/2/2020 4:44:22 PM
G - Still quietly hovering near its 52-week high and just above its "max buy" level. Its 50 DMA line ($36.15) and prior highs in the $35 area define near-term support to watch. Resilient after reporting Sep '19 earnings which were below the fundamental guidelines of the fact-based investment system.
>>> FEATURED STOCK ARTICLE : Towing/Recovery Equipment Firm Remains Perched Near Record High - 12/27/2019 |
View all notes |
Set NEW NOTE alert |
Company Profile |
SEC
News |
Chart |
Request a new note
C
A
S
I |
CCBG
-
NASDAQ
Capital City Bk Gp
BANKING - Regional - Mid-Atlantic Banks
|
$30.18
|
-0.32
-1.05% |
$30.62
|
33,250
72.28% of 50 DAV
50 DAV is 46,000
|
$30.95
-2.49%
|
12/16/2019
|
$30.07
|
PP = $30.95
|
|
MB = $32.50
|
Most Recent Note - 1/2/2020 3:59:16 PM
Y - Hovering within close striking distance of its 52-week high, recently meeting resistance. Subsequent gains and a strong close above the new pivot point cited based on its 11/06/19 high plus 10 cents may trigger a new (or add-on) technical buy signal. Found support at its 50 DMA line ($29.47) during its orderly consolidation.
>>> FEATURED STOCK ARTICLE : Perched Near 52-Week High After Forming an Orderly Base - 1/2/2020 |
View all notes |
Set NEW NOTE alert |
Company Profile |
SEC
News |
Chart |
Request a new note
C
A
S
I |
FTNT
-
NASDAQ
Fortinet Inc
Computer Sftwr-Security
|
$109.68
|
+2.92
2.74% |
$110.29
|
1,102,848
81.33% of 50 DAV
50 DAV is 1,356,000
|
$110.28
-0.54%
|
12/9/2019
|
$103.85
|
PP = $106.10
|
|
MB = $111.41
|
Most Recent Note - 12/30/2019 6:27:03 PM
Y - Volume totals have been cooling while stubbornly holding its ground near its 52-week high. Confirming gains above the pivot point backed by at least +40% above average volume are needed to trigger a convincing technical buy signal. Its 50 DMA line ($98.09) and prior high in the $97 area define important near-term support to watch.
>>> FEATURED STOCK ARTICLE : Endured Distributional Pressure While Perched at High - 12/23/2019 |
View all notes |
Set NEW NOTE alert |
Company Profile |
SEC
News |
Chart |
Request a new note
C
A
S
I |
SPSC
-
NASDAQ
S P S Commerce Inc
COMPUTER SOFTWARE and SERVICES - Application Software
|
$56.10
|
+0.68
1.23% |
$56.37
|
131,906
65.43% of 50 DAV
50 DAV is 201,600
|
$59.14
-5.14%
|
11/29/2019
|
$56.59
|
PP = $59.24
|
|
MB = $62.20
|
Most Recent Note - 1/2/2020 4:09:53 PM
Y - Still perched -5.3% off its all-time high. Subsequent gains above its pivot point backed by at least +40% above average volume are needed to trigger a new technical buy signal. Fundamentals remain strong, however, its Relative Strength Rating has slumped to 78, below the 80+ minimum guideline for buy candidates..
>>> FEATURED STOCK ARTICLE : Perched Within Close Striking Distance of 52-Week High - 12/20/2019 |
View all notes |
Set NEW NOTE alert |
Company Profile |
SEC
News |
Chart |
Request a new note
C
A
S
I |
AUDC
-
NASDAQ
Audiocodes Ltd
ELECTRONICS - Scientific and Technical Instrum
|
$26.33
|
+0.64
2.49% |
$26.68
|
325,284
120.92% of 50 DAV
50 DAV is 269,000
|
$26.00
1.27%
|
9/13/2019
|
$19.68
|
PP = $19.84
|
|
MB = $20.83
|
Most Recent Note - 12/30/2019 6:21:42 PM
G - Perched at its all-time high, stubbornly holding its ground very extended from the previously noted base. Prior highs in the $22 area define support along with its 50 DMA line ($22.78). Fundamentals remain strong.
>>> FEATURED STOCK ARTICLE : Reversed Into Red After Hitting Yet Another New High - 12/13/2019 |
View all notes |
Set NEW NOTE alert |
Company Profile |
SEC
News |
Chart |
Request a new note
C
A
S
I |
Symbol/Exchange
Company Name
Industry Group |
PRICE |
CHANGE
(%Change) |
Day High |
Volume
(% DAV)
(% 50 day avg vol) |
52 Wk Hi
% From Hi |
Featured
Date |
Price
Featured |
Pivot Featured |
|
Max Buy |
CHDN
-
NASDAQ
Churchill Downs Inc
LEISURE - Gaming Activities
|
$135.79
|
-1.41
-1.03% |
$137.87
|
266,093
101.95% of 50 DAV
50 DAV is 261,000
|
$138.17
-1.72%
|
10/8/2019
|
$129.77
|
PP = $132.83
|
|
MB = $139.47
|
Most Recent Note - 12/30/2019 6:23:21 PM
G - Posted a 3rd consecutive gain today with light volume while hitting a new 52-week high. Its 50 DMA line ($130.63) defines near-term support above the prior low ($121.81 on 11/07/19) The Jun and Sep '19 quarterly earnings versus the year ago periods were both below the +25% minimum guideline (C criteria) and raised fundamental concerns. See the latest FSU analysis for more details and a new annotated graph.
>>> FEATURED STOCK ARTICLE : Touched a New HIgh With Gains Backed by Light Volume - 12/30/2019 |
View all notes |
Set NEW NOTE alert |
Company Profile |
SEC
News |
Chart |
Request a new note
C
A
S
I |
LULU
-
NASDAQ
Lululemon Athletica
MANUFACTURING - Textile Manufacturing
|
$233.42
|
+1.75
0.76% |
$233.47
|
1,418,459
70.43% of 50 DAV
50 DAV is 2,014,000
|
$235.50
-0.88%
|
9/6/2019
|
$201.25
|
PP = $194.35
|
|
MB = $204.07
|
Most Recent Note - 12/30/2019 6:28:24 PM
G - Extended from any sound base, and its 50 DMA line ($217) defines near-term support above the prior high ($209). Recently reported earnings +28% on +23% sales revenues for the Oct '19 quarter.
>>> FEATURED STOCK ARTICLE : Retreated From High After Another Strong Earnings Report - 12/17/2019 |
View all notes |
Set NEW NOTE alert |
Company Profile |
SEC
News |
Chart |
Request a new note
C
A
S
I |
CPRT
-
NASDAQ
Copart Inc
SPECIALTY RETAIL - Auto Dealerships
|
$93.48
|
+2.54
2.79% |
$93.57
|
2,610,711
141.50% of 50 DAV
50 DAV is 1,845,000
|
$92.41
1.16%
|
1/2/2020
|
$92.80
|
PP = $92.51
|
|
MB = $97.14
|
Most Recent Note - 1/2/2020 4:04:34 PM
Y - Posted a gain today with near average volume for a new all-time high. Color code is changed to yellow with new pivot point cited based on its 11/25/19 high plus 10 cents. Subsequent gains above the pivot point must have at least +40% above average volume to trigger a proper new (or add-on) technical buy signal. Its 50 DMA line ($86.92) defines near-term support. Fundamentals remain strong.
>>> FEATURED STOCK ARTICLE : Extended From Prior Base and Hovering Near Record High - 12/12/2019 |
View all notes |
Set NEW NOTE alert |
Company Profile |
SEC
News |
Chart |
Request a new note
C
A
S
I |
NMIH
-
NASDAQ
N M I Holdings Inc Cl A
Finance-MrtgandRel Svc
|
$32.27
|
-0.91
-2.74% |
$33.37
|
841,216
166.58% of 50 DAV
50 DAV is 505,000
|
$35.79
-9.84%
|
11/8/2019
|
$32.89
|
PP = $31.44
|
|
MB = $33.01
|
Most Recent Note - 1/2/2020 12:22:27 PM
G - Violating its 50 DMA line ($32.46) with today's loss on higher volume raising concerns. Only a prompt rebound would help its outlook improve. Prior highs in the $30-31 area define the next important near-term support. Fundamentals remain strong.
>>> FEATURED STOCK ARTICLE : Hit New High But Encountered Distributional Pressure - 12/19/2019 |
View all notes |
Set NEW NOTE alert |
Company Profile |
SEC
News |
Chart |
Request a new note
C
A
S
I |
SPLK
-
NASDAQ
Splunk Inc
Computer Sftwr-Database
|
$151.98
|
+2.21
1.48% |
$153.44
|
1,103,643
54.53% of 50 DAV
50 DAV is 2,024,000
|
$153.66
-1.09%
|
11/25/2019
|
$147.79
|
PP = $142.16
|
|
MB = $149.27
|
Most Recent Note - 12/30/2019 6:30:50 PM
Y - Color code is changed to yellow while consolidating just below its "max buy" level with losses on light volume. Prior highs in the $142-143 area define initial support to watch on pullbacks.
>>> FEATURED STOCK ARTICLE : Consolidating Above Prior Highs Following Impressive Rally - 12/16/2019 |
View all notes |
Set NEW NOTE alert |
Company Profile |
SEC
News |
Chart |
Request a new note
C
A
S
I |
Symbol/Exchange
Company Name
Industry Group |
PRICE |
CHANGE
(%Change) |
Day High |
Volume
(% DAV)
(% 50 day avg vol) |
52 Wk Hi
% From Hi |
Featured
Date |
Price
Featured |
Pivot Featured |
|
Max Buy |
PAYC
-
NYSE
Paycom Software Inc
COMPUTER SOFTWARE and SERVICES - Application Software
|
$271.80
|
+7.04
2.66% |
$271.98
|
385,610
69.23% of 50 DAV
50 DAV is 557,000
|
$279.95
-2.91%
|
11/20/2019
|
$252.97
|
PP = $259.81
|
|
MB = $272.80
|
Most Recent Note - 12/30/2019 6:29:35 PM
Y - Still consolidating above its pivot point and below its "max buy" level. Fundamentals remain strong.
>>> FEATURED STOCK ARTICLE : Consolidating Near Prior Highs Which Define Initial Support - 12/11/2019 |
View all notes |
Set NEW NOTE alert |
Company Profile |
SEC
News |
Chart |
Request a new note
C
A
S
I |
BLD
-
NYSE
Topbuild Corp
Bldg-Constr Prds/Misc
|
$103.11
|
+0.03
0.03% |
$103.85
|
186,930
63.15% of 50 DAV
50 DAV is 296,000
|
$113.74
-9.35%
|
12/9/2019
|
$109.71
|
PP = $113.84
|
|
MB = $119.53
|
Most Recent Note - 12/30/2019 6:32:22 PM
G - A rebound above its 50 DMA line ($105.87) still is needed for its outlook to improve.
>>> FEATURED STOCK ARTICLE : Recent Slump Below 50-Day Moving Average Did Technical Damage - 12/24/2019 |
View all notes |
Set NEW NOTE alert |
Company Profile |
SEC
News |
Chart |
Request a new note
C
A
S
I |
GLOB
-
NYSE
Globant SA
Computer-Tech Services
|
$107.74
|
+1.69
1.59% |
$108.11
|
150,420
55.30% of 50 DAV
50 DAV is 272,000
|
$112.33
-4.09%
|
11/14/2019
|
$106.87
|
PP = $112.43
|
|
MB = $118.05
|
Most Recent Note - 1/2/2020 4:06:28 PM
Y - Color code is changed to yellow while perched only -4.1% off its 52-week high. Subsequent gains above the pivot point backed by at least +40% above average volume are needed to trigger a technical buy signal. Its 50 DMA line ($100.65) defines important near-term support to watch on pullbacks. Fundamentals remain strong.
>>> FEATURED STOCK ARTICLE : Rebound Has Globant Perched Within Striking Distance of High - 12/26/2019 |
View all notes |
Set NEW NOTE alert |
Company Profile |
SEC
News |
Chart |
Request a new note
C
A
S
I |
|
|
|
THESE ARE NOT BUY RECOMMENDATIONS!
Comments contained in the body of this report are technical
opinions only. The material herein has been obtained
from sources believed to be reliable and accurate, however,
its accuracy and completeness cannot be guaranteed.
This site is not an investment advisor, hence it does
not endorse or recommend any securities or other investments.
Any recommendation contained in this report may not
be suitable for all investors and it is not to be deemed
an offer or solicitation on our part with respect to
the purchase or sale of any securities. All trademarks,
service marks and trade names appearing in this report
are the property of their respective owners, and are
likewise used for identification purposes only.
This report is a service available
only to active Paid Premium Members.
You may opt-out of receiving report notifications
at any time. Questions or comments may be submitted
by writing to Premium Membership Services 665 S.E. 10 Street, Suite 201 Deerfield Beach, FL 33441-5634 or by calling 1-800-965-8307
or 954-785-1121.
|
|
|