You are not logged in.
This means you
CAN ONLY VIEW reports that were published prior to Saturday, February 24, 2024.
You
MUST UPGRADE YOUR MEMBERSHIP if you want to see any current reports.
AFTER MARKET UPDATE - WEDNESDAY, JANUARY 2ND, 2019
Previous After Market Report Next After Market Report >>>
|
|
|
|
DOW |
+18.78 |
23,346.24 |
+0.08% |
|
Volume |
962,323,370 |
-2% |
|
Volume |
2,288,775,990 |
+8% |
|
NASDAQ |
+30.66 |
6,665.94 |
+0.46% |
|
Advancers |
2,111 |
70% |
|
Advancers |
2,202 |
71% |
|
S&P 500 |
+3.18 |
2,510.03 |
+0.13% |
|
Decliners |
909 |
30% |
|
Decliners |
909 |
29% |
|
Russell 2000 |
+7.35 |
1,355.91 |
+0.54% |
|
52 Wk Highs |
8 |
|
|
52 Wk Highs |
11 |
|
|
S&P 600 |
+3.39 |
848.33 |
+0.40% |
|
52 Wk Lows |
63 |
|
|
52 Wk Lows |
72 |
|
|
 |
Major Indices Inched Higher With Very Little Leadership
Kenneth J. Gruneisen - Passed the CAN SLIM® Master's Exam
Stocks finished higher Wednesday. The Dow added 18 points to 23346 while the S&P 500 gained 3 points to 2510. The Nasdaq Composite advanced 30 points to 6665. The volume totals were higher than the prior session totals on the NYSE and on the Nasdaq exchange. Advancers led decliners by more than a 2-1 margin on the NYSE and on the Nasdaq exchange. Leadership remained elusive, however, as one high-ranked company from the Leaders List made a new 52-week high and was listed on the BreakOuts Page. New 52-week lows totals still solidly outnumbered new 52-week highs totals on both the NYSE and on the Nasdaq exchange. The major indices (M criteria) are still in a correction despite the big day of gains. Disciplined investors will wait for a convincing follow-through day, ideally between Day 4 and Day 7 of the rally attempt, to signal a change in market direction (M criteria) back to a bullish stance. The Featured Stocks Page provides the most timely analysis on high-ranked leaders. Charts used courtesy of www.stockcharts.com

PICTURED: The S&P 500 Index posted a small gain on Day 5 of the new rally attempt.
The major averages rallied in late afternoon trading to start 2019 off on a positive note despite a series of disappointing global manufacturing updates. Overnight, a report showed Chinese manufacturing activity contracted for the first time in 19 months. Separate updates revealed Eurozone manufacturing remained at the lowest level since February 2016 while domestic manufacturing activity cooled to a 13-month low in December. Trade related headlines also garnered attention amid reports U.S. Trade Representative Robert Lighthizer suggested additional tariffs may be warranted in order to receive meaningful concessions from China.
Energy shares paced gains as the group added roughly 2.1% after crude prices rebounded following a report Saudi Arabia has cut its oil exports. Financials and Consumer Discretionary stocks also outperformed as Goldman Sachs (GS +3.0%) and Amazon (AMZN +2.5%) rose. The Real Estate, Utilities, and Healthcare sectors lagged the broader market advance. In corporate news, Tesla (TSLA -6.8%) fell after the electric car maker fell short of analyst expectations for fourth-quarter deliveries and announced price cuts in an attempt to boost sales.
Treasuries strengthened as the yield on the 10-year note down fell three basis points to 2.65%. In commodities, WTI crude rebounded 2.6% to $46.60/barrel. COMEX gold added 0.2% to $1,283.80/ounce. |
 Kenneth J. Gruneisen started out as a licensed stockbroker in August 1987, a couple of months prior to the historic stock market crash that took the Dow Jones Industrial Average down -22.6% in a single day. He has published daily fact-based fundamental and technical analysis on high-ranked stocks online for two decades. Through FACTBASEDINVESTING.COM, Kenneth provides educational articles, news, market commentary, and other information regarding proven investment systems that work in good times and bad.
Comments contained in the body of this report are technical opinions only and are not necessarily those of Gruneisen Growth Corp. The material herein has been obtained from sources believed to be reliable and accurate, however, its accuracy and completeness cannot be guaranteed. Our firm, employees, and customers may effect transactions, including transactions contrary to any recommendation herein, or have positions in the securities mentioned herein or options with respect thereto. Any recommendation contained in this report may not be suitable for all investors and it is not to be deemed an offer or solicitation on our part with respect to the purchase or sale of any securities. |
|
 |
Retail, Financial, Semiconductor, and Commodity-Linked Groups Rose
Kenneth J. Gruneisen - Passed the CAN SLIM® Master's Exam
The Retail Index ($RLX +1.29%), Bank Index ($BKX +1.81%), and the Broker/Dealer Index ($XBD +0.91%) rose. The Semiconductor Index ($SOX +0.88%) rose while the Biotech Index ($BTK -0.12%) and Networking Index ($NWX -0.07%) both ended the session slightly in the red. Commodity-linked groups were positive as the Oil Services Index ($OSX +2.18%), Integrated Oil Index ($XOI +1.90%) outpaced the Gold & Silver Index ($XAU +0.40%).
Charts courtesy of www.stockcharts.com
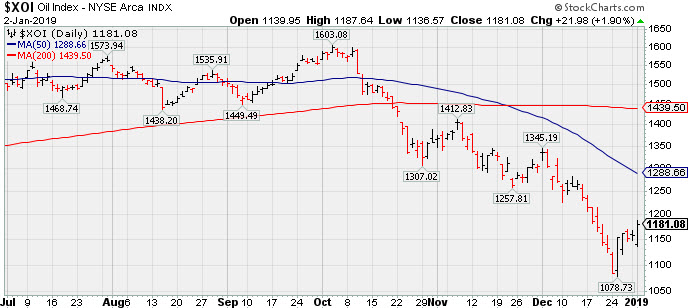 PICTURED: The Integrated Oil Index ($XOI +1.90%) is rebounding after a slump to lows not seen since August 2017.
| Oil Services |
$OSX |
82.36 |
+1.76 |
+2.18% |
+2.18% |
| Integrated Oil |
$XOI |
1,181.08 |
+21.98 |
+1.90% |
+1.90% |
| Semiconductor |
$SOX |
1,165.30 |
+10.13 |
+0.88% |
+0.88% |
| Networking |
$NWX |
488.34 |
-0.33 |
-0.07% |
-0.07% |
| Broker/Dealer |
$XBD |
239.50 |
+2.16 |
+0.91% |
-9.70% |
| Retail |
$RLX |
1,976.68 |
+25.27 |
+1.29% |
+1.29% |
| Gold & Silver |
$XAU |
70.94 |
+0.28 |
+0.40% |
+0.40% |
| Bank |
$BKX |
87.34 |
+1.55 |
+1.81% |
-63.20% |
| Biotech |
$BTK |
4,215.75 |
-5.10 |
-0.12% |
-0.12% |
|
|
|
 |
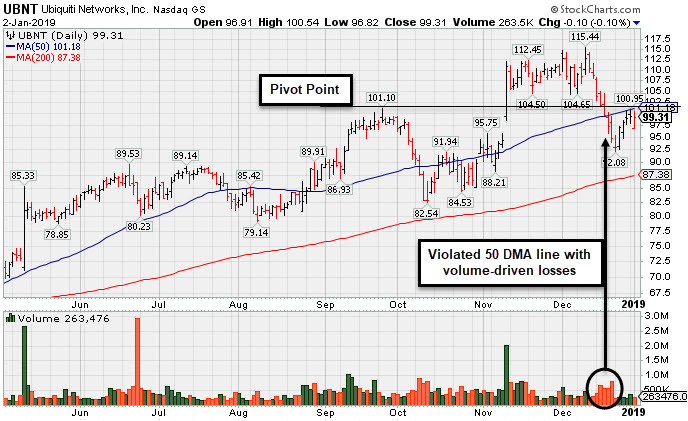
Needs Rebound Above 50-Day Average to Help Outlook
Kenneth J. Gruneisen - Passed the CAN SLIM® Master's Exam
Ubiquiti Networks Inc (UBNT -$0.10 or -0.10% to $99.31) is still sputtering below its 50-day moving average (DMA) line. A rebound above the 50 DMA line ($101.26) is needed for its outlook to improve. It was last shown in this FSU section on 12/11/18 with an annotated graph under the headline, "Volume Totals Cooling While Still Hovering Above "Max Buy" Level". It quickly got extended more than +5% above the prior high and finished strong after highlighted in yellow in the 11/09/18 mid-day report with new pivot point cited based on its 9/25/18 high plus 10 cents (read here). The big gain for a new high with nearly 4 times average volume triggered a technical buy signal. Bullish action came after it reported earnings +27% on +15% sales revenues for the Sep '18 quarter, marking its 3rd consecutive quarterly comparison above the +25% minimum earnings guideline (C criteria), helping it better match the fact-based investment system's fundamental guidelines. The number of top-rated funds owning its shares rose from 262 in Dec '17 to 298 in Sep '18, a reassuring sign concerning the I criteria. Its current Up/Down Volume ratio of 1.0 is an unbiased indication its shares have been neutral concerning accumulation/distribution over the past 50 days. Its small supply of only 14.9 million shares (S criteria) in the public float can contribute to greater price volatility in the event of institutional buying or selling. It has earned a B Timeliness Rating and B Sponsorship Rating. It hails from the Telecom - Infrastructure Industry Group which has a B+ Group Relative Strength Rating, a reassuring sign concerning the L criteria. After a small downturn in FY '15 its annual earnings (A criteria) growth has been strong. That fundamental shortcoming had a role in limiting its appearances since UBNT was shown in this FSU section on 4/20/12 with an annotated graph under the headline, "Formed a New Ascending Base But Did Not Confirm New Buy Signal".
Chart courtesy of www.stockcharts.com
 |
|
|
Color Codes Explained :
Y - Better candidates highlighted by our
staff of experts.
G - Previously featured
in past reports as yellow but may no longer be buyable under the
guidelines.
***Last / Change / Volume data in this table is the closing quote data***
Symbol/Exchange
Company Name
Industry Group |
PRICE |
CHANGE
(%Change) |
Day High |
Volume
(% DAV)
(% 50 day avg vol) |
52 Wk Hi
% From Hi |
Featured
Date |
Price
Featured |
Pivot Featured |
|
Max Buy |
MLR
-
NYSE
Miller Industries Inc
AUTOMOTIVE - Auto Parts
|
$27.34
|
+0.34
1.26% |
$27.63
|
37,746
104.85% of 50 DAV
50 DAV is 36,000
|
$29.40
-7.01%
|
11/30/2018
|
$28.35
|
PP = $29.50
|
|
MB = $30.98
|
 Most Recent Note - 1/2/2019 7:46:33 PM
Y - Consolidating above its closely coinciding 50-day and 200-day moving average (DMA) lines. Resistance still remains due to overhead supply up to the $29 level.
>>> FEATURED STOCK ARTICLE : Failed to Produce Buy Signal and Deterioration Raised Concern - 12/20/2018 |
View all notes |
Set NEW NOTE alert |
Company Profile |
SEC
News |
Chart |
Request a new note
C
A
S
I |
UBNT
-
NASDAQ
Ubiquiti Networks
TELECOMMUNICATIONS - Diversified Communication Serv
|
$99.31
|
-0.10
-0.10% |
$100.54
|
263,369
57.63% of 50 DAV
50 DAV is 457,000
|
$115.44
-13.97%
|
11/9/2018
|
$108.20
|
PP = $101.43
|
|
MB = $106.50
|
Most Recent Note - 1/2/2019 7:08:07 PM
G - Halted its slide last week, however, a rebound above the 50 DMA line ($101.26) is still needed for its outlook to improve. Fundamentals remain strong. See the latest FSU analysis for more details and a new annotated graph.
>>> FEATURED STOCK ARTICLE : Needs Rebound Above 50-Day Average to Help Outlook - 1/2/2019 |
View all notes |
Set NEW NOTE alert |
Company Profile |
SEC
News |
Chart |
Request a new note
C
A
S
I |
PLNT
-
NYSE
Planet Fitness Inc Cl A
Leisure-Services
|
$53.58
|
-0.04
-0.07% |
$54.12
|
1,331,517
106.95% of 50 DAV
50 DAV is 1,245,000
|
$58.50
-8.41%
|
11/7/2018
|
$57.10
|
PP = $55.45
|
|
MB = $58.22
|
Most Recent Note - 1/2/2019 7:48:34 PM
Y - Consolidating above its 50 DMA line ($52). It faces little resistance due to overhead supply up to the $58.50 level. The recent low ($48.00) and its 200 DMA line ($46.90) define the next important support. More damaging losses would raise concerns and trigger technical sell signals.
>>> FEATURED STOCK ARTICLE : Fitness Firm Remains Near High Despite Unhealthy Environment - 12/14/2018 |
View all notes |
Set NEW NOTE alert |
Company Profile |
SEC
News |
Chart |
Request a new note
C
A
S
I |
INVA
-
NASDAQ
Innoviva Inc
Medical-Biomed/Biotech
|
$17.30
|
-0.15
-0.86% |
$17.48
|
832,971
71.38% of 50 DAV
50 DAV is 1,167,000
|
$18.60
-6.99%
|
11/23/2018
|
$17.74
|
PP = $18.09
|
|
MB = $18.99
|
Most Recent Note - 1/2/2019 7:45:57 PM
Y - Consolidating above its 50 DMA line ($16.53). Faces little resistance due to overhead supply. A volume-driven gain above the pivot point is still needed to trigger a technical buy signal.
>>> FEATURED STOCK ARTICLE : Perched Near High With Volume Totals Cooling - 12/13/2018 |
View all notes |
Set NEW NOTE alert |
Company Profile |
SEC
News |
Chart |
Request a new note
C
A
S
I |
|
|
|
THESE ARE NOT BUY RECOMMENDATIONS!
Comments contained in the body of this report are technical
opinions only. The material herein has been obtained
from sources believed to be reliable and accurate, however,
its accuracy and completeness cannot be guaranteed.
This site is not an investment advisor, hence it does
not endorse or recommend any securities or other investments.
Any recommendation contained in this report may not
be suitable for all investors and it is not to be deemed
an offer or solicitation on our part with respect to
the purchase or sale of any securities. All trademarks,
service marks and trade names appearing in this report
are the property of their respective owners, and are
likewise used for identification purposes only.
This report is a service available
only to active Paid Premium Members.
You may opt-out of receiving report notifications
at any time. Questions or comments may be submitted
by writing to Premium Membership Services 665 S.E. 10 Street, Suite 201 Deerfield Beach, FL 33441-5634 or by calling 1-800-965-8307
or 954-785-1121.
|
|
|

